 Media resourcesMedia resources
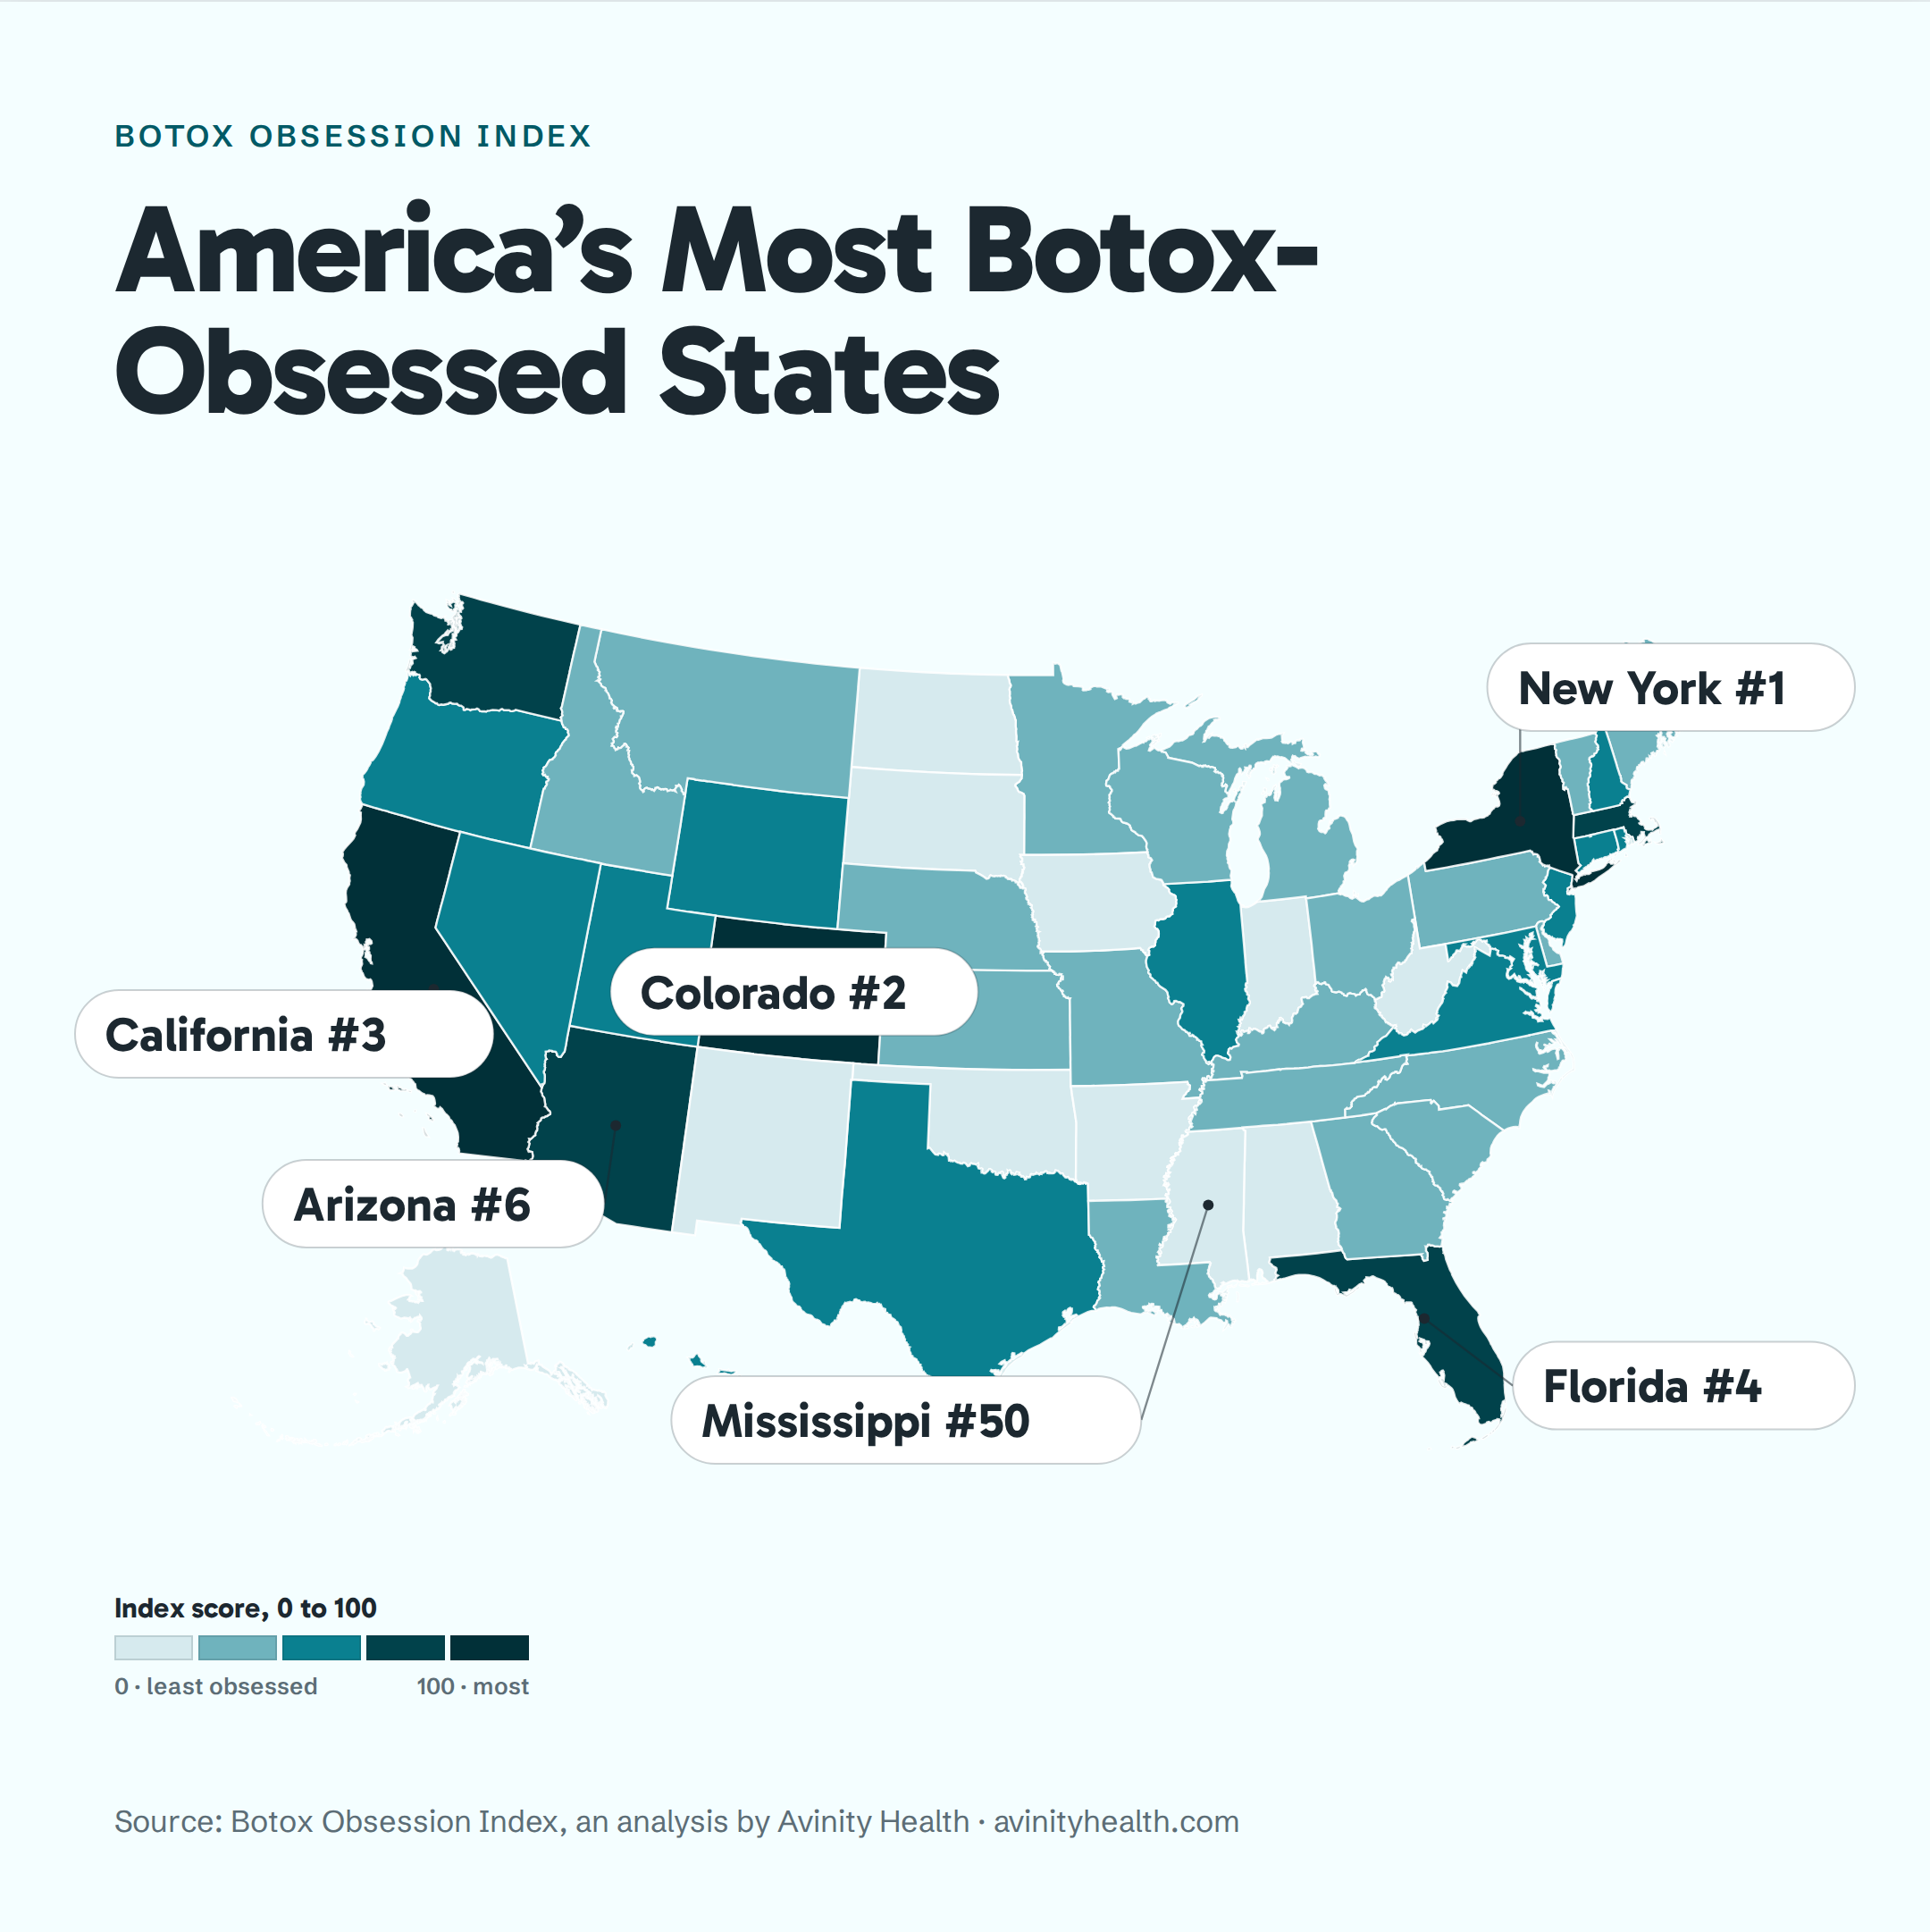
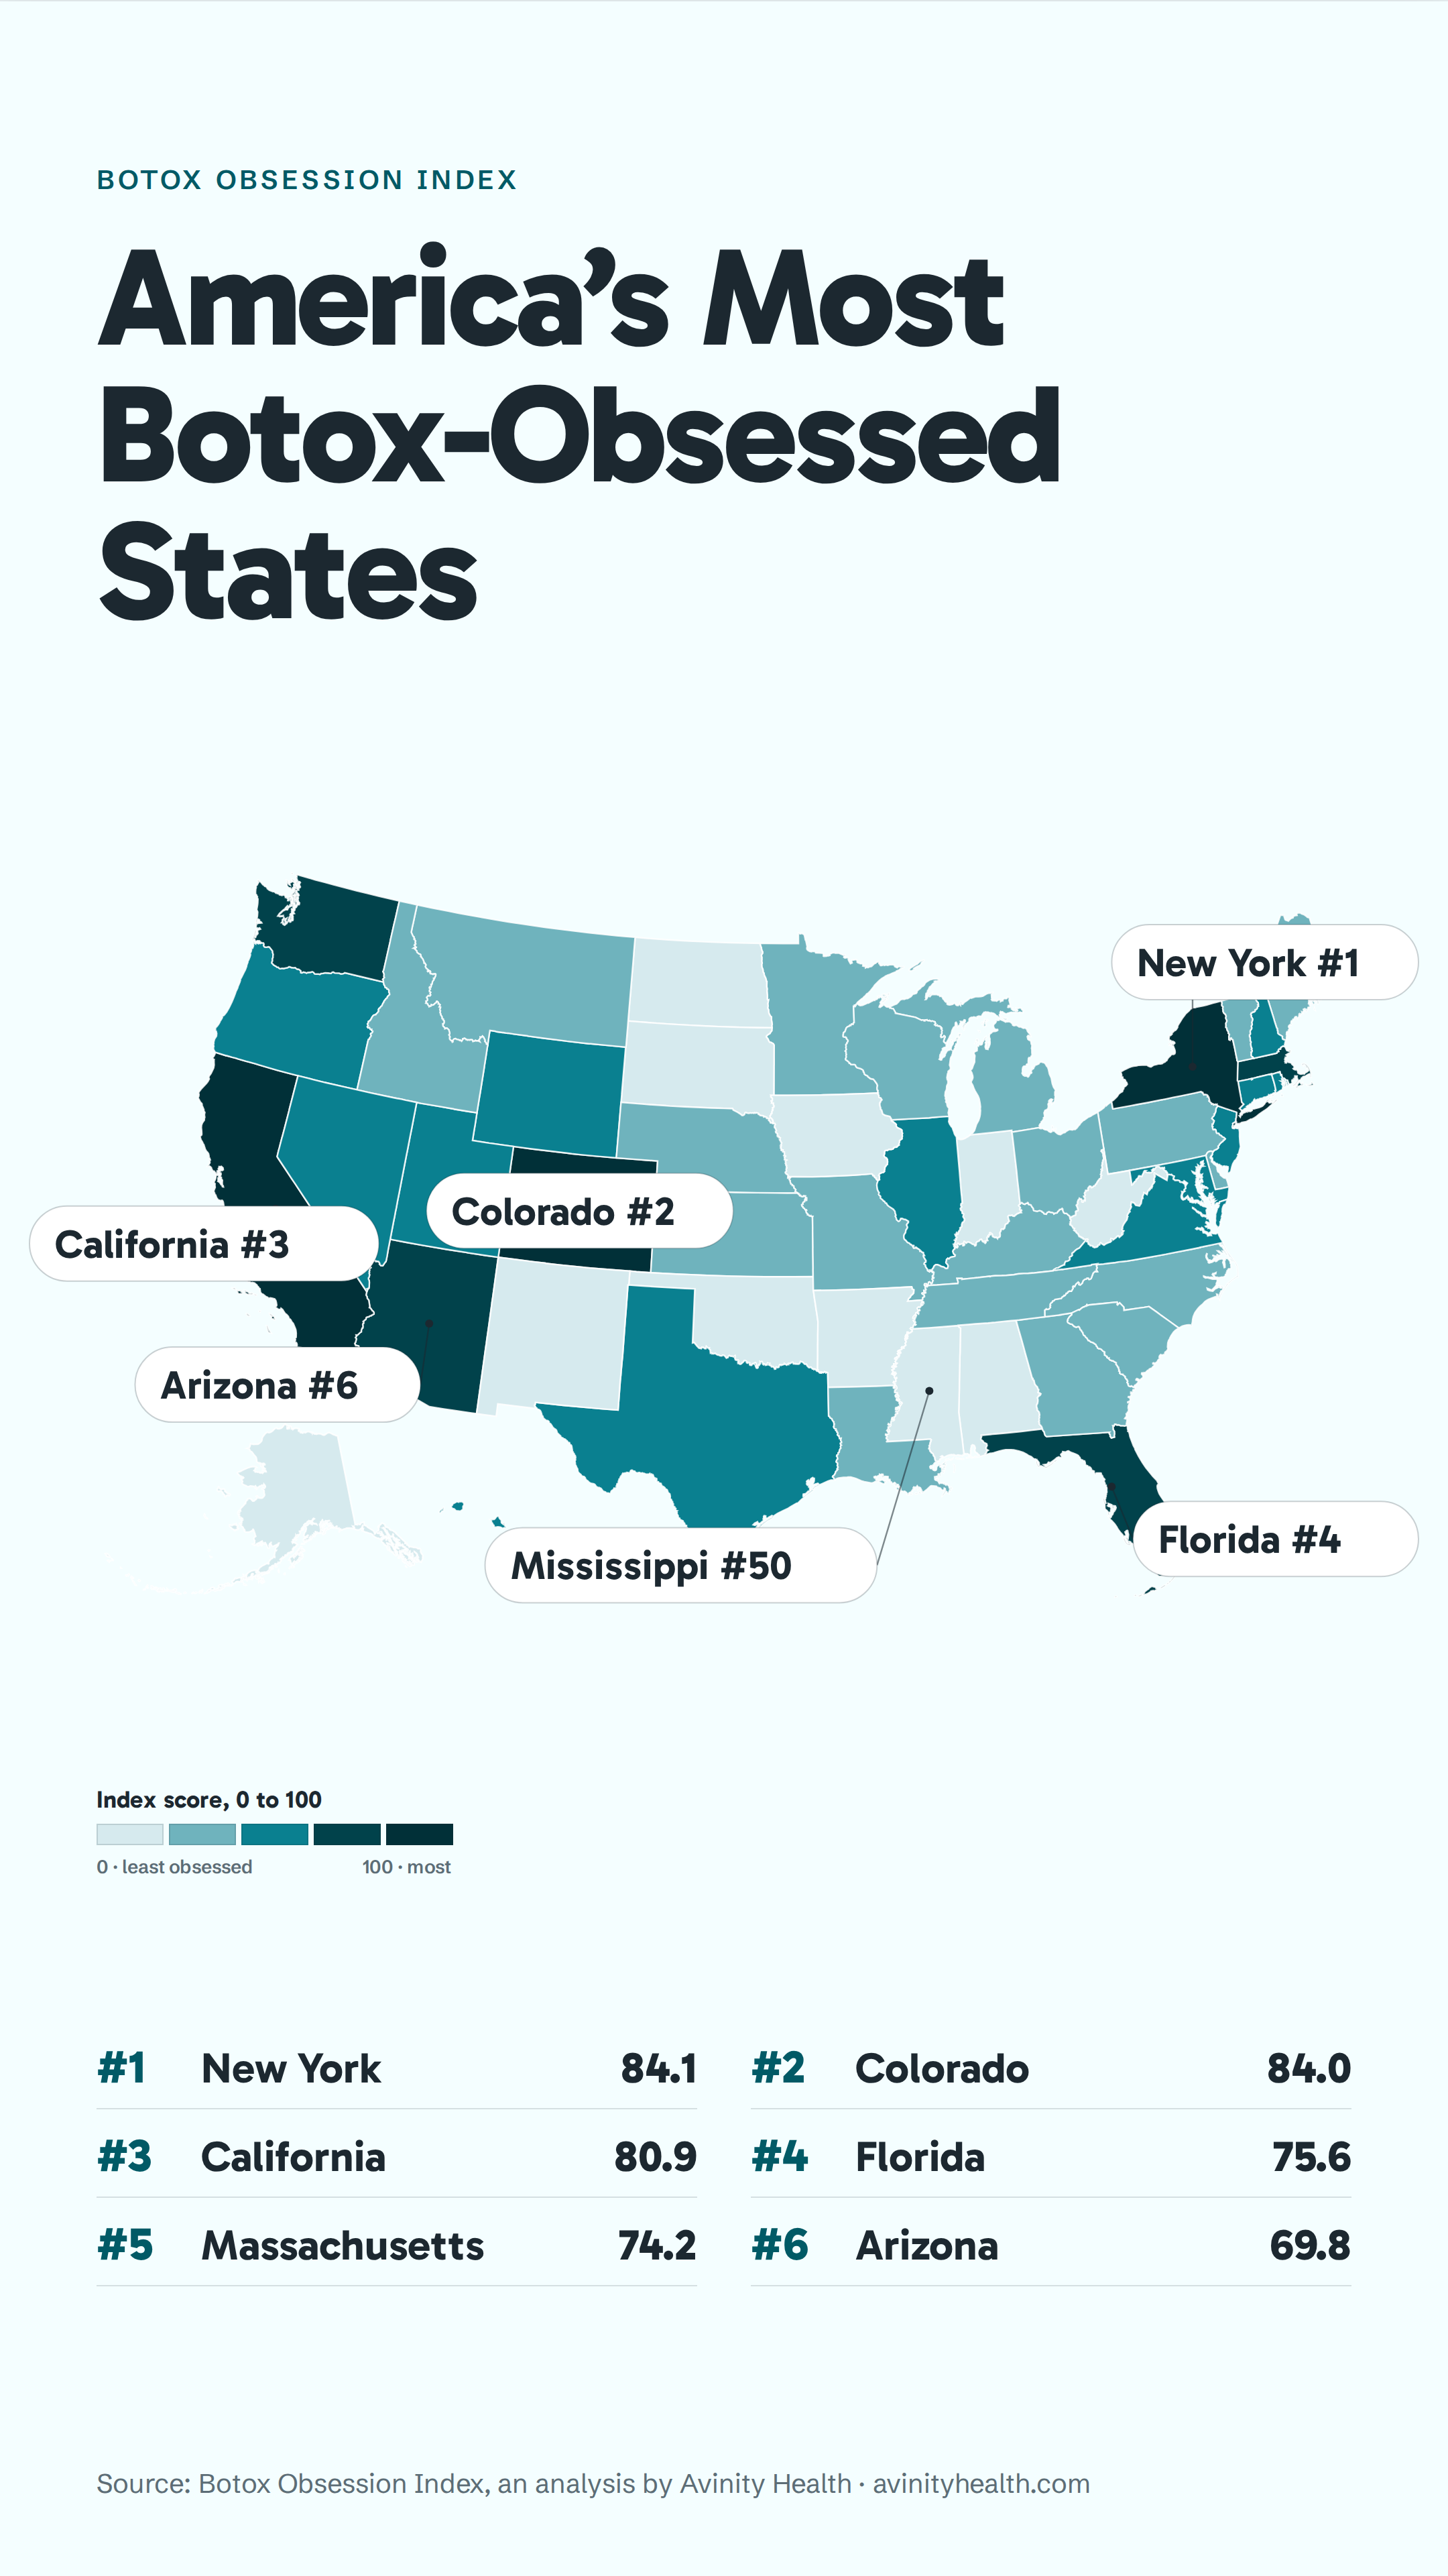
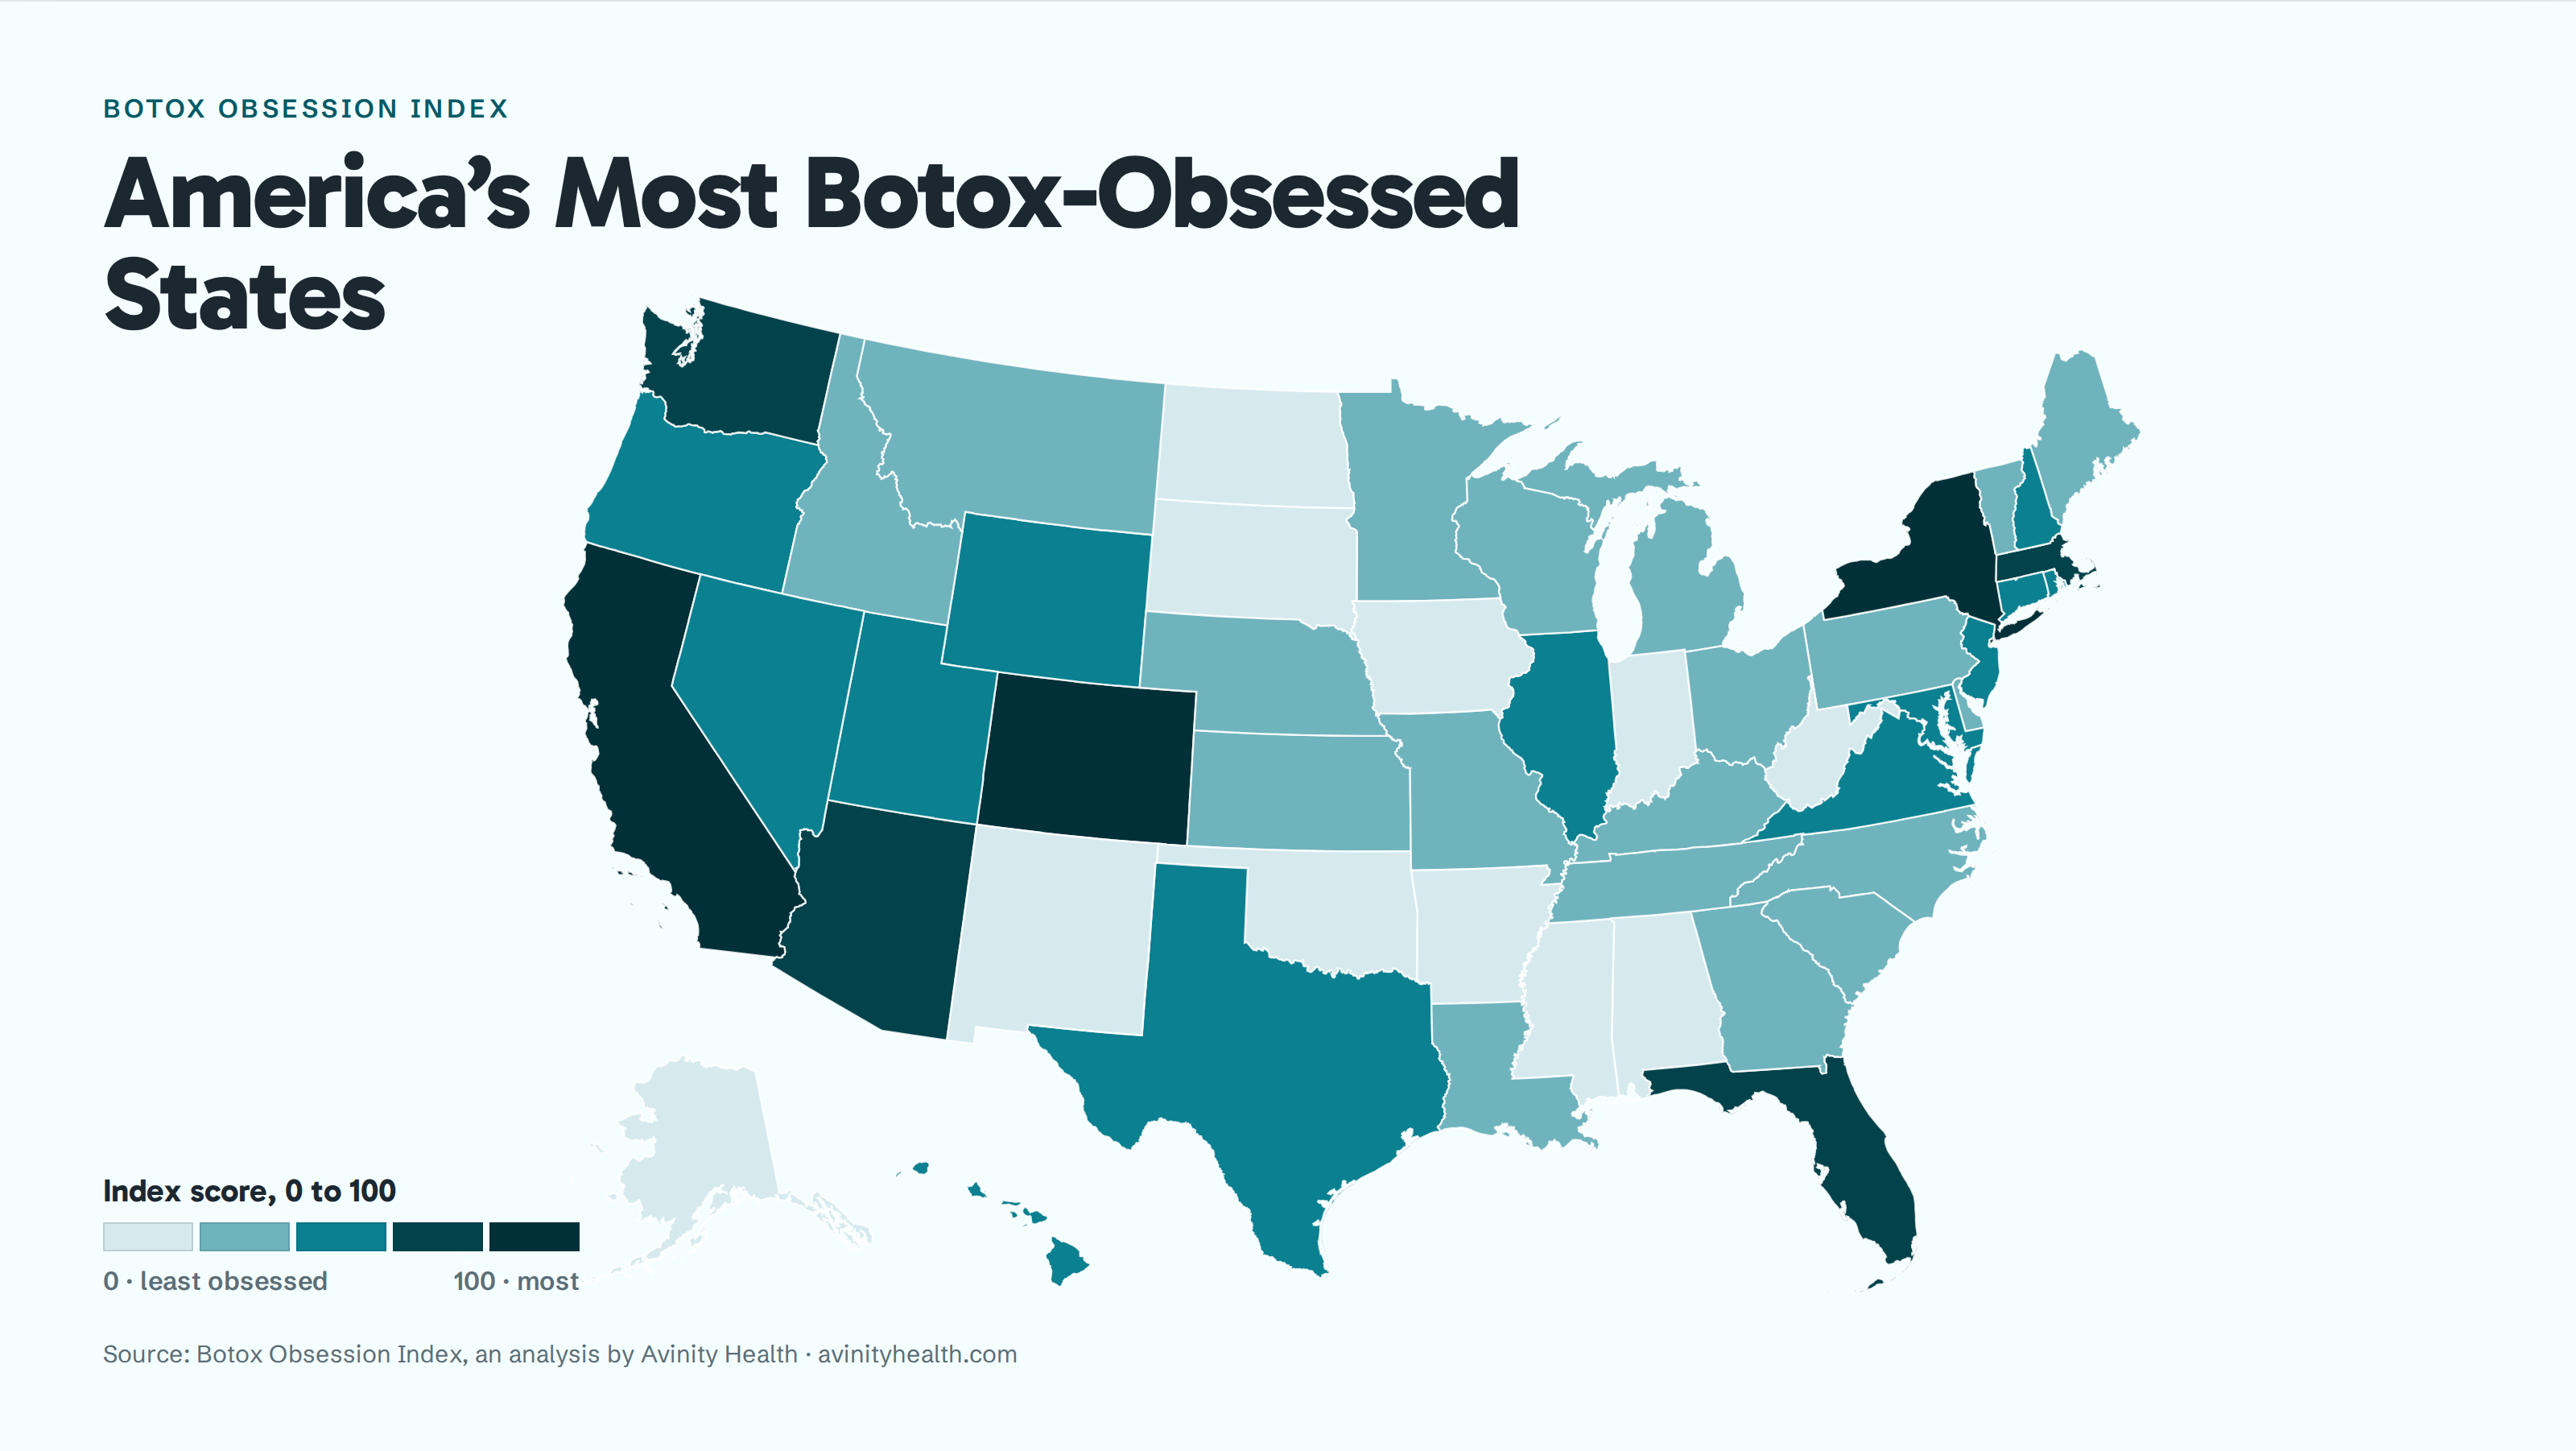
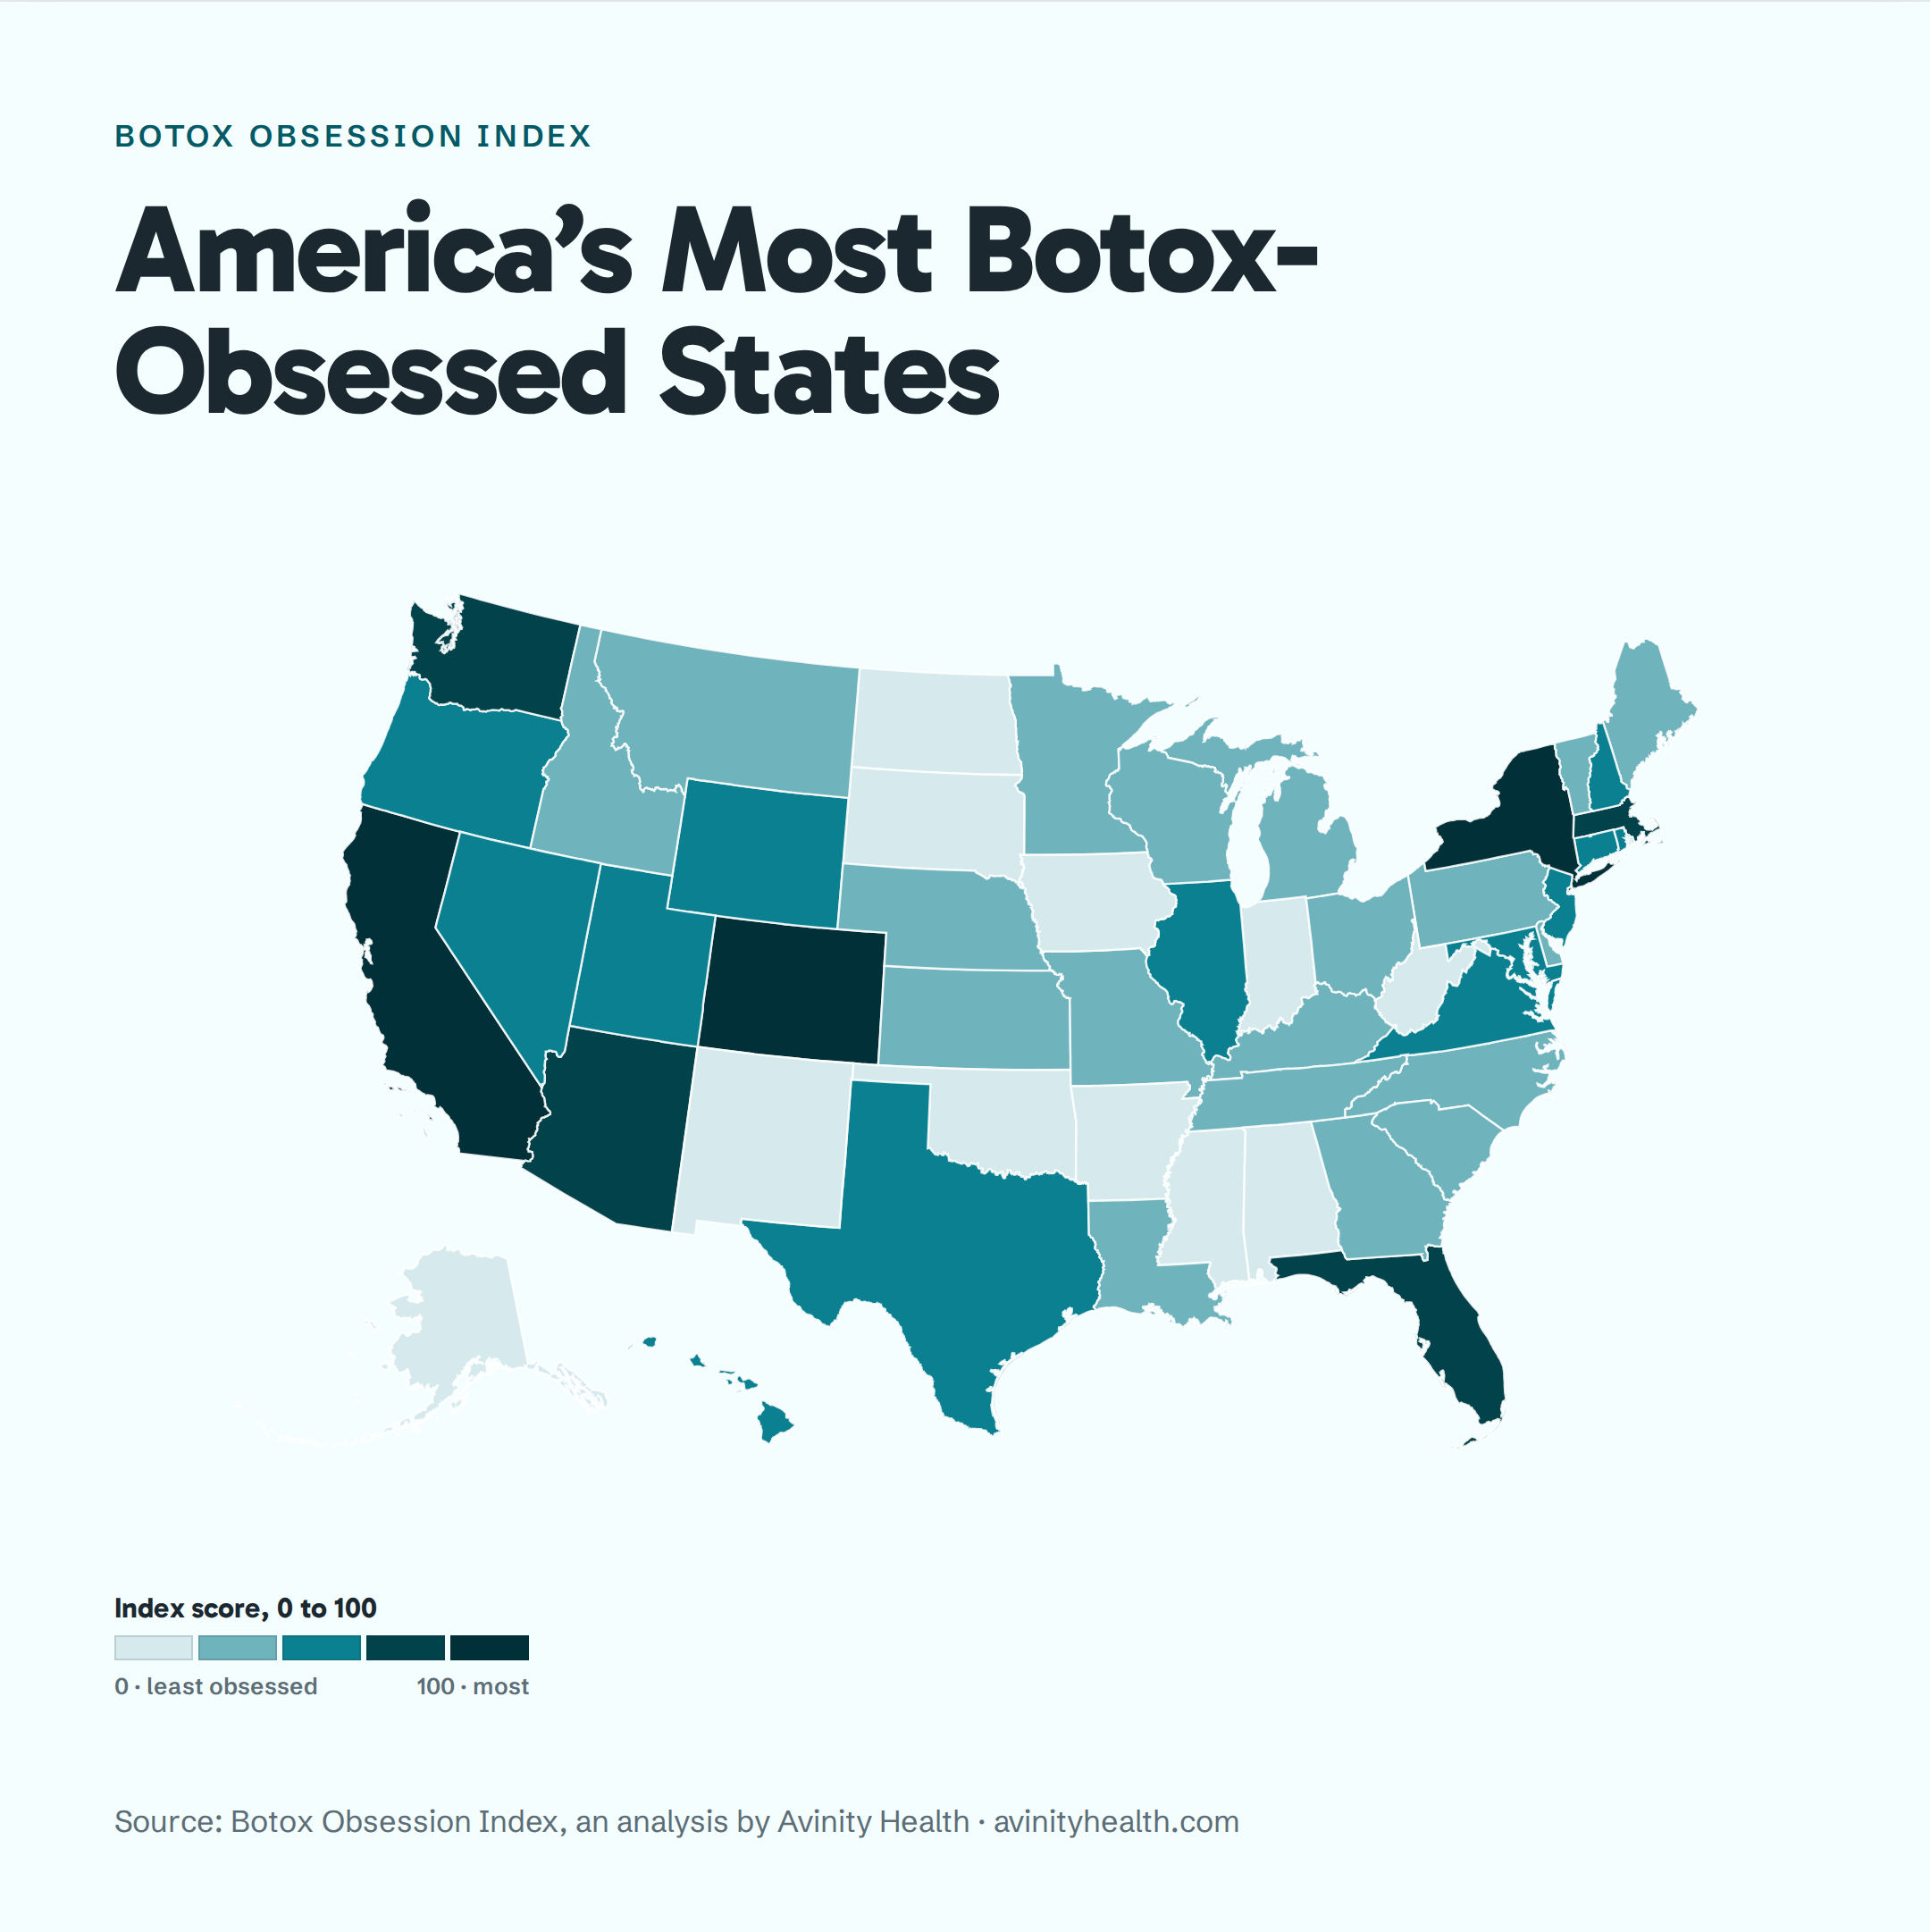
The Botox Obsession Index ranks all 50 states on per-capita Botox search activity, local provider and clinic density, and relative Google search interest. A 50-state analysis by Avinity Health. Everything on this page is free to use with attribution.
Read the full study, with the interactive map, the complete 50-state ranking and the methodology.
·
Download the full media kitOne ZIP, about 7 MB: the dataset, the national map in both color schemes including editable SVG, the Top 10 and Bottom 10, the demand versus supply graphic, the headshot, and a methodology and fact sheetPrefer to take files one at a time? Everything in the kit is also linked individually further down, along with a card for each of the 50 states and the live embeddable map.
One more finding: "masseter botox" (jaw Botox) generates an estimated 74,020 searches a month, making it the #2 Botox-related search term measured, behind only "botox" itself.
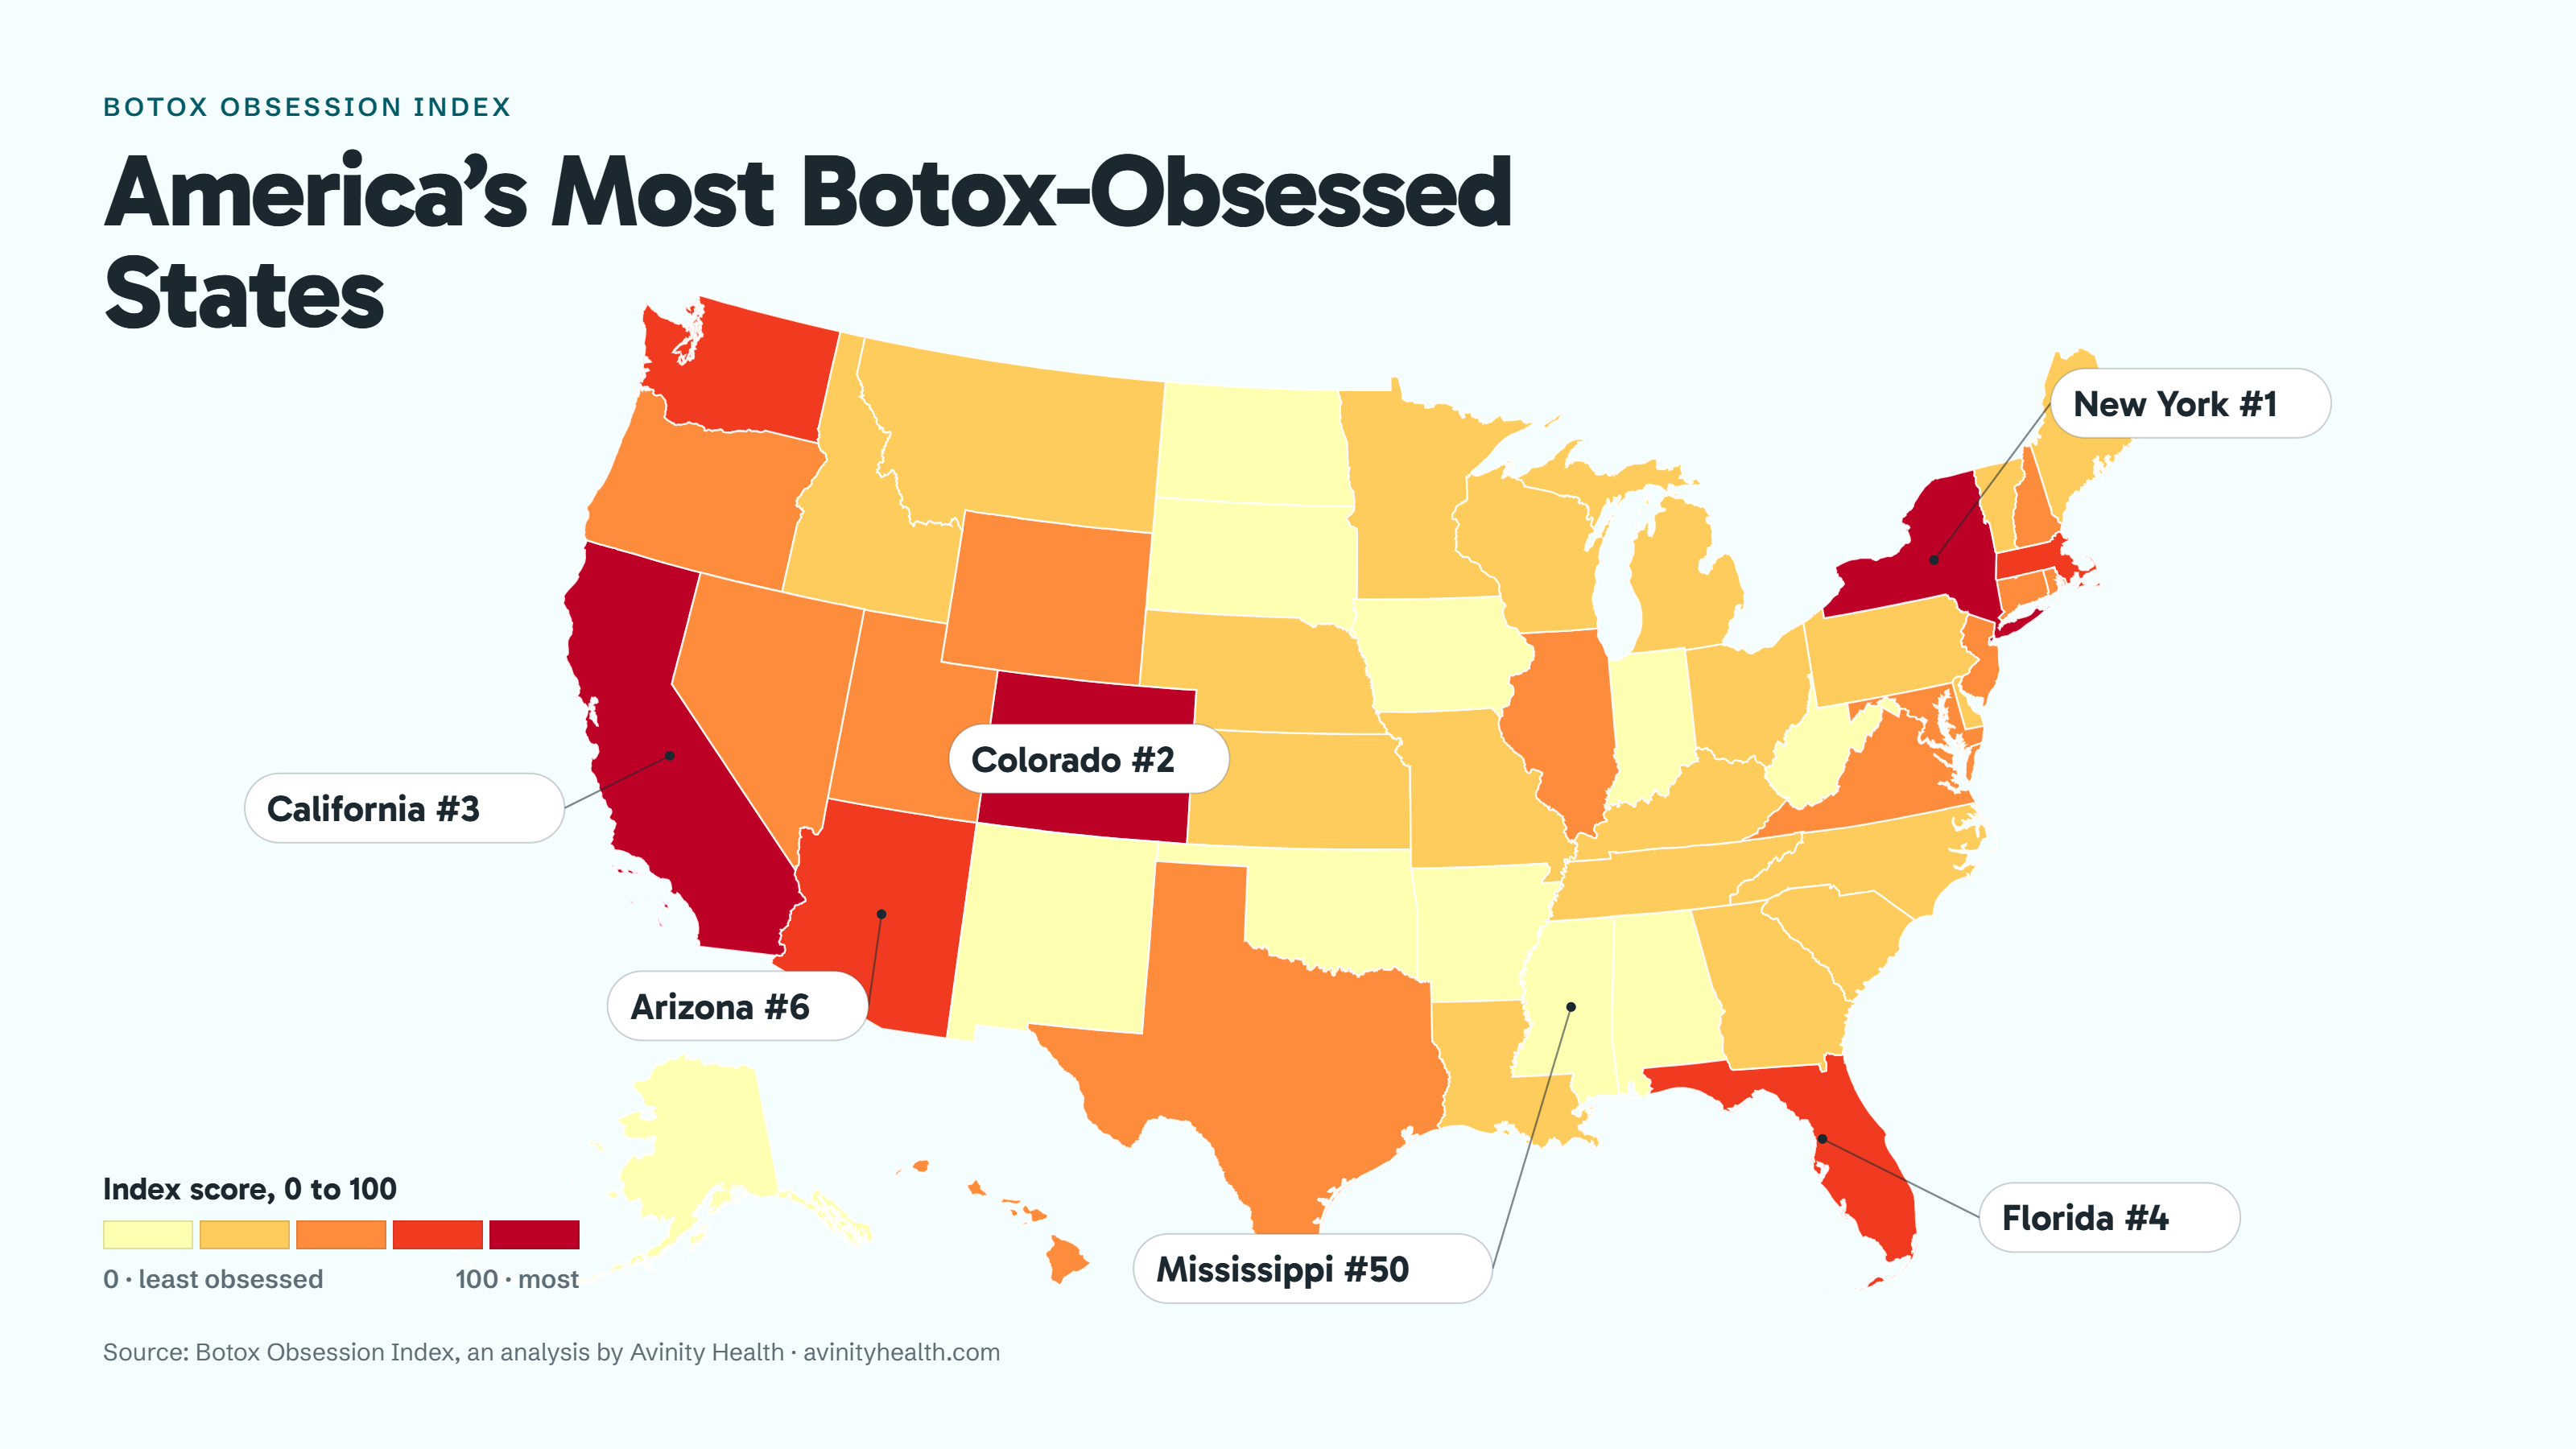
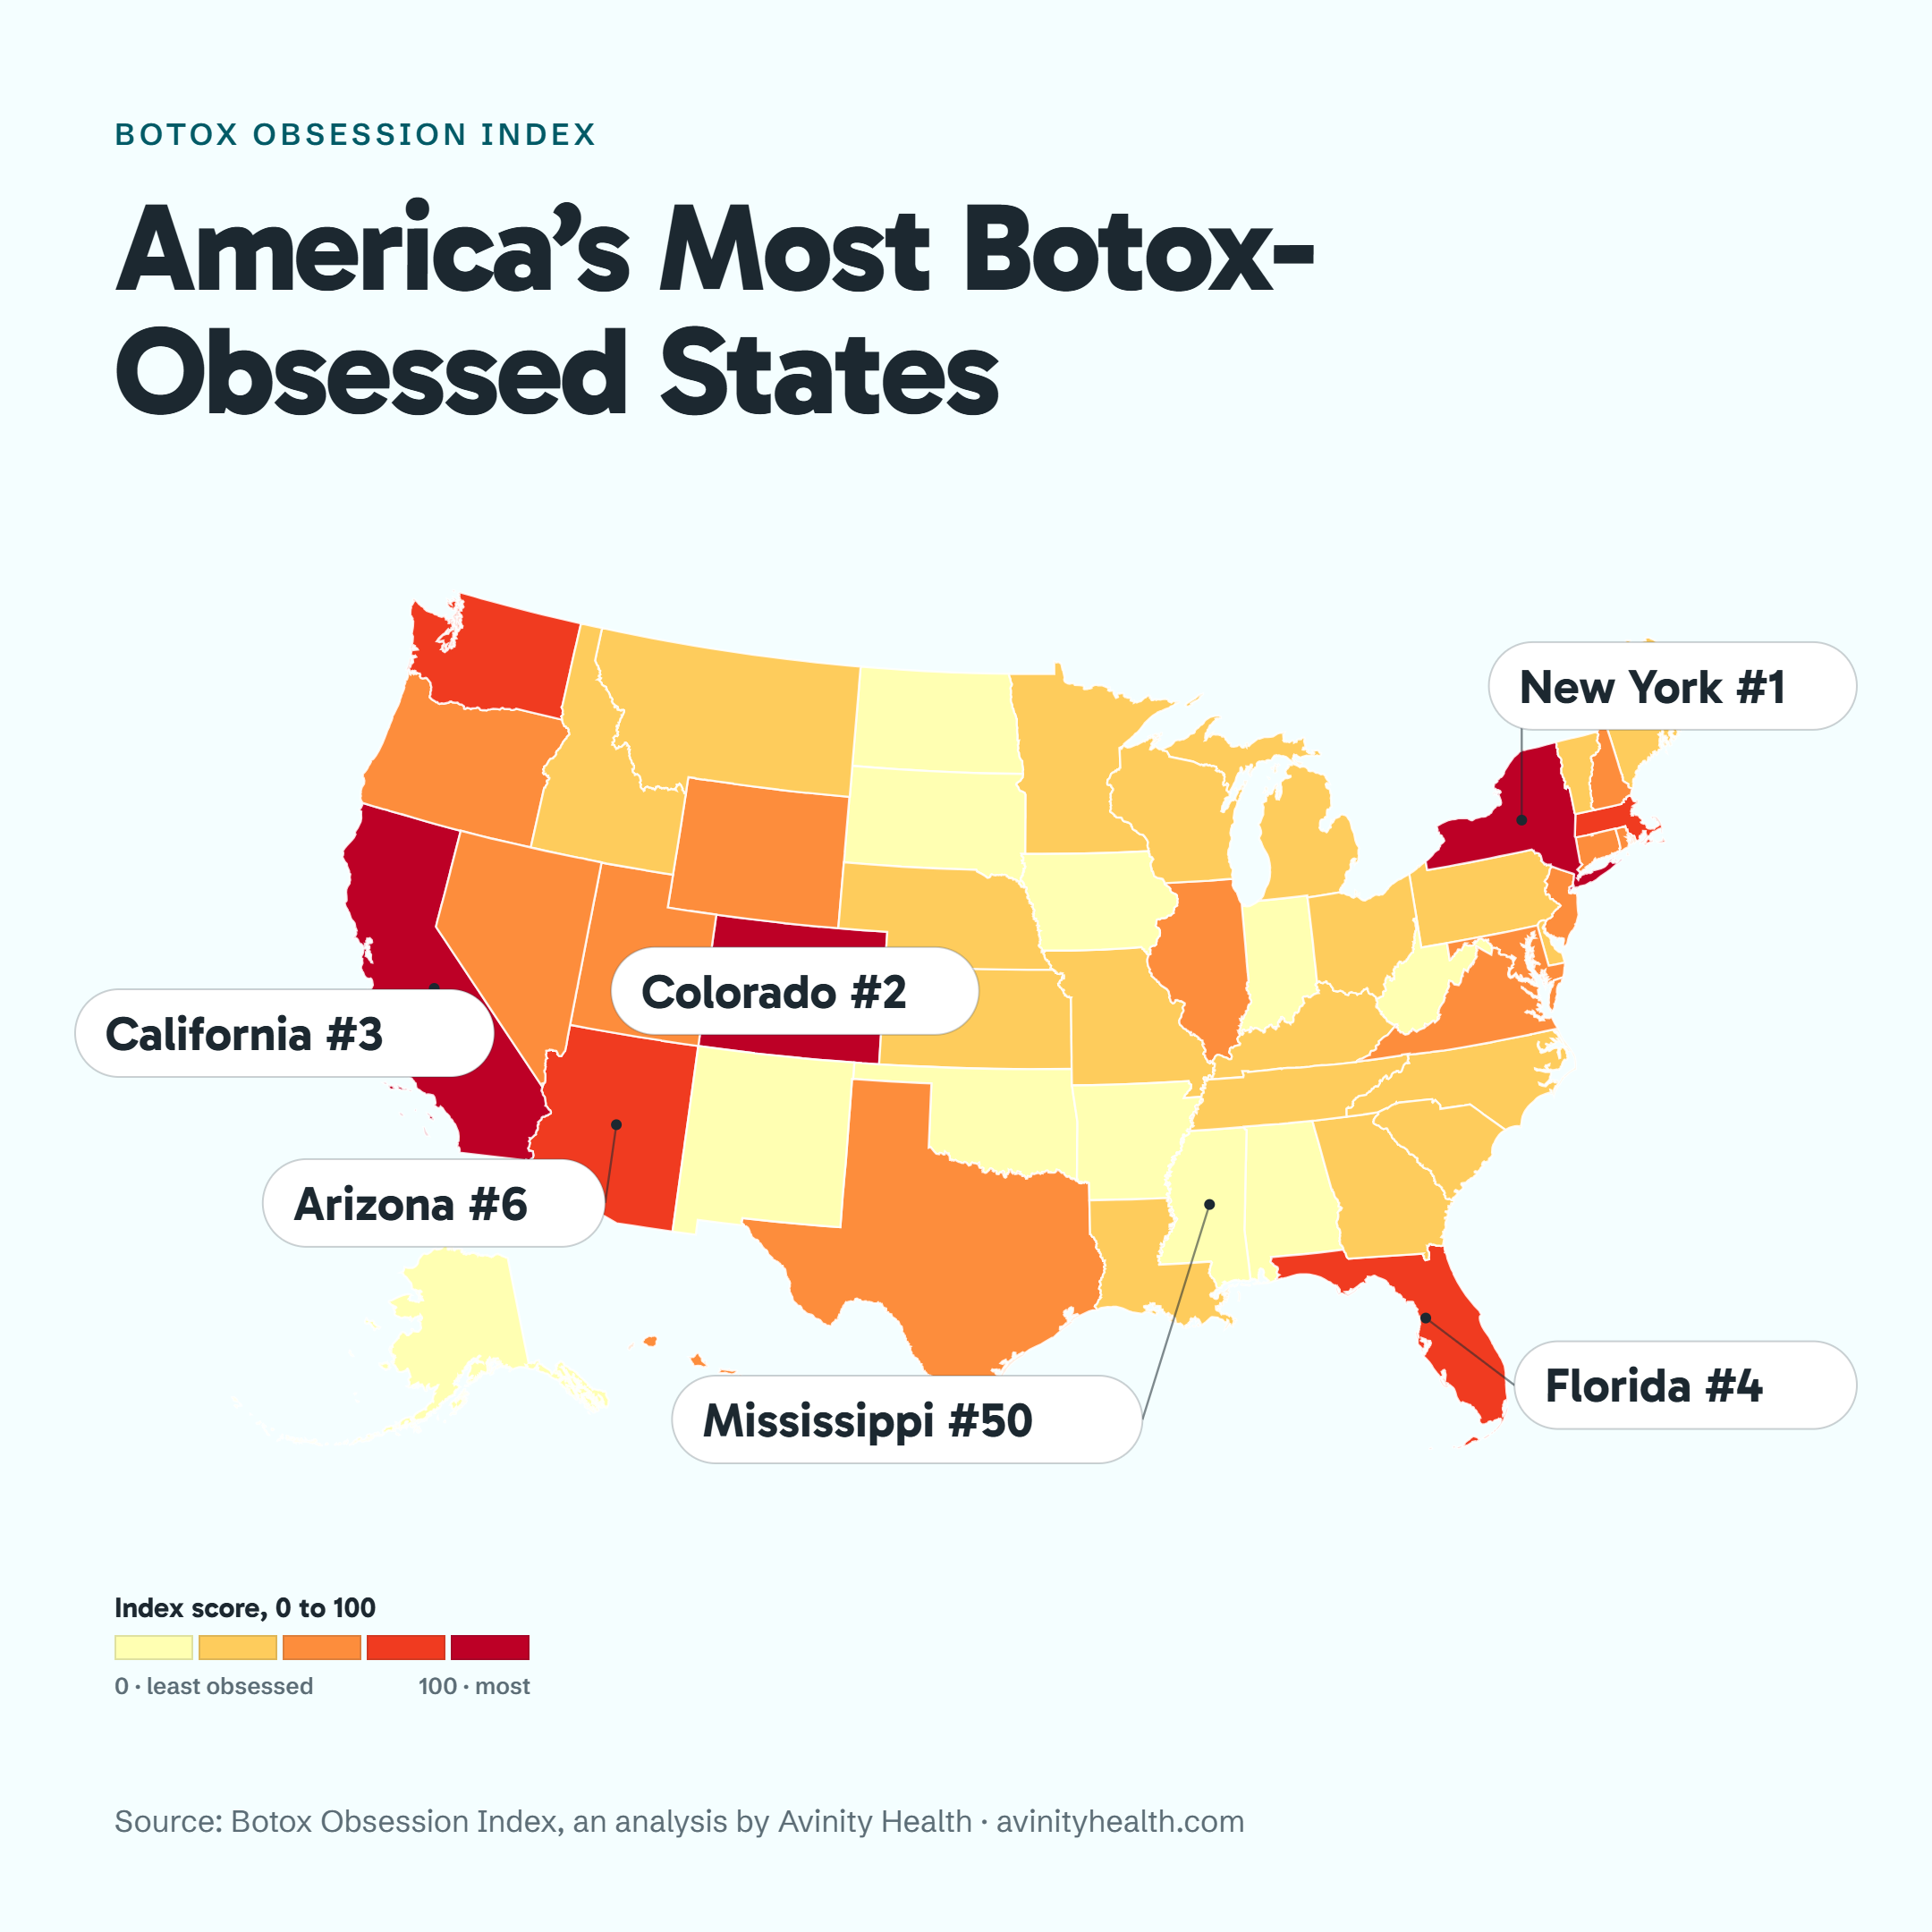
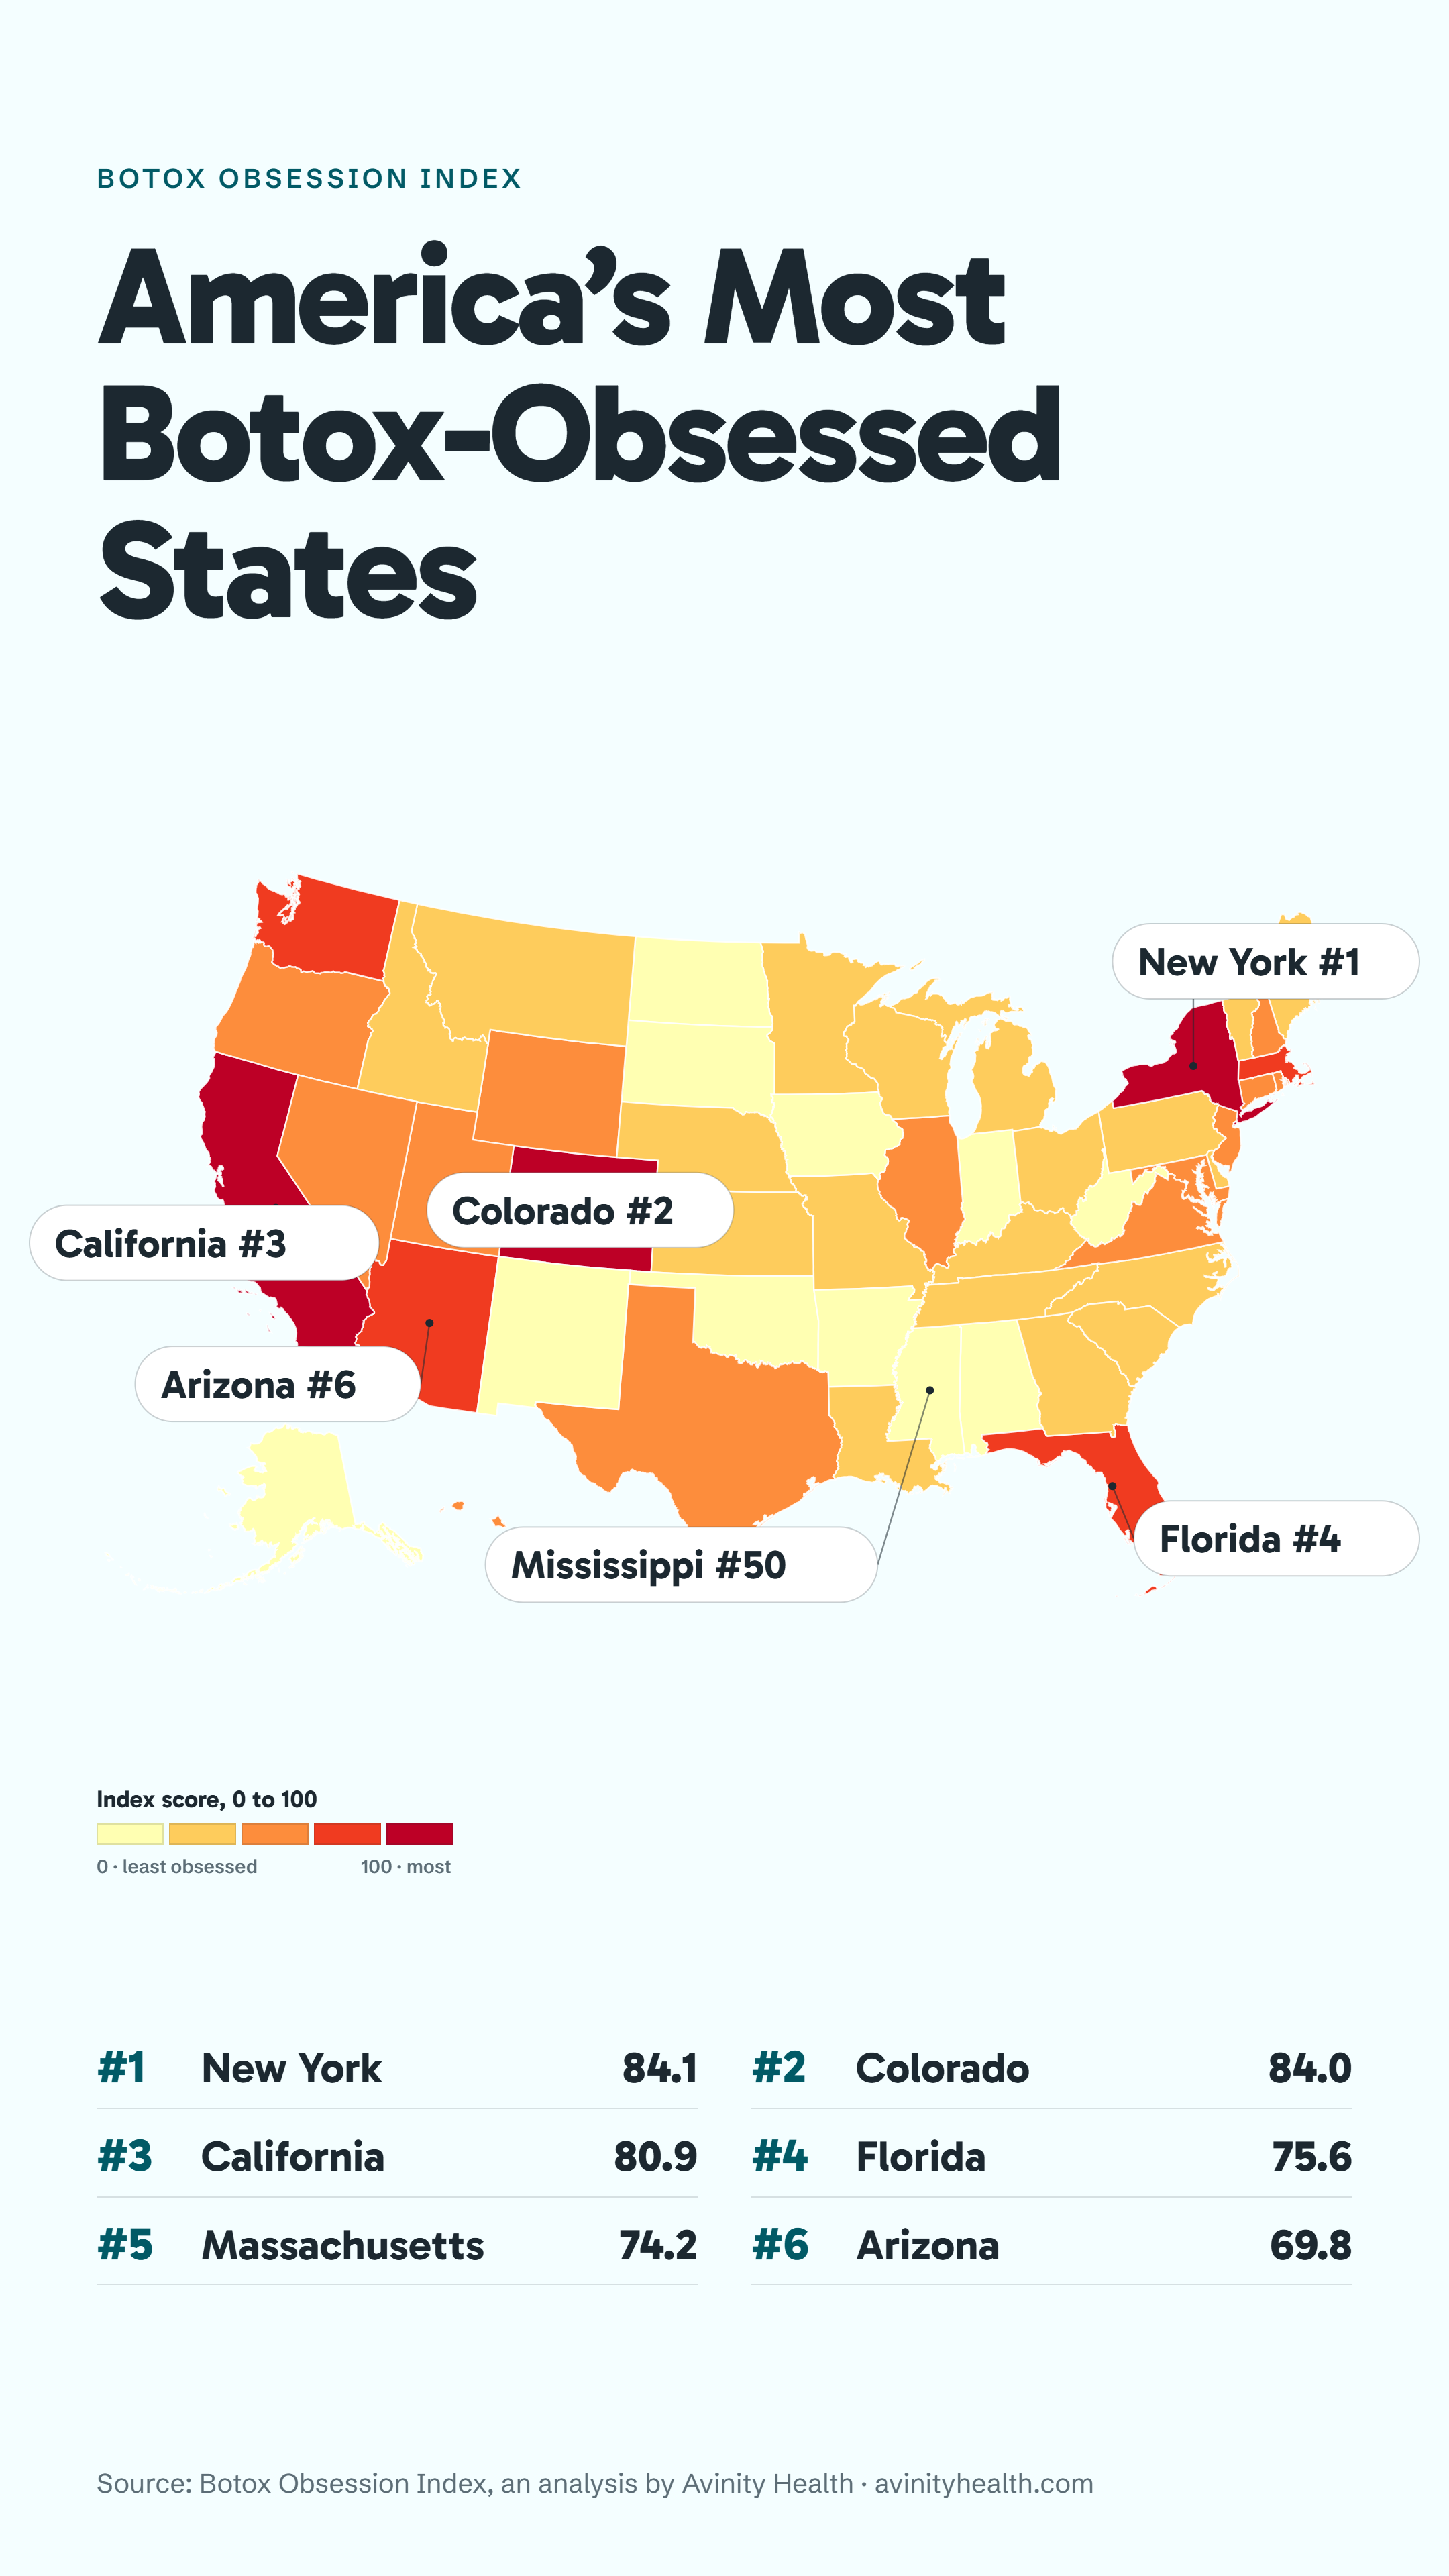
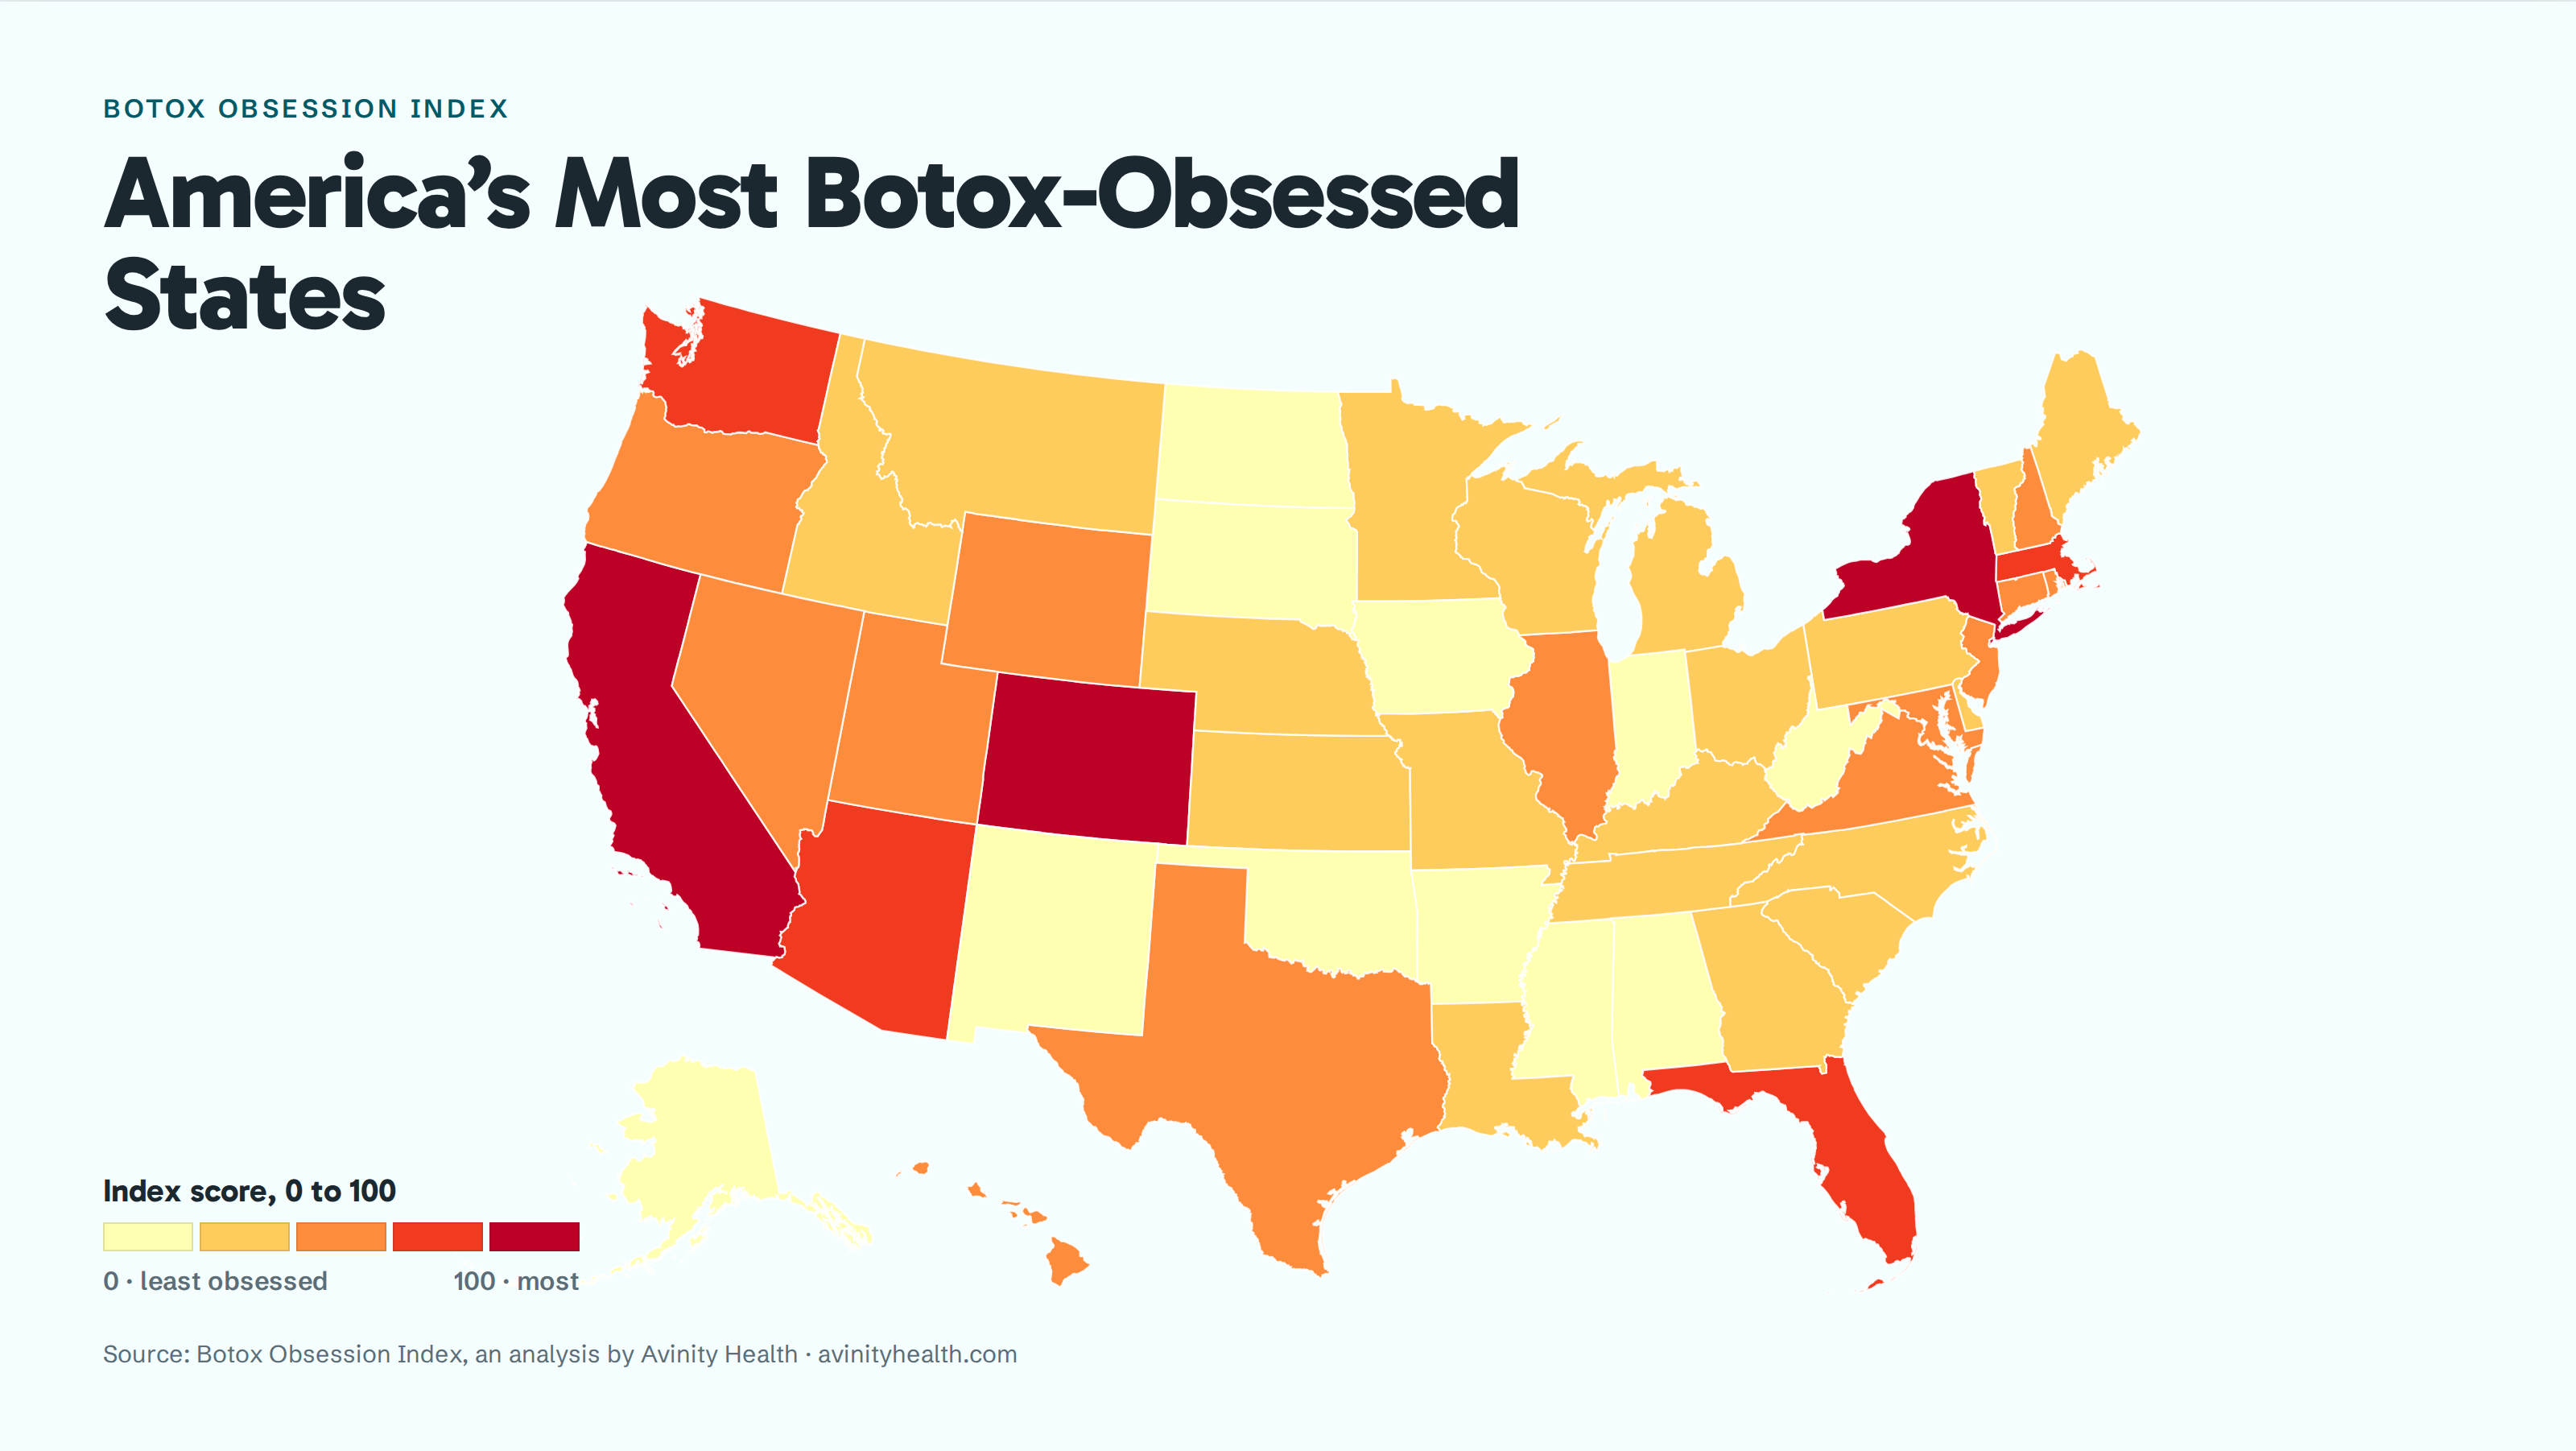
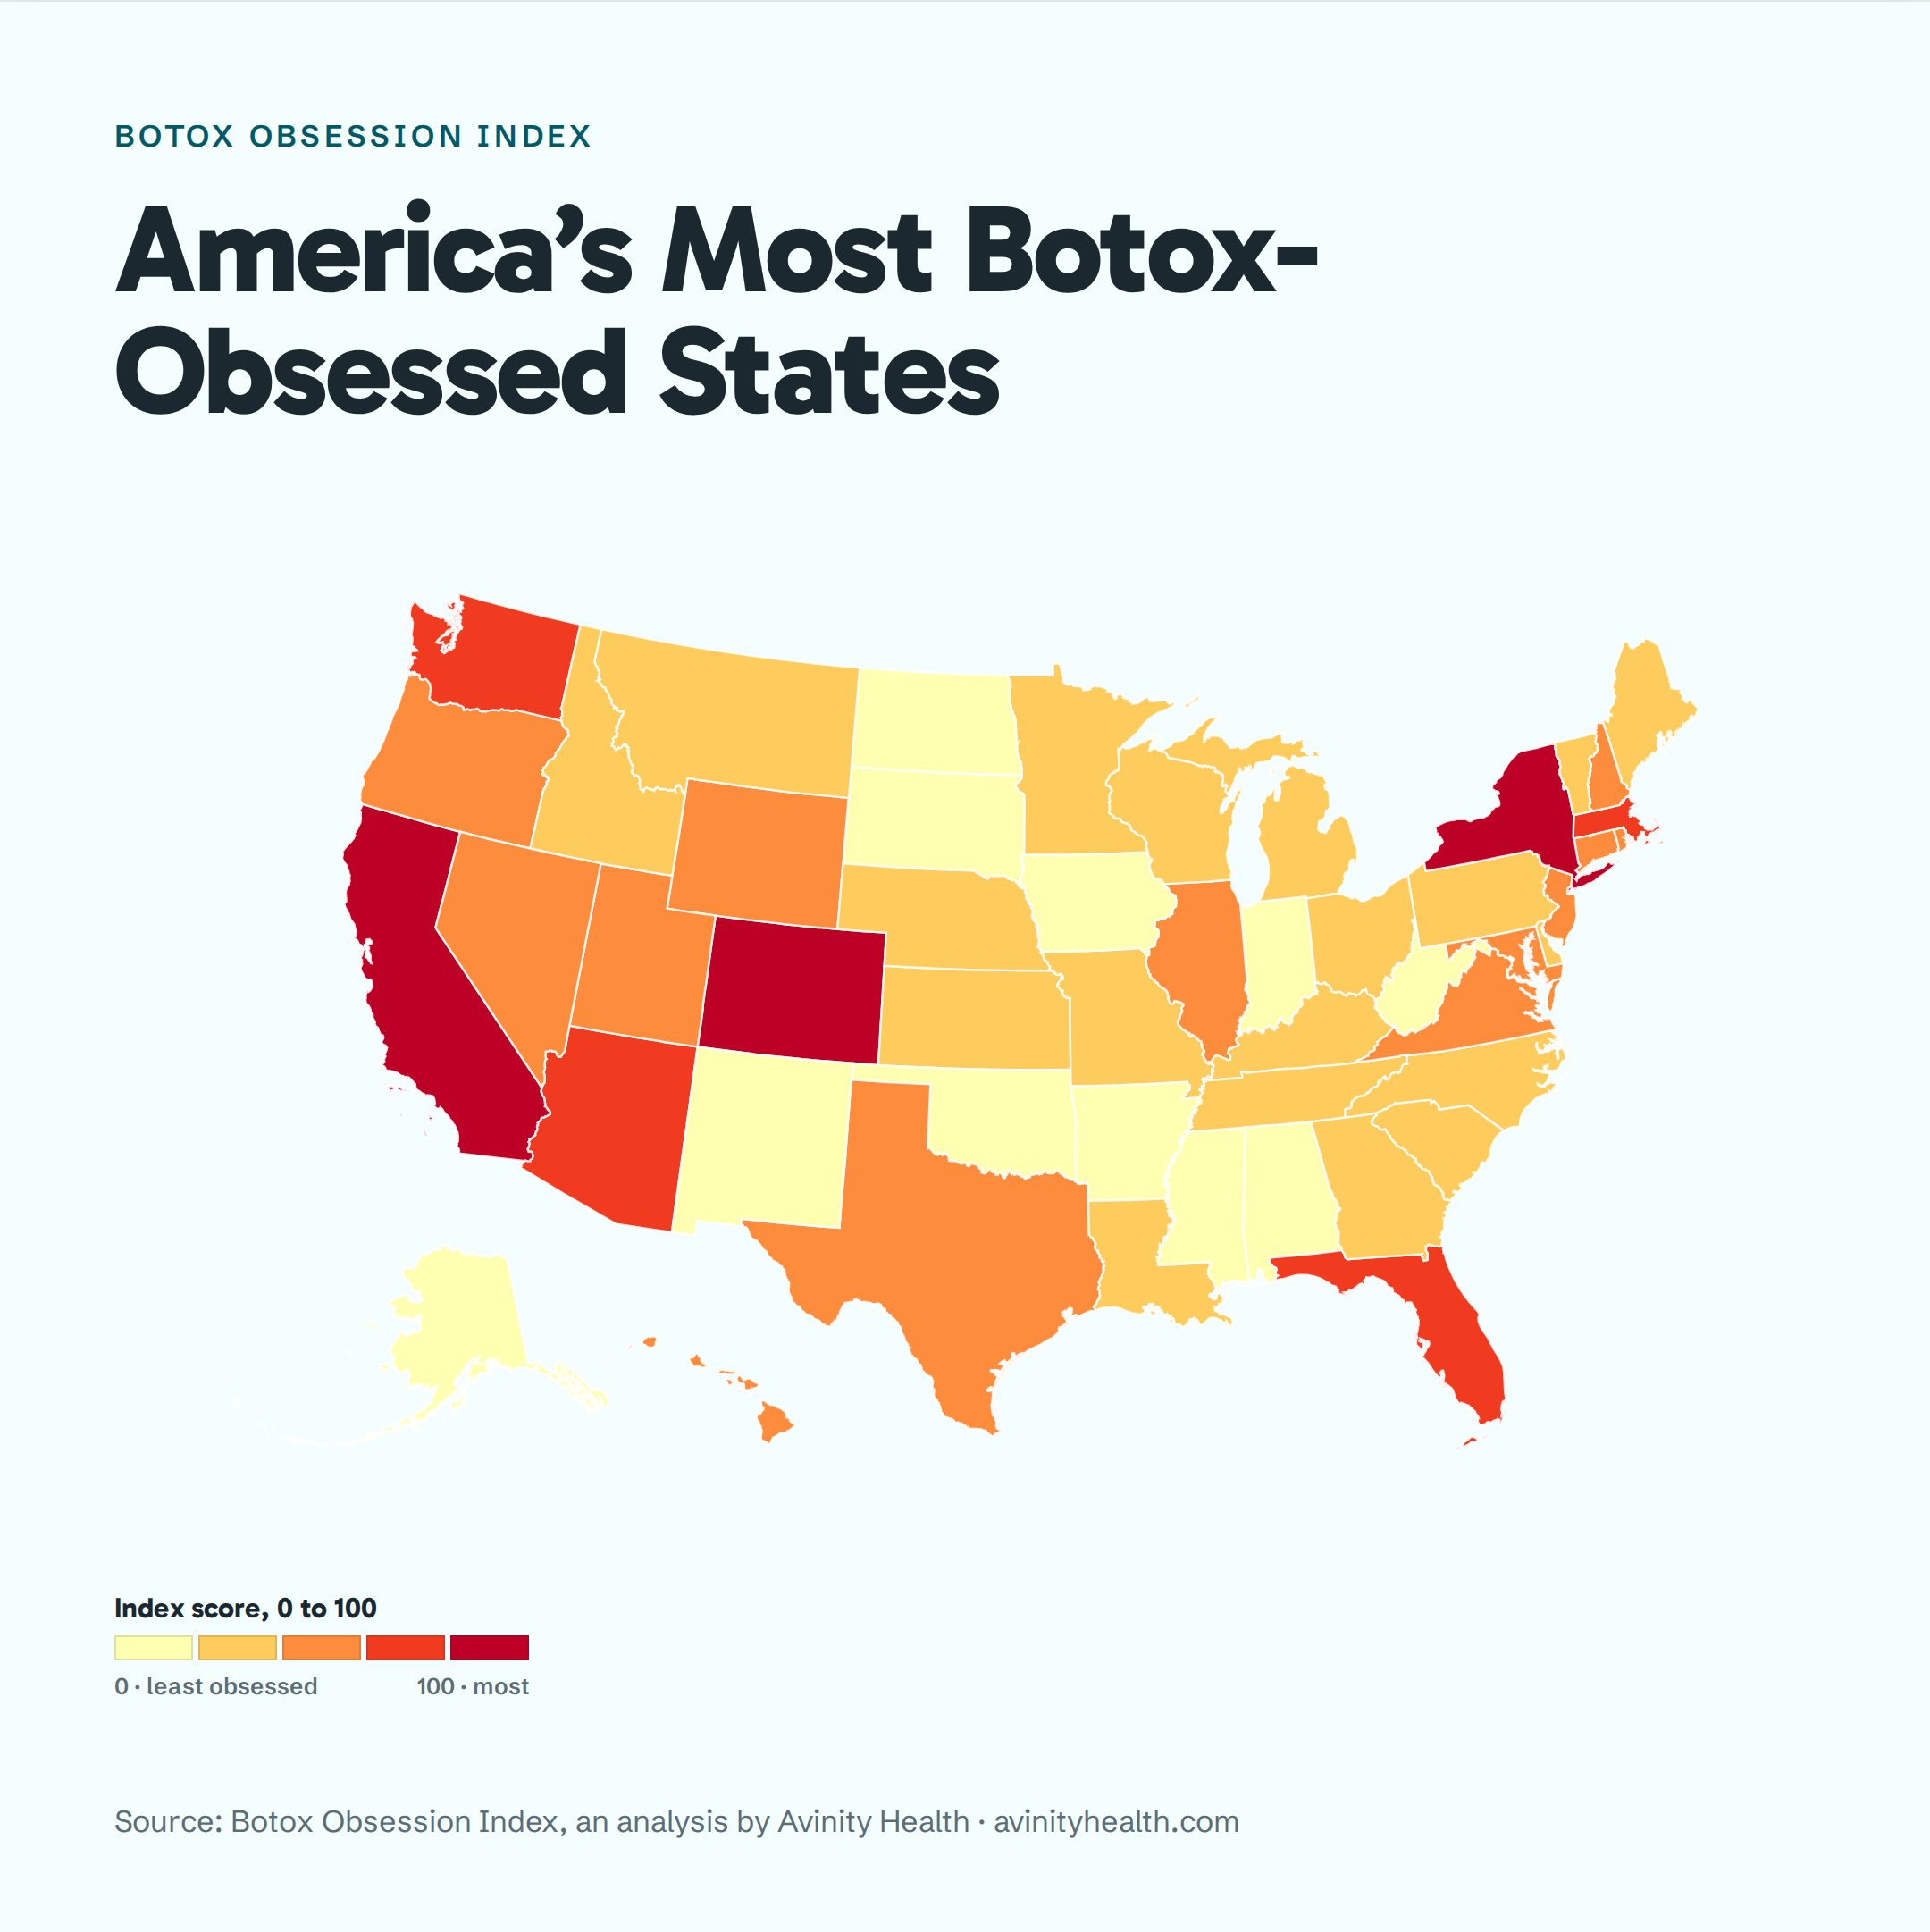
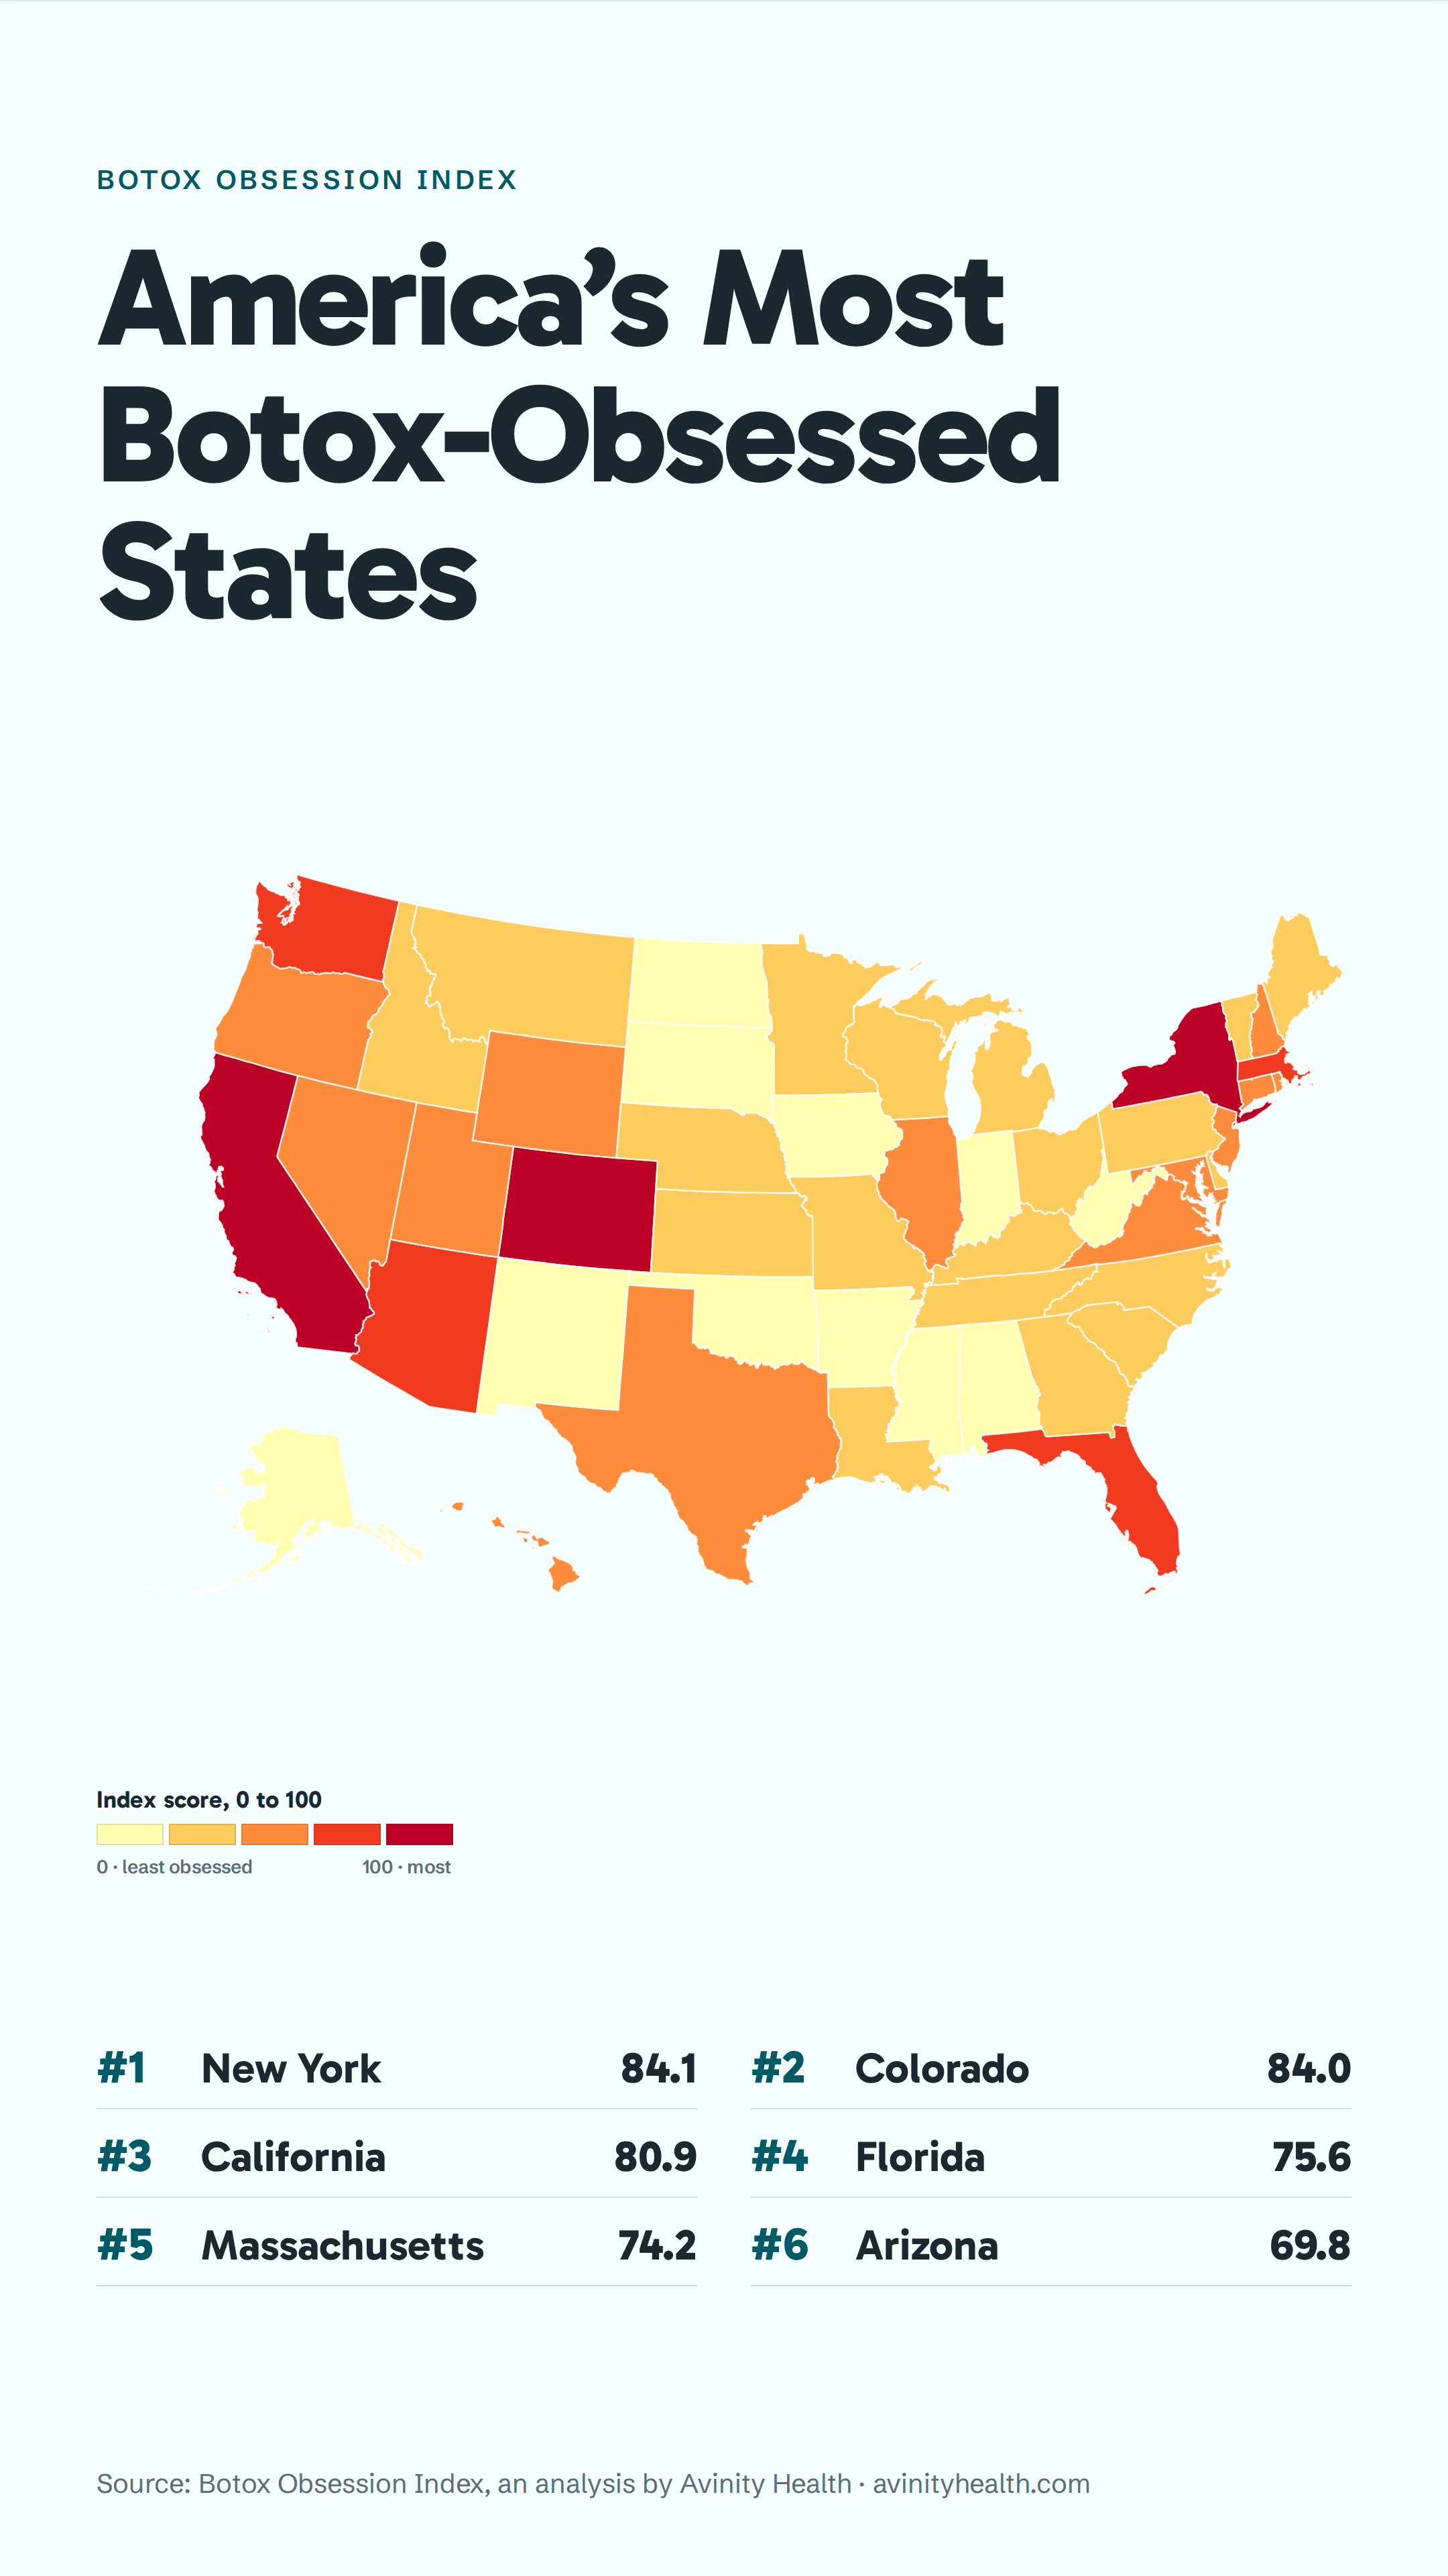
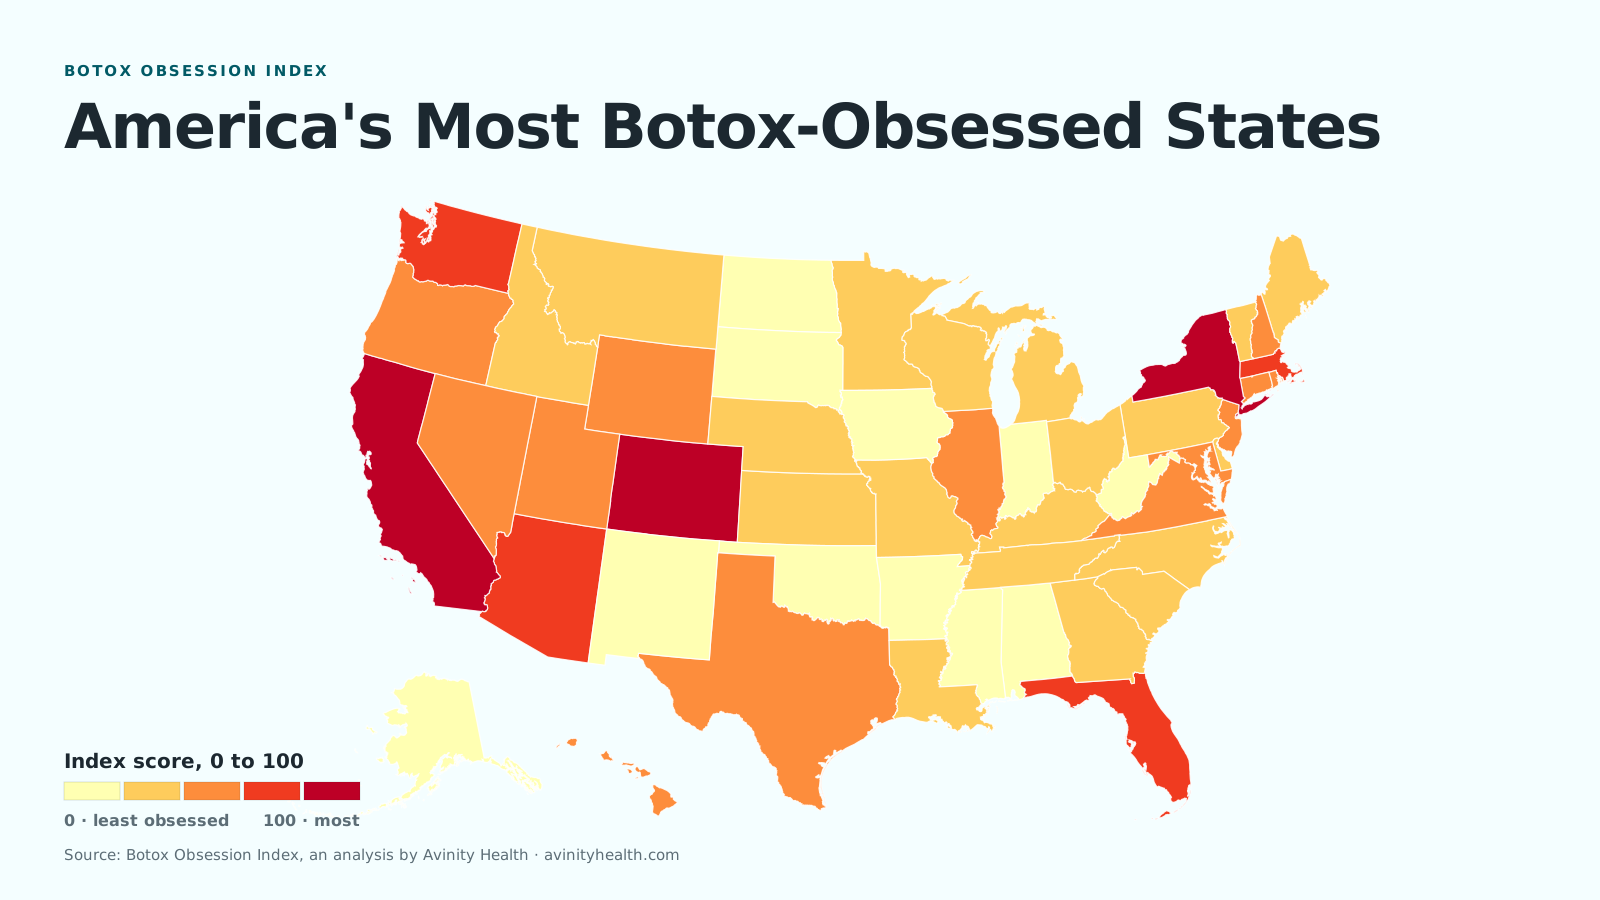
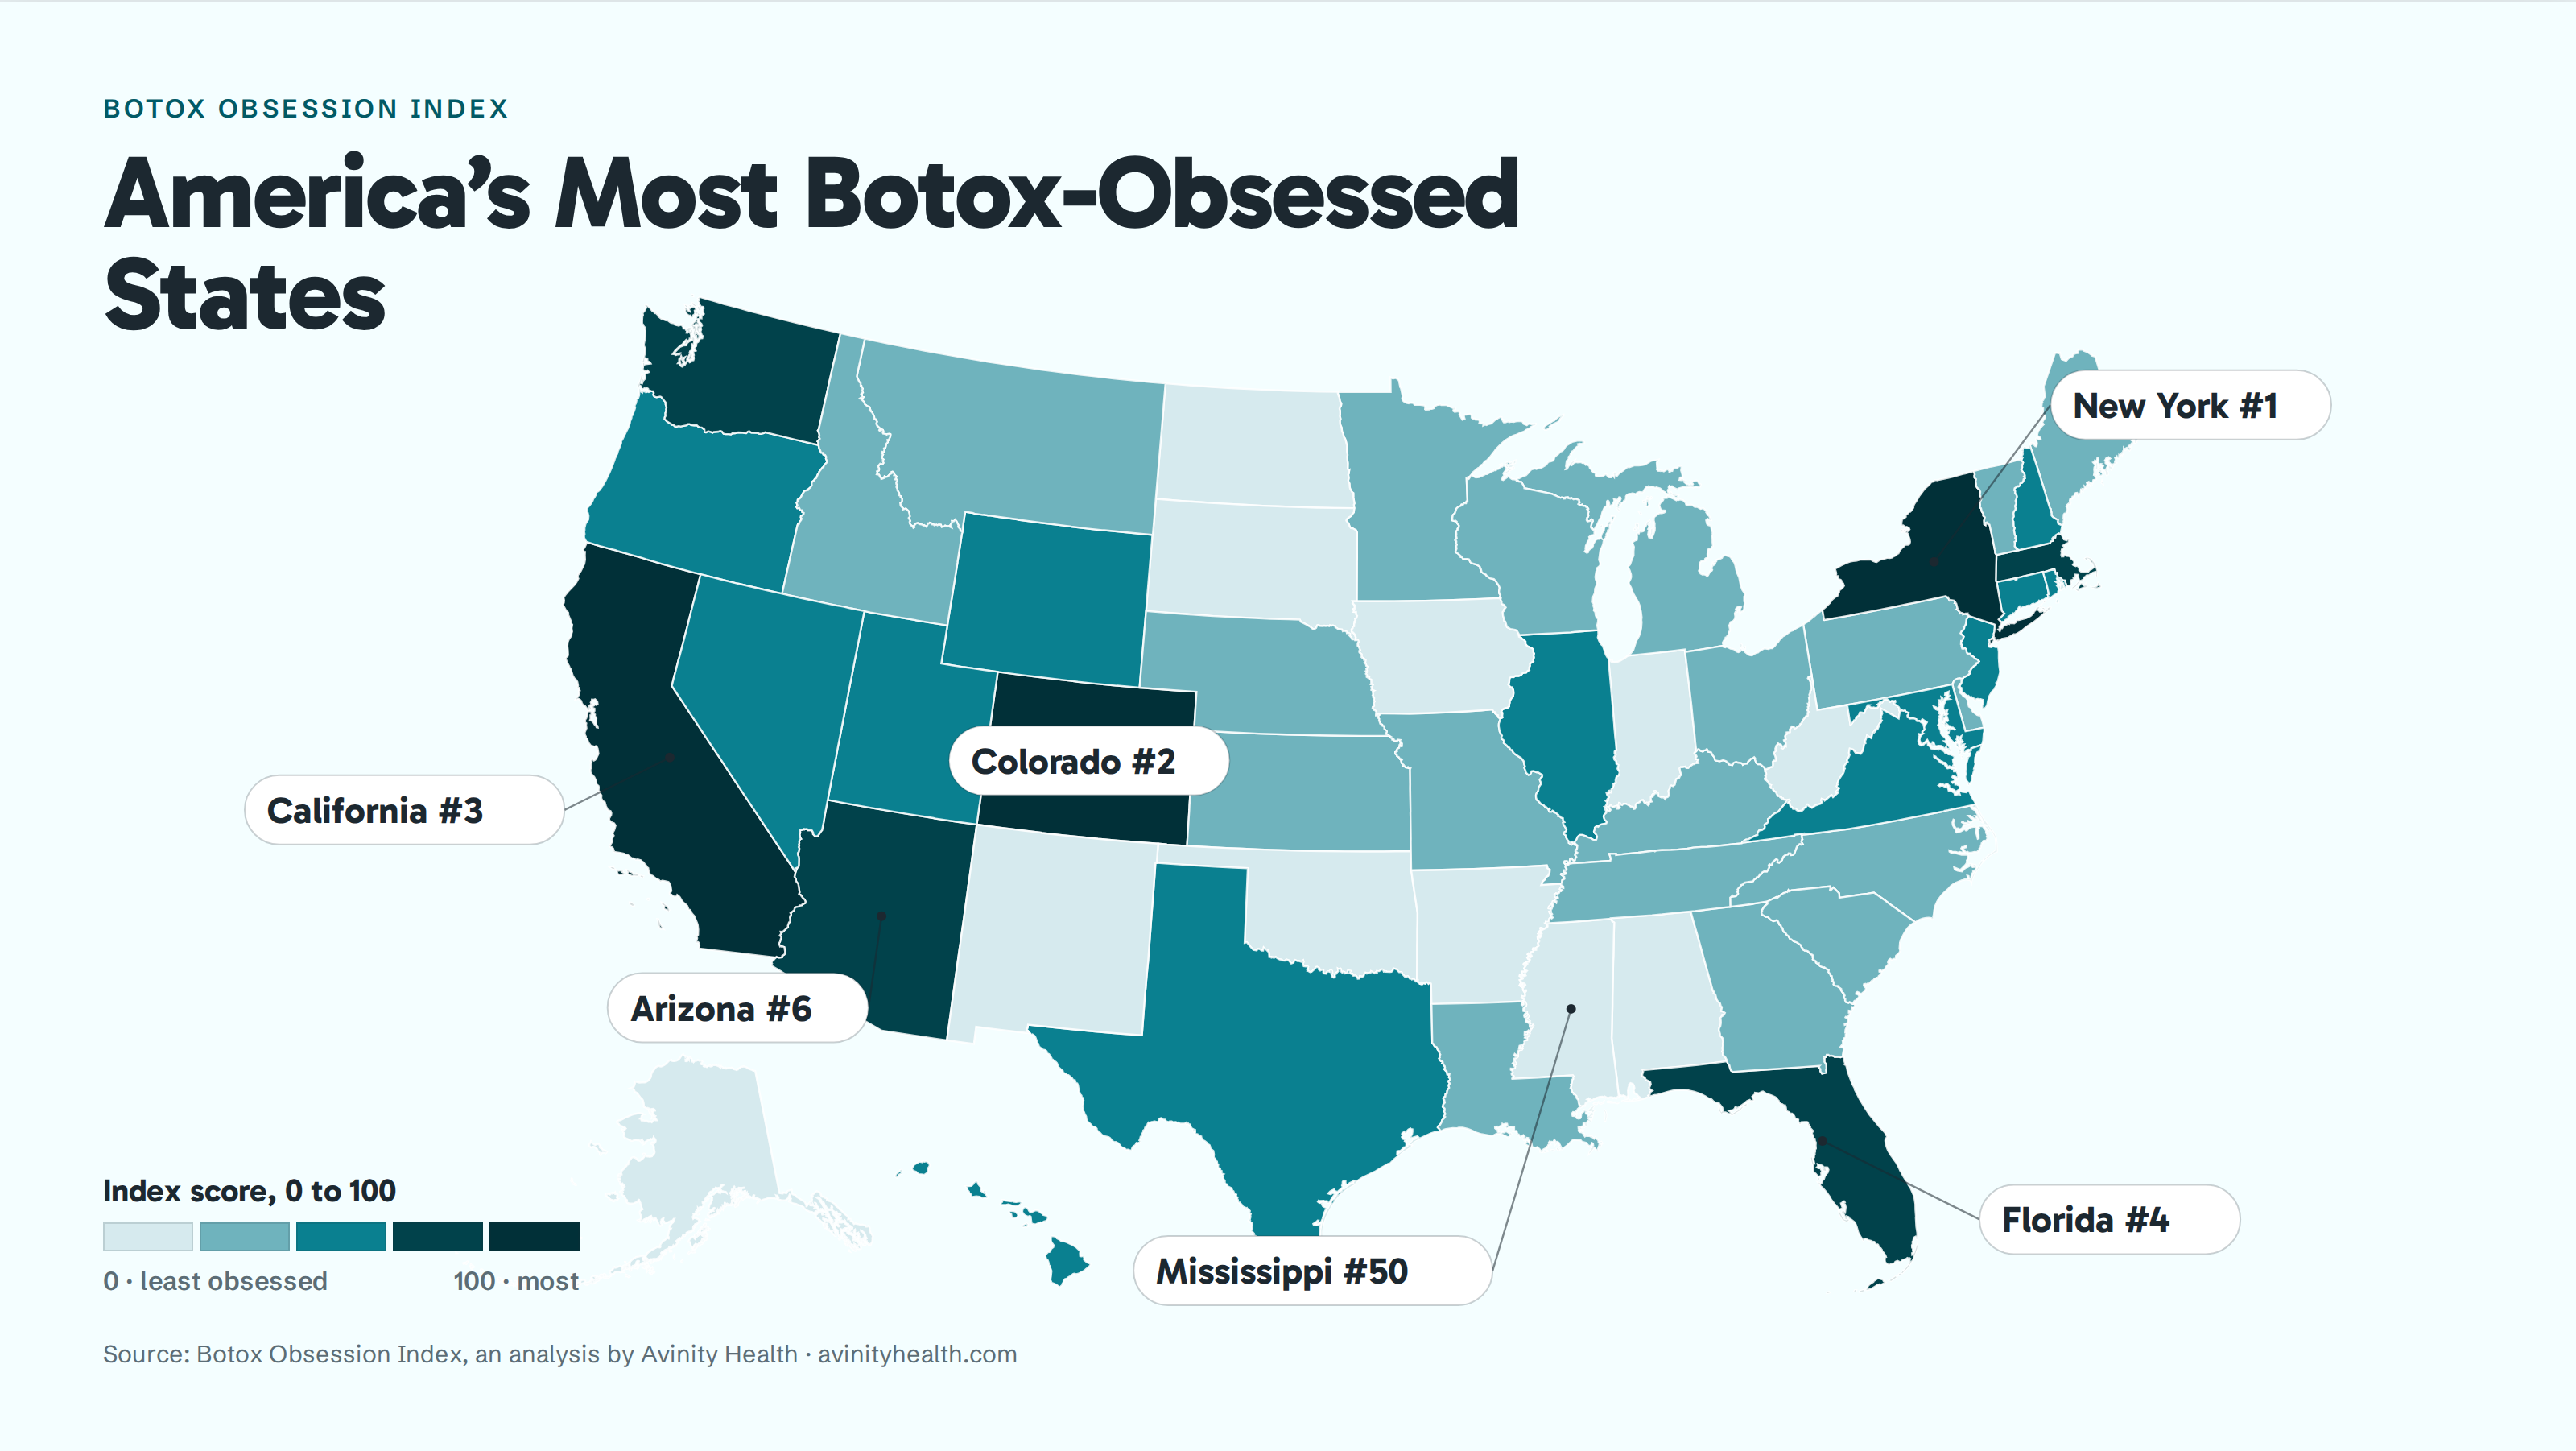
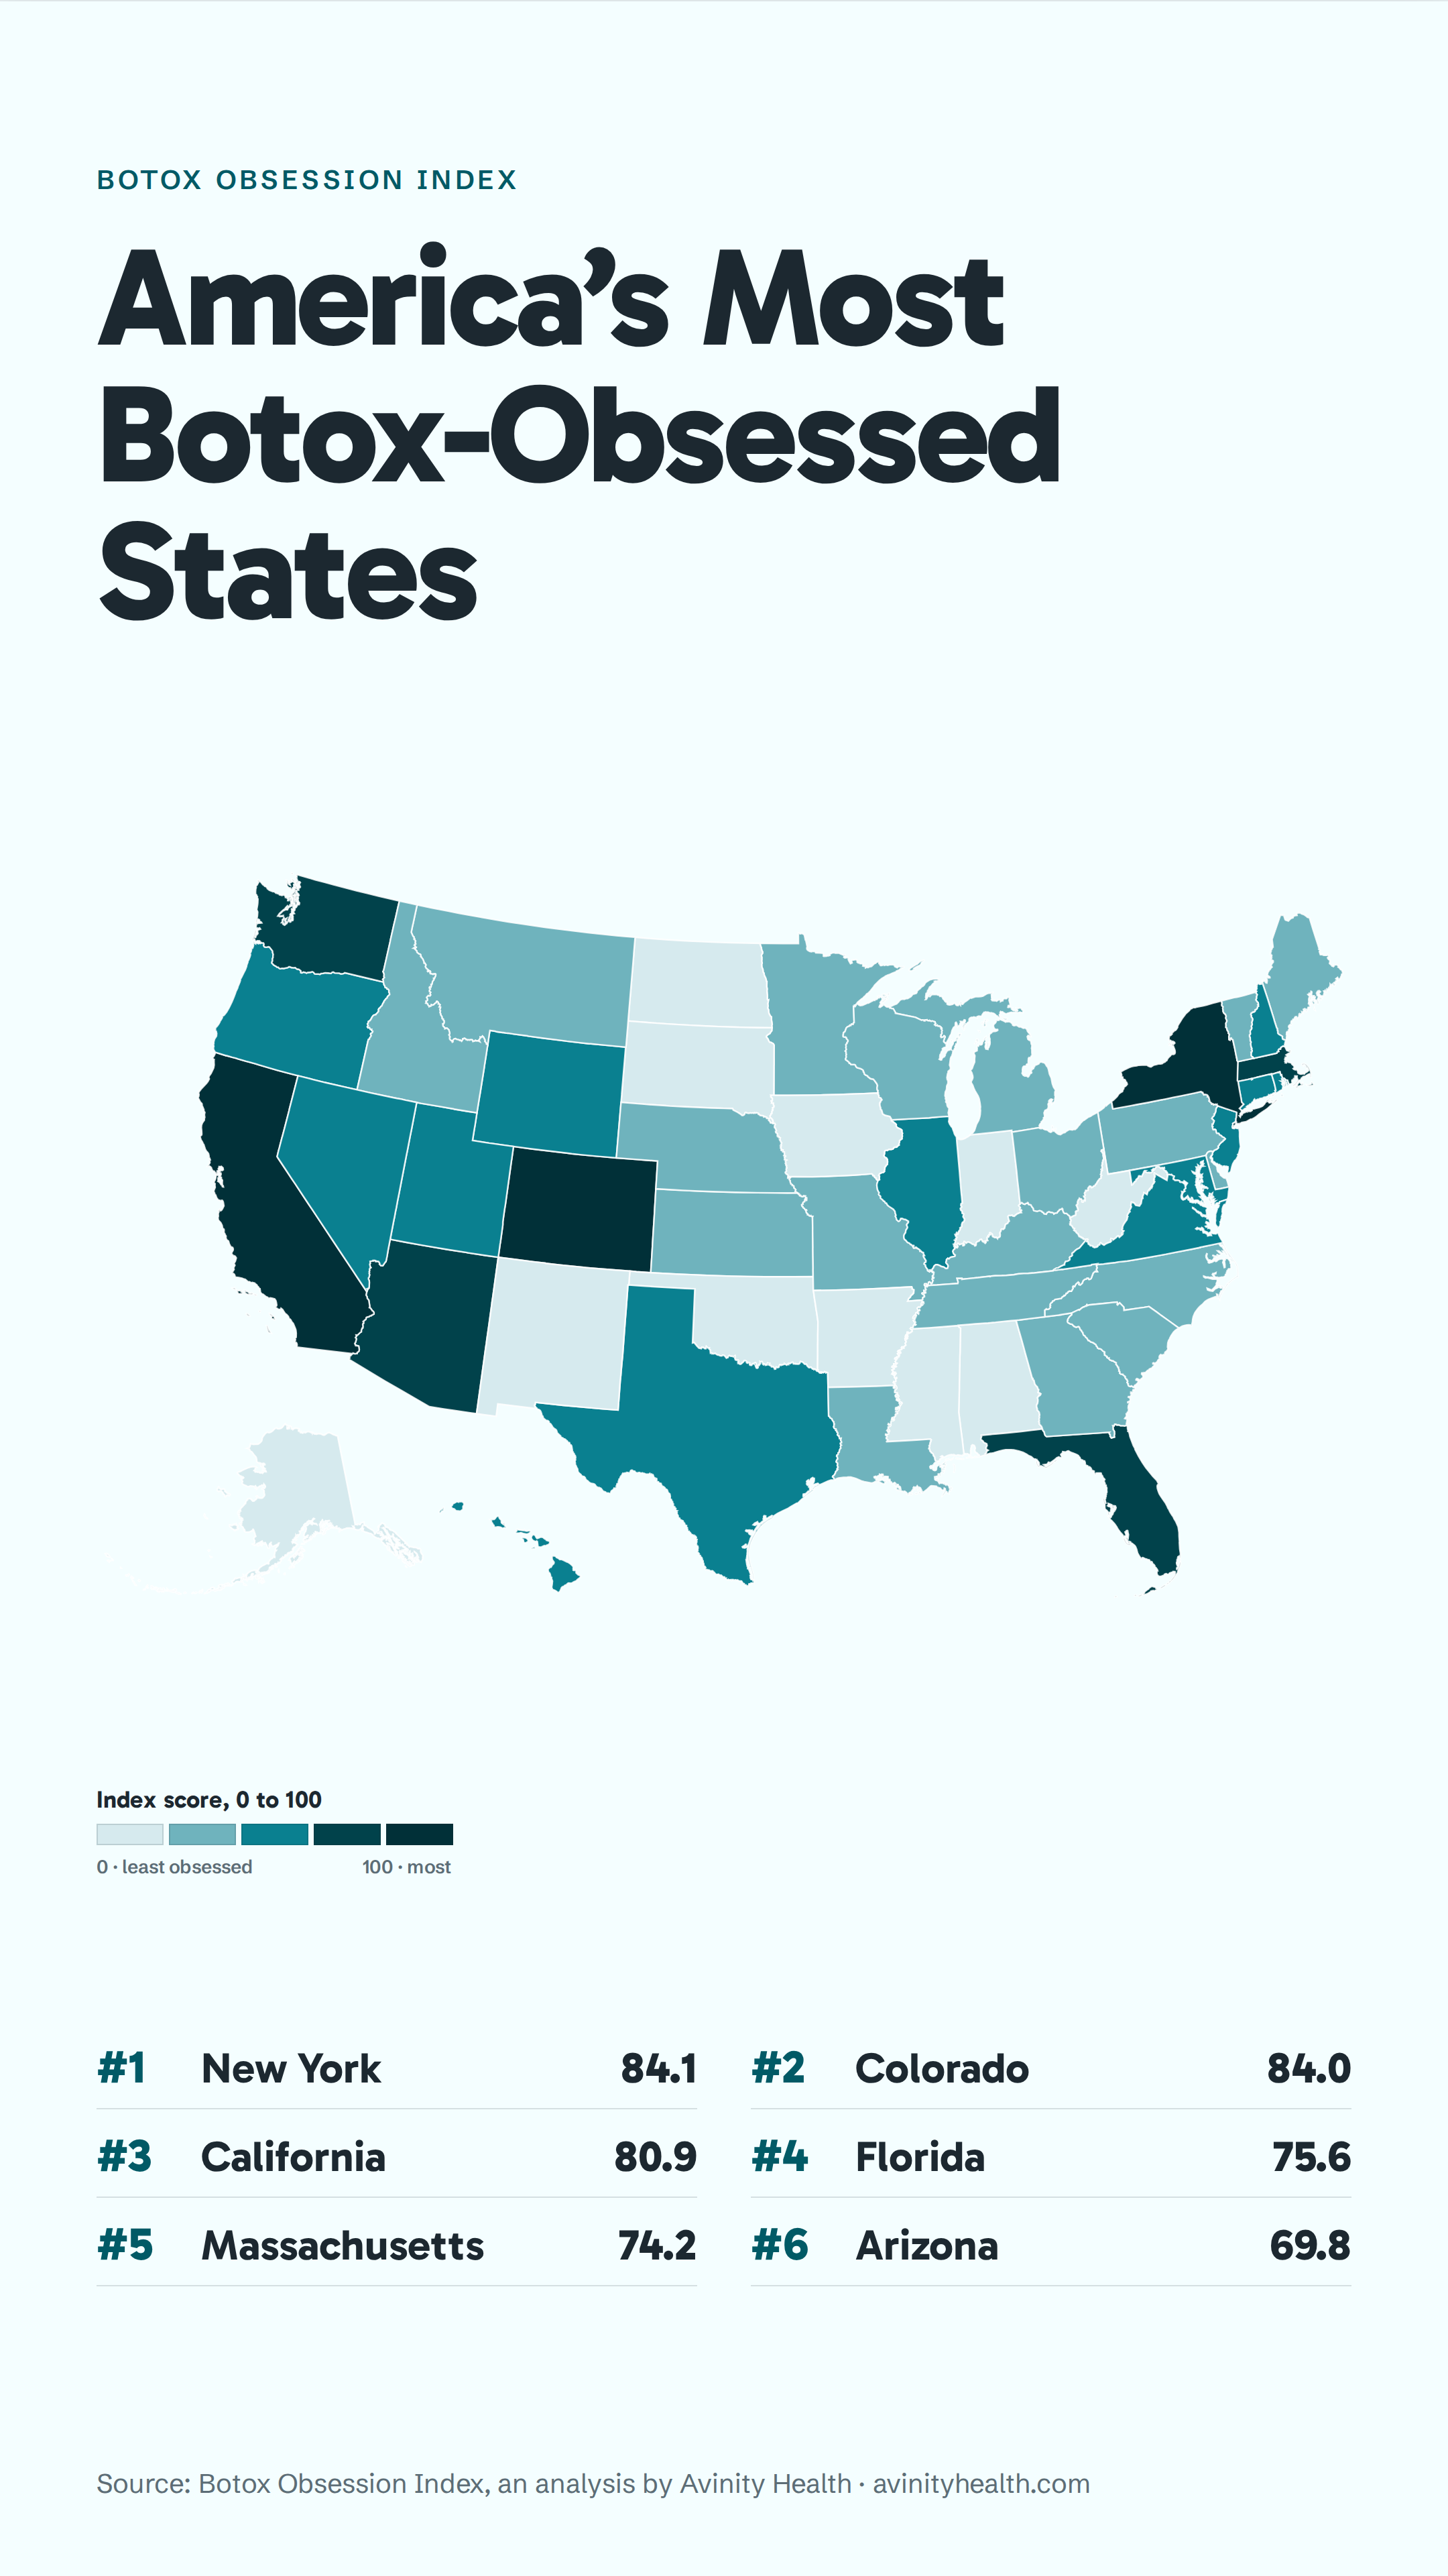
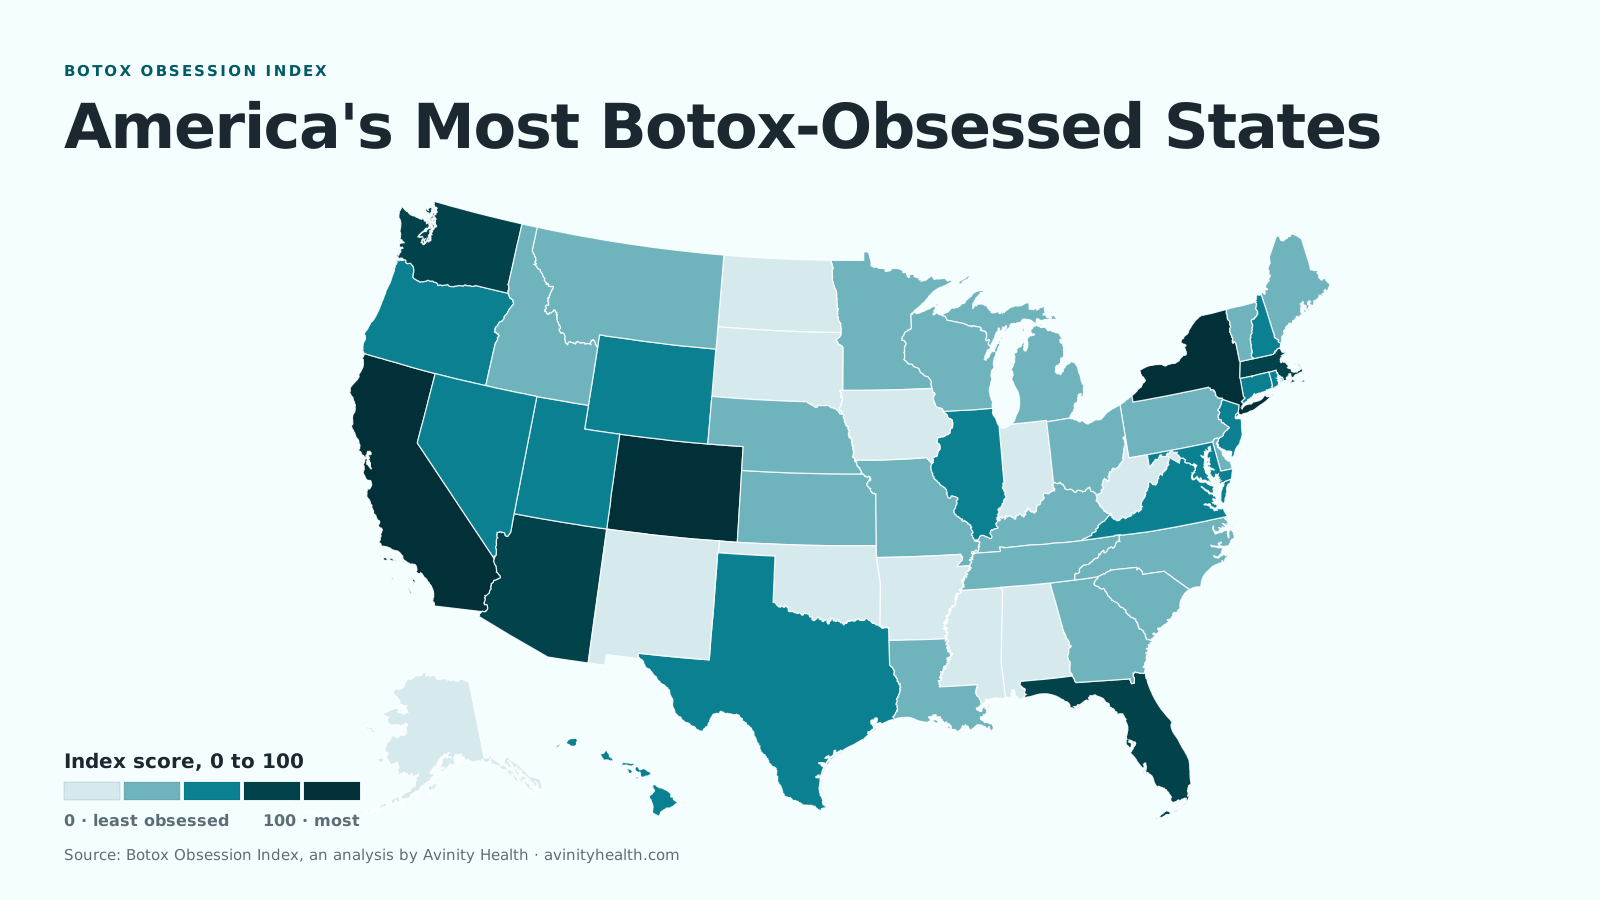
Scored 0 to 100, combining search demand, providers and clinics, and relative interest, all per resident. Free to republish with attribution.
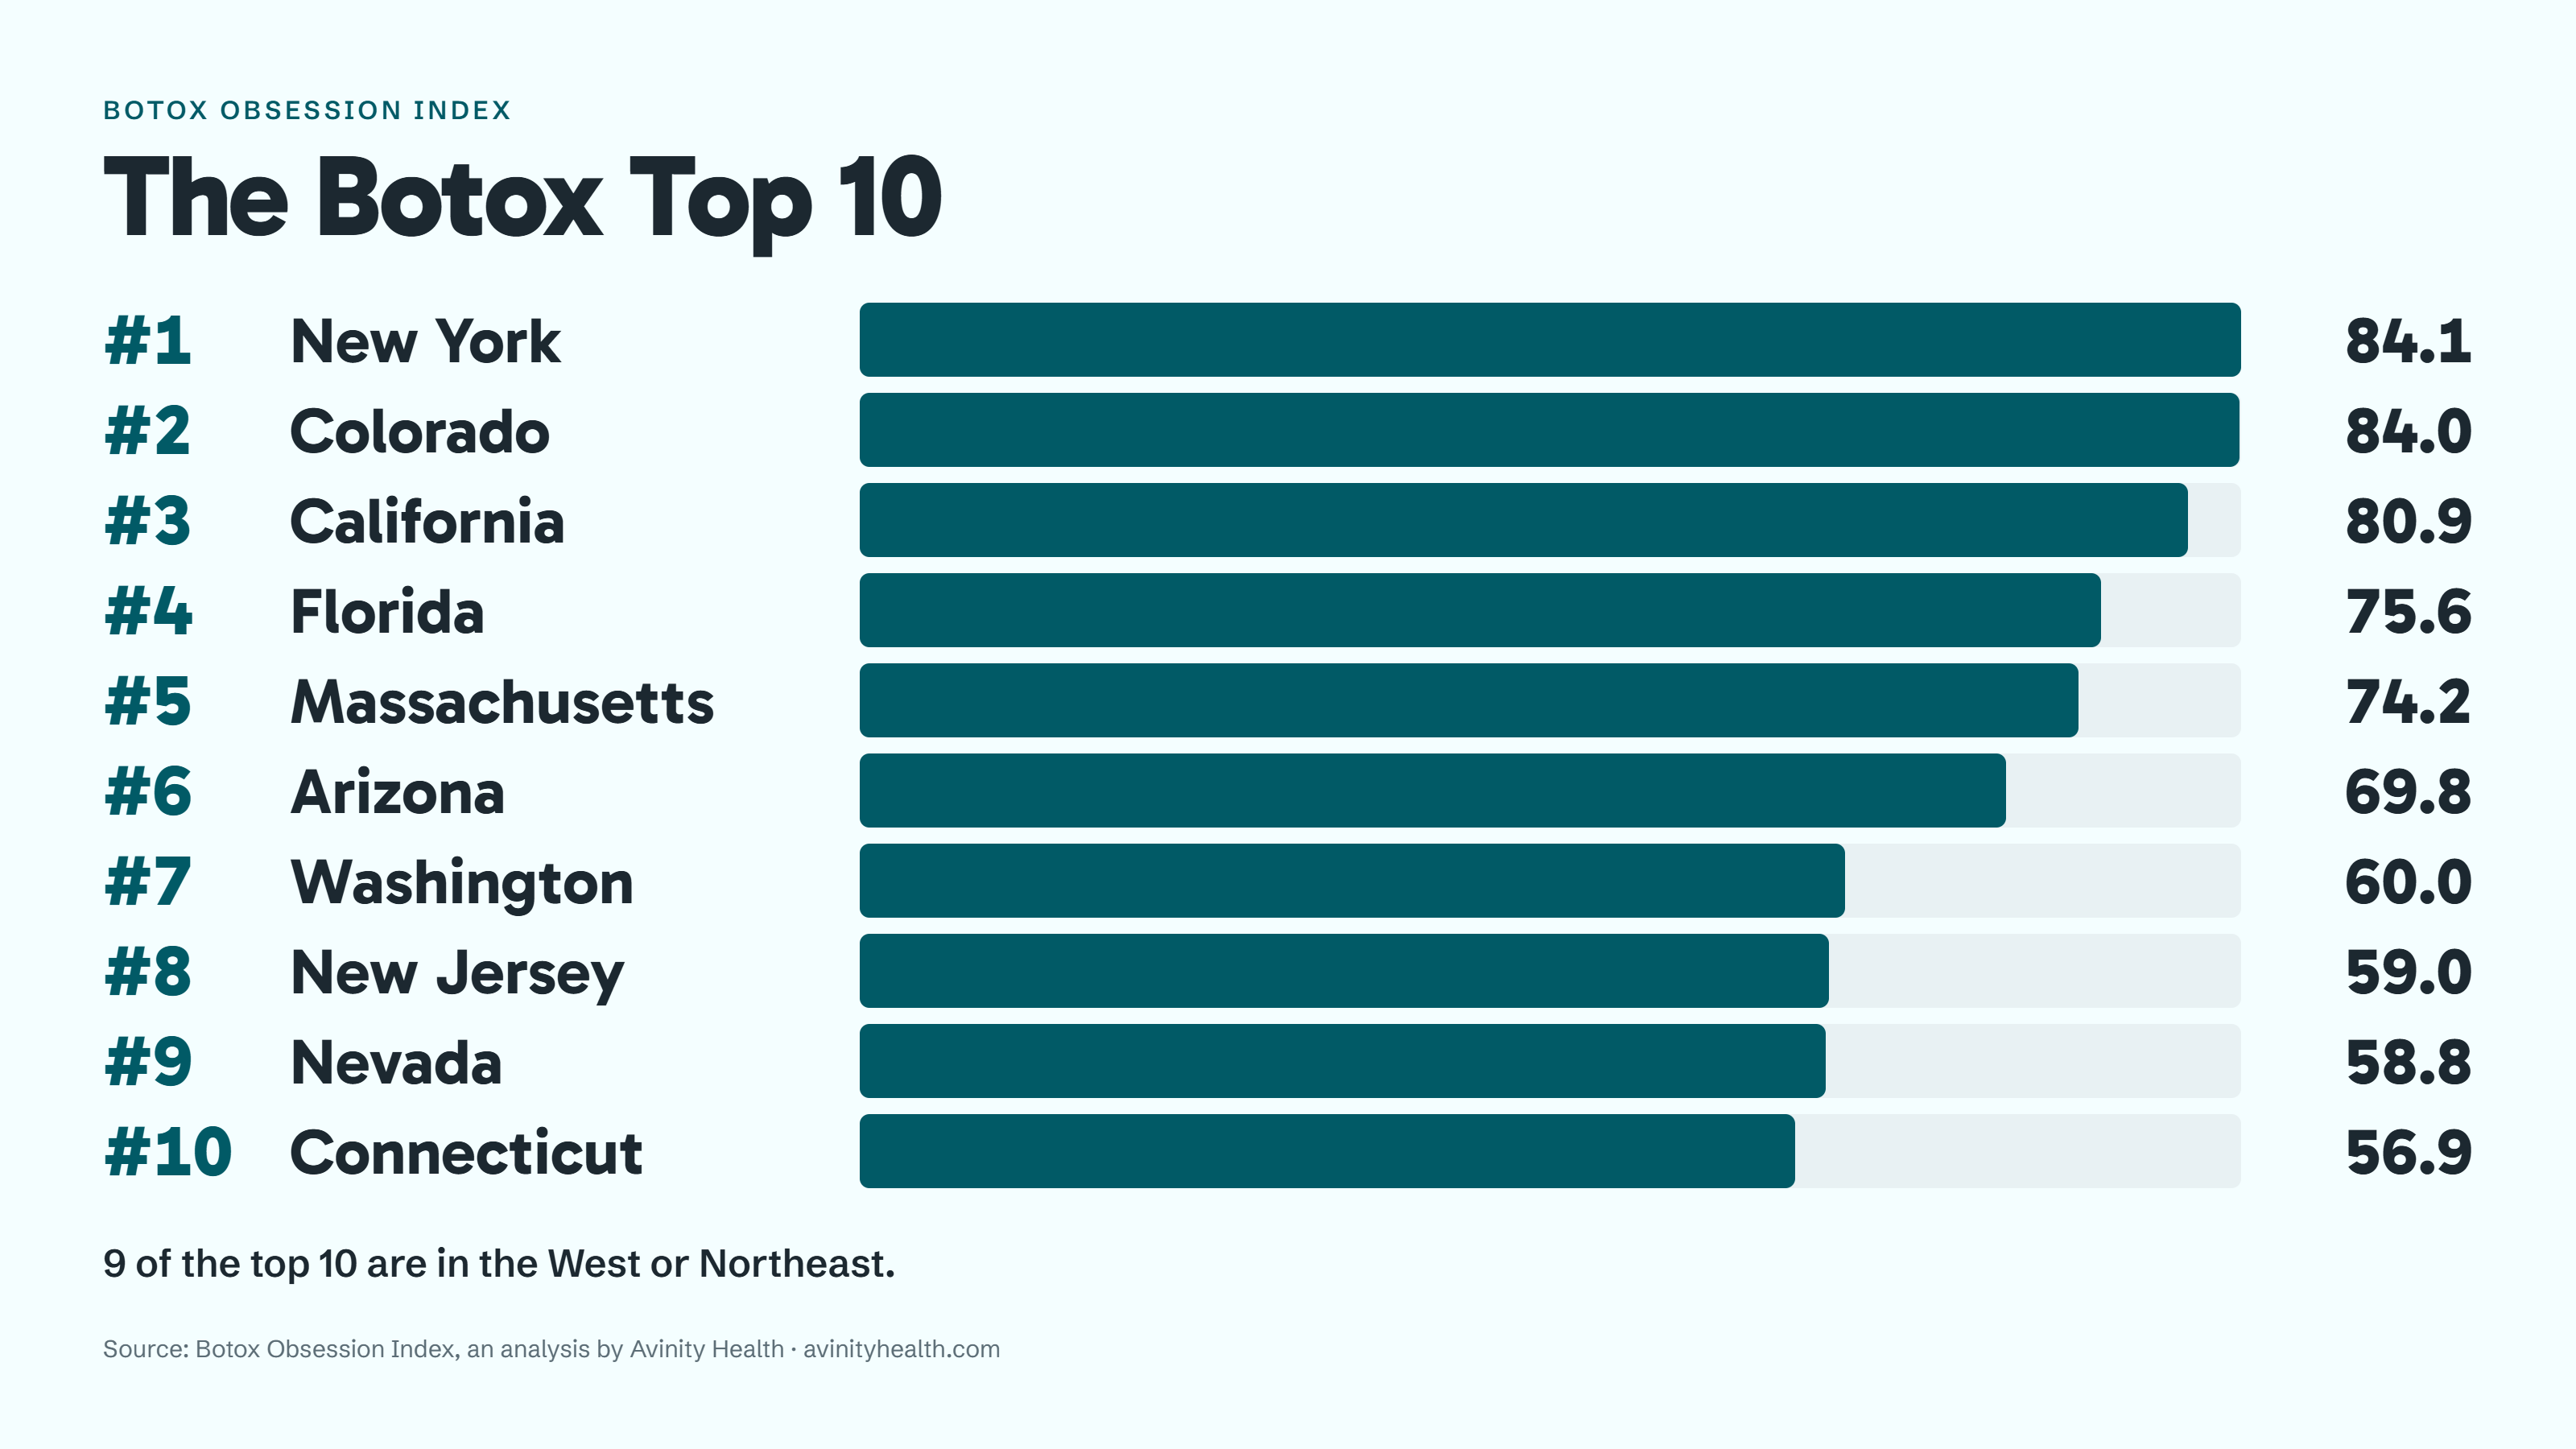
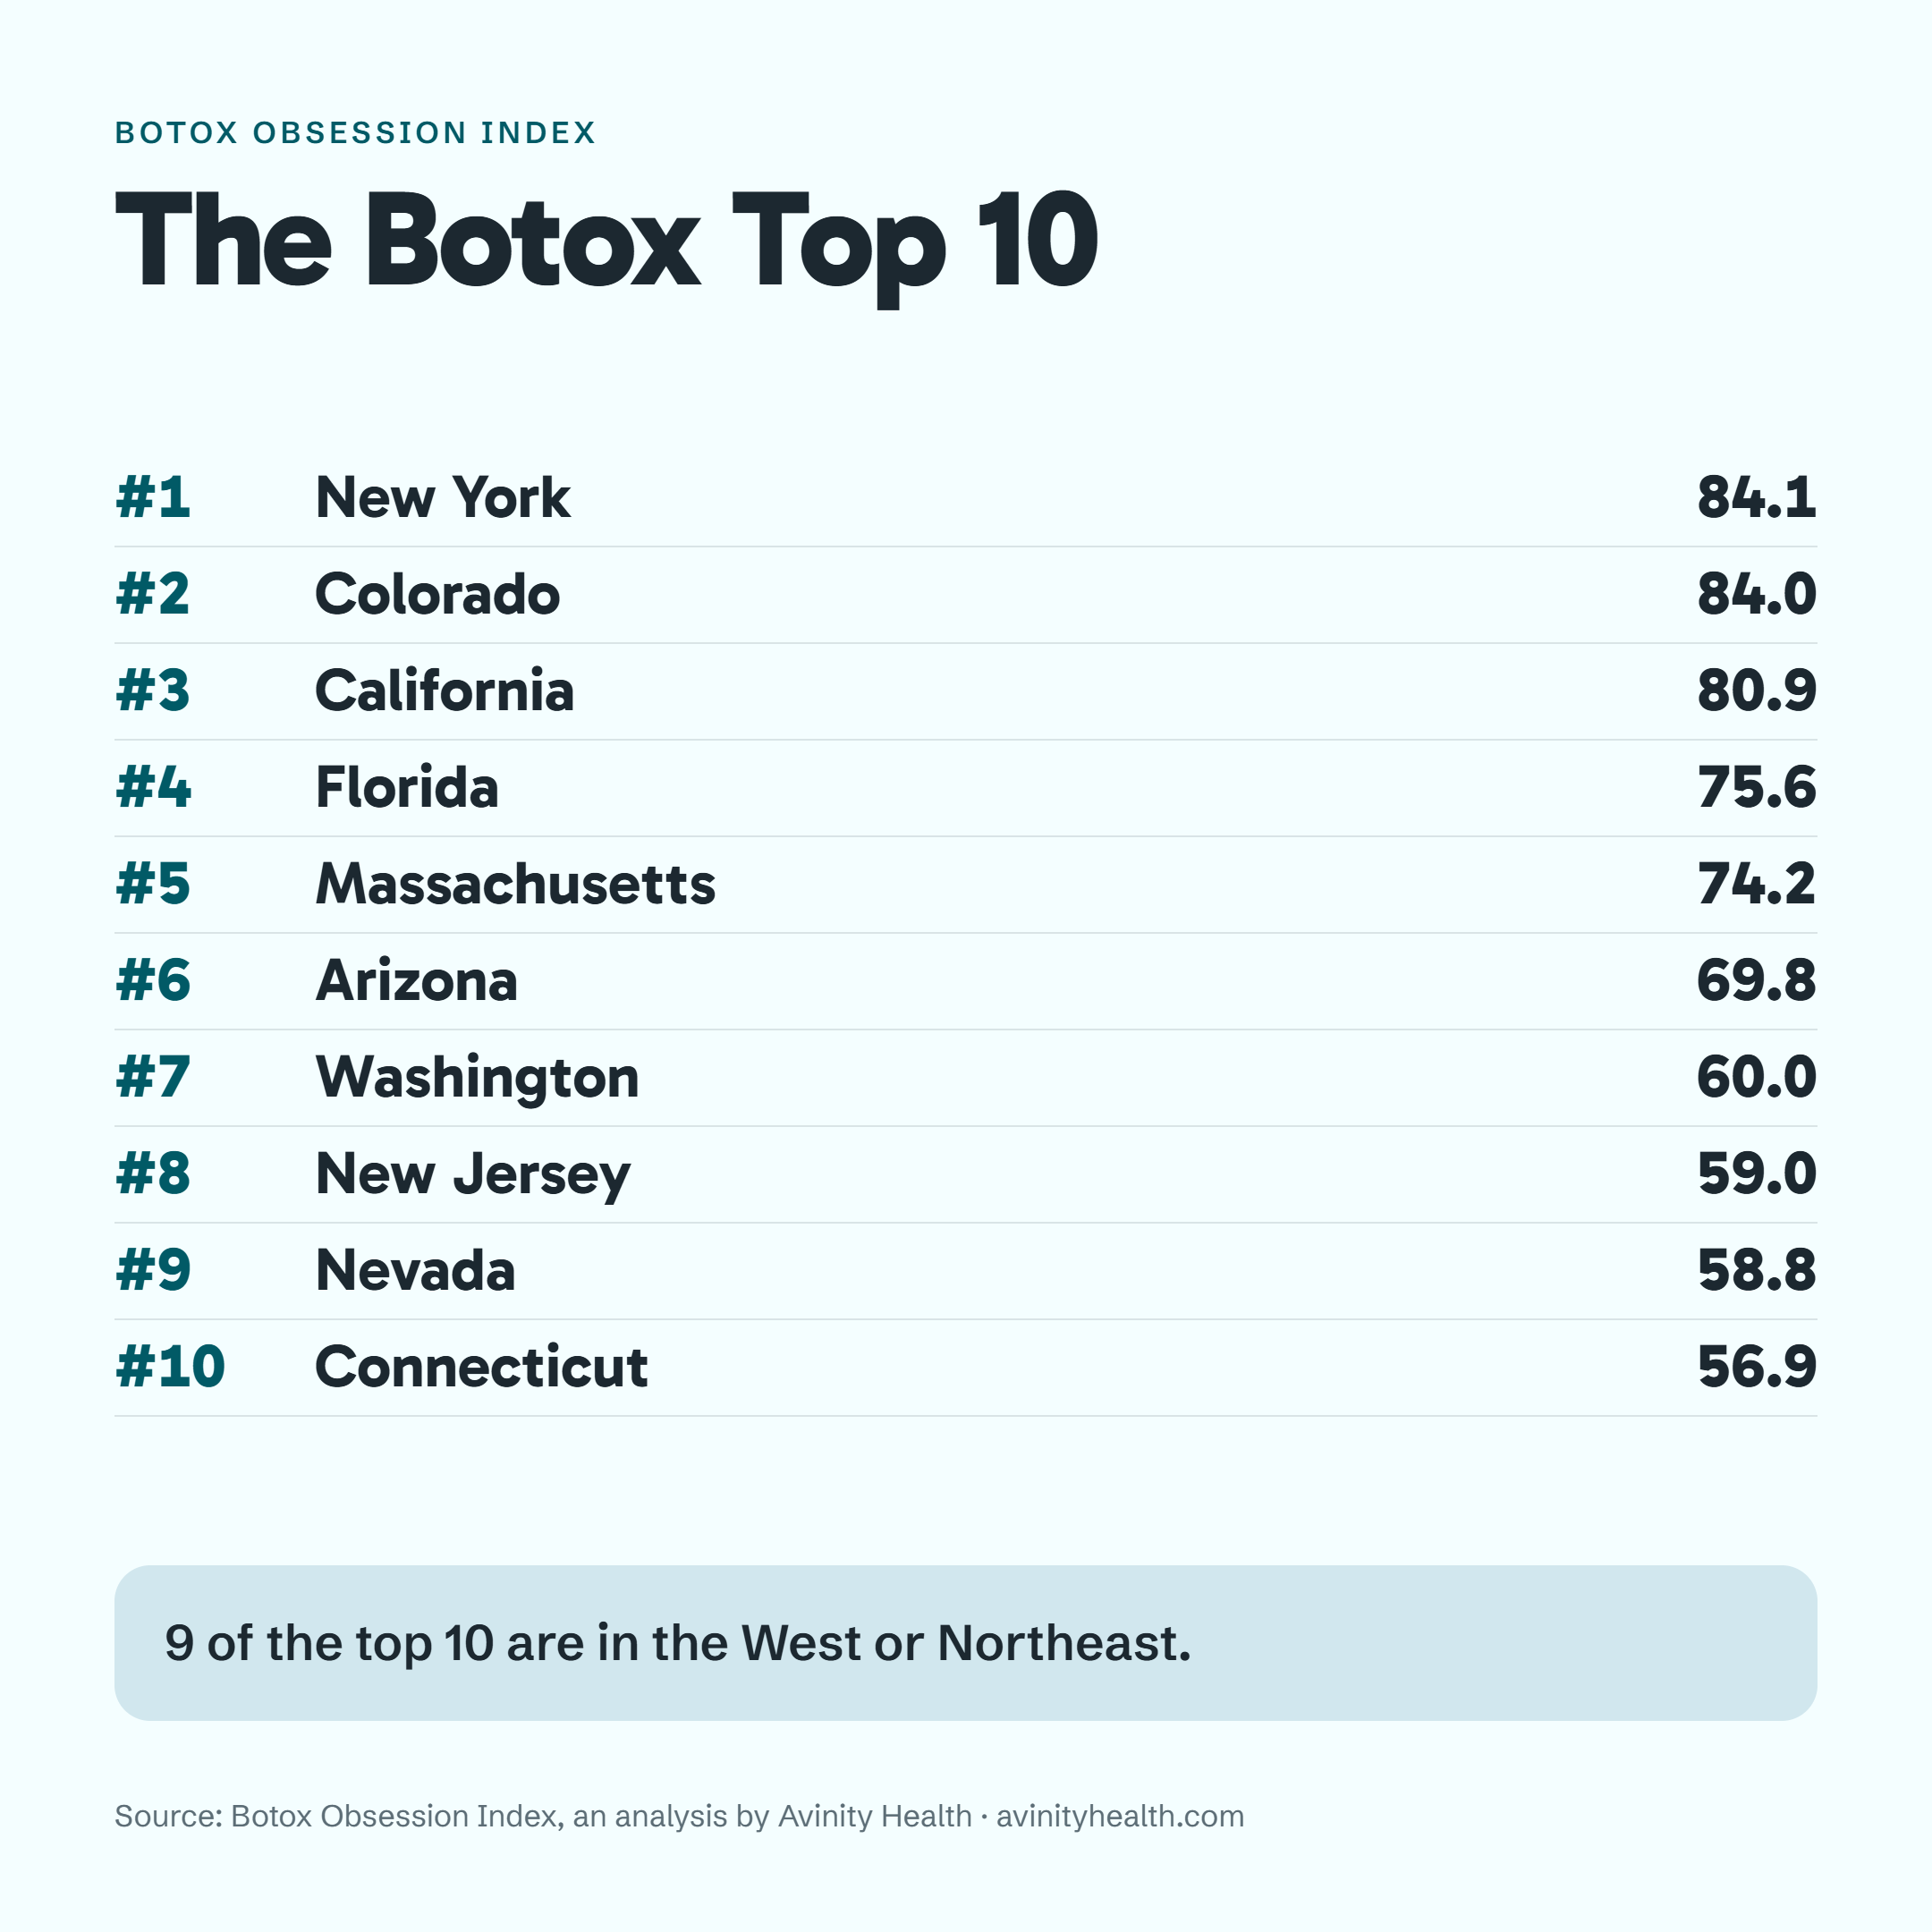
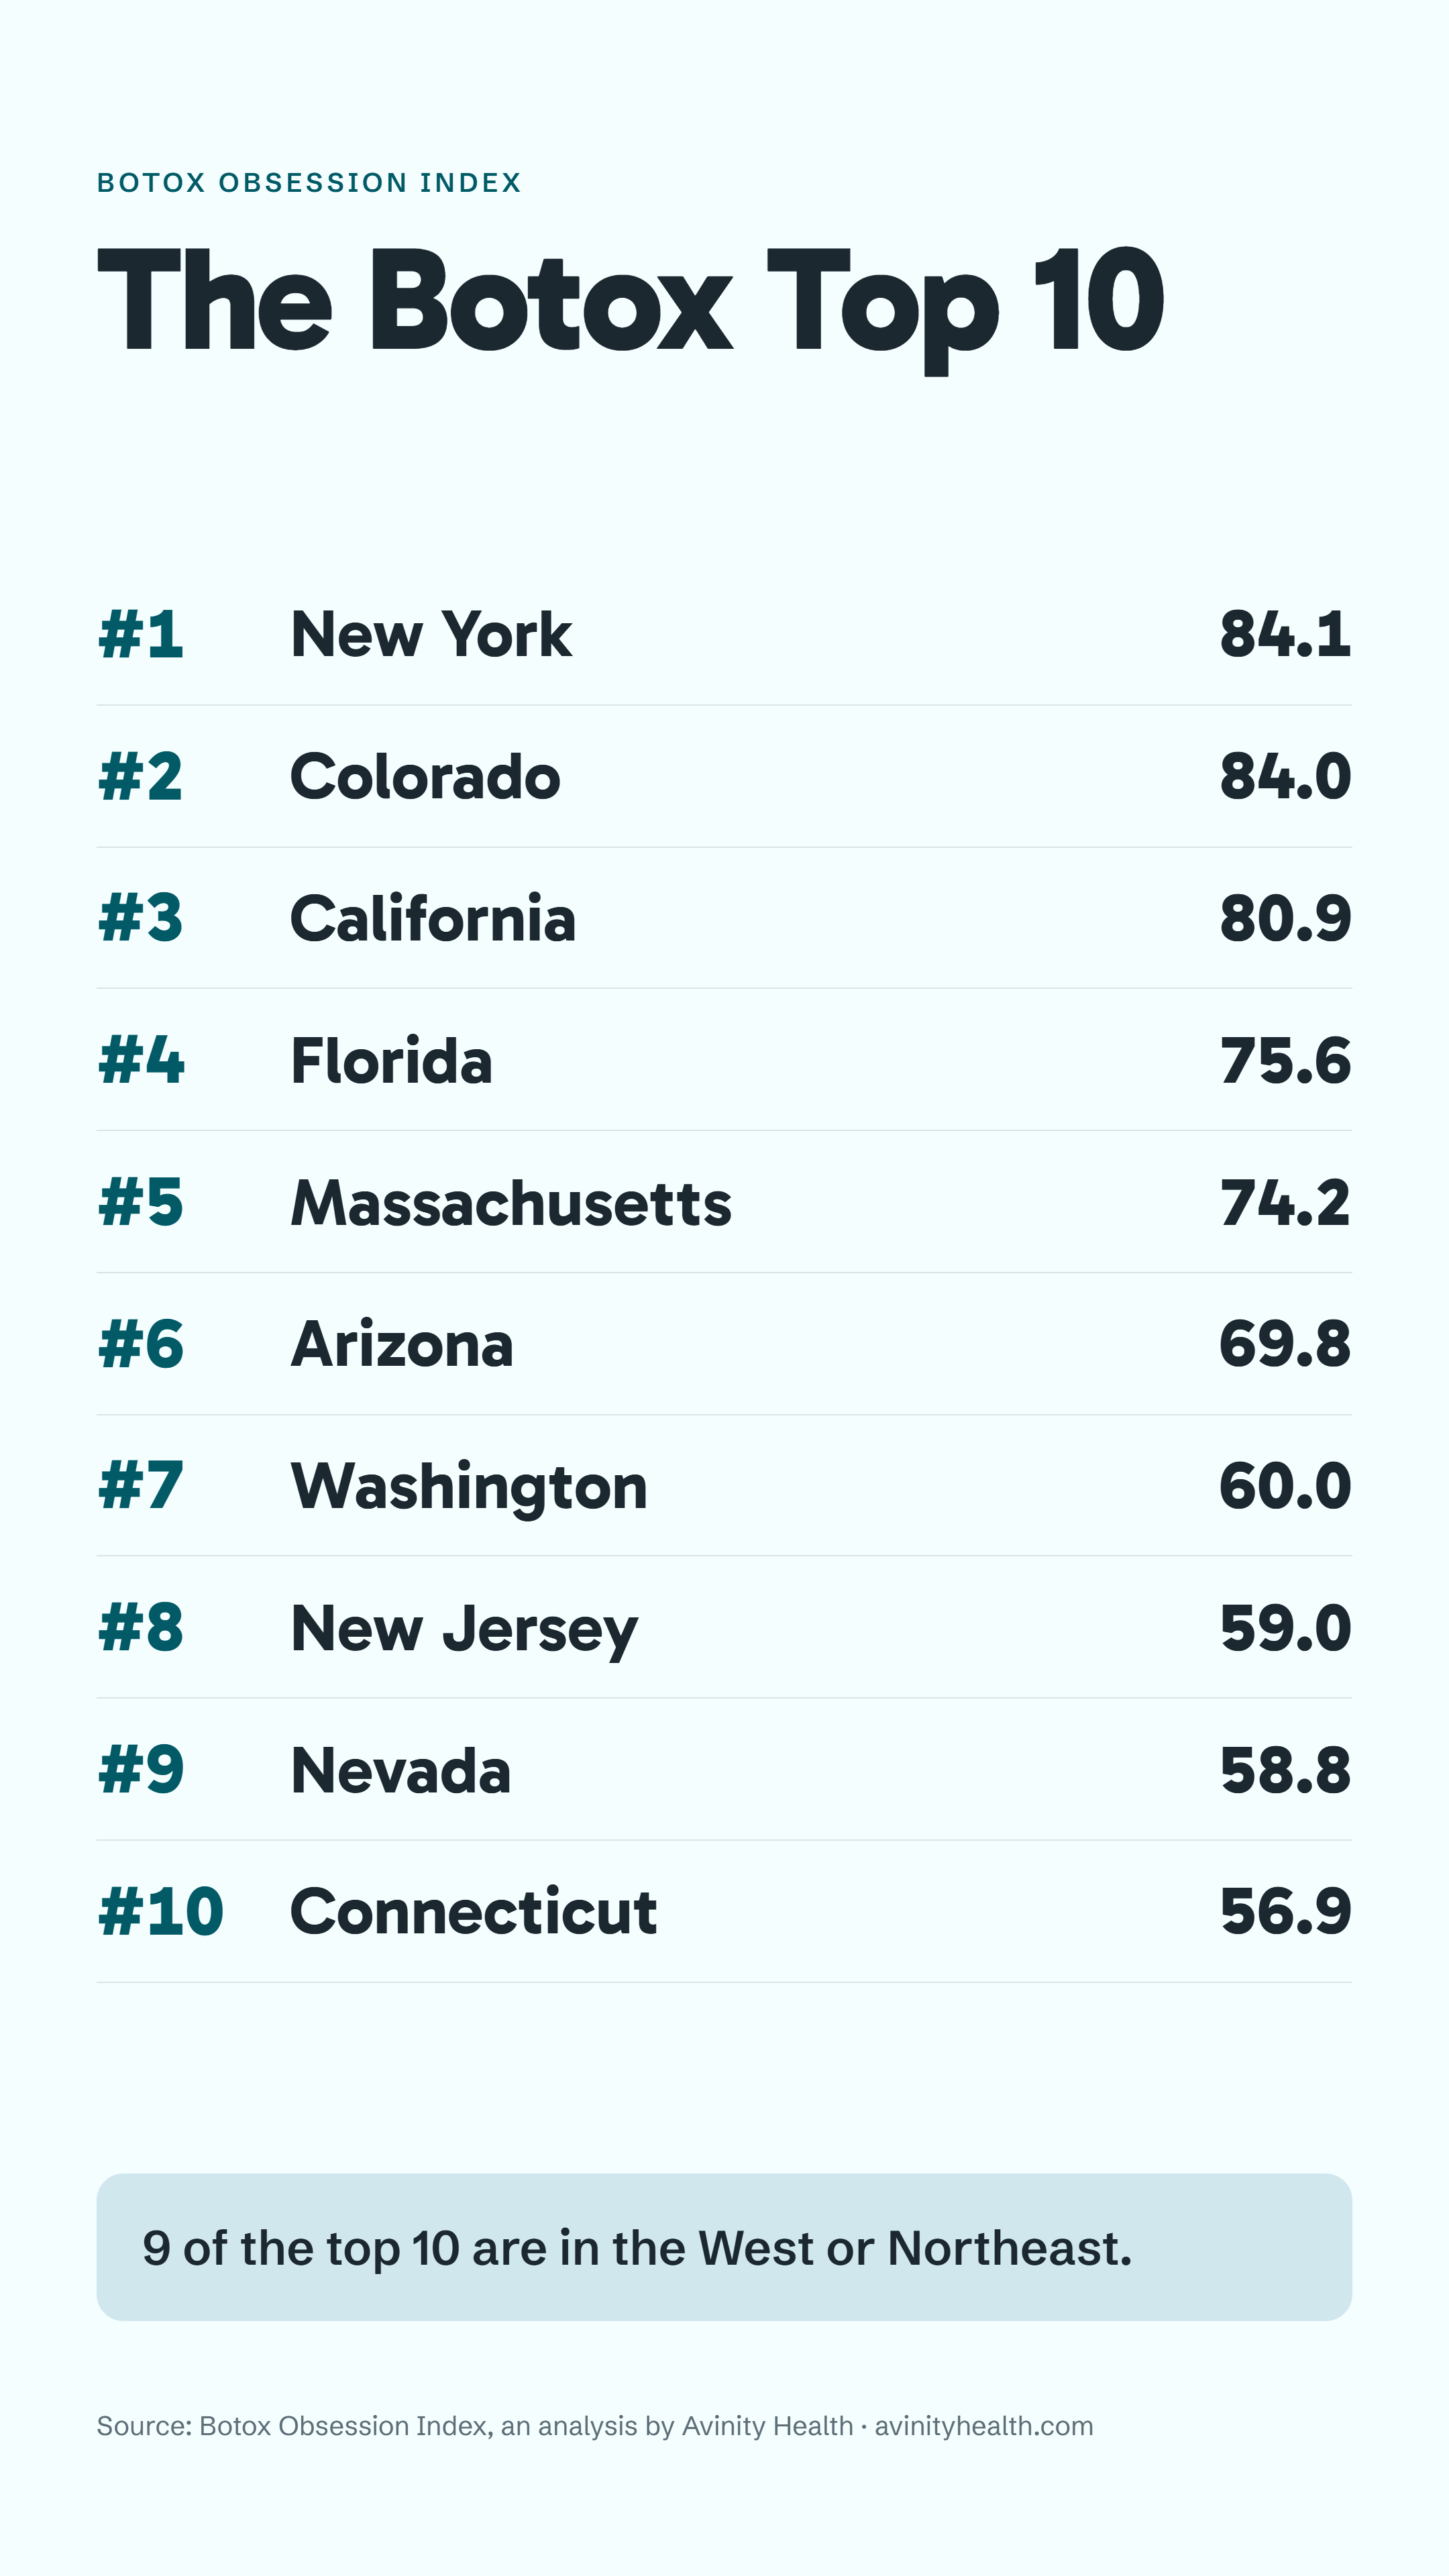
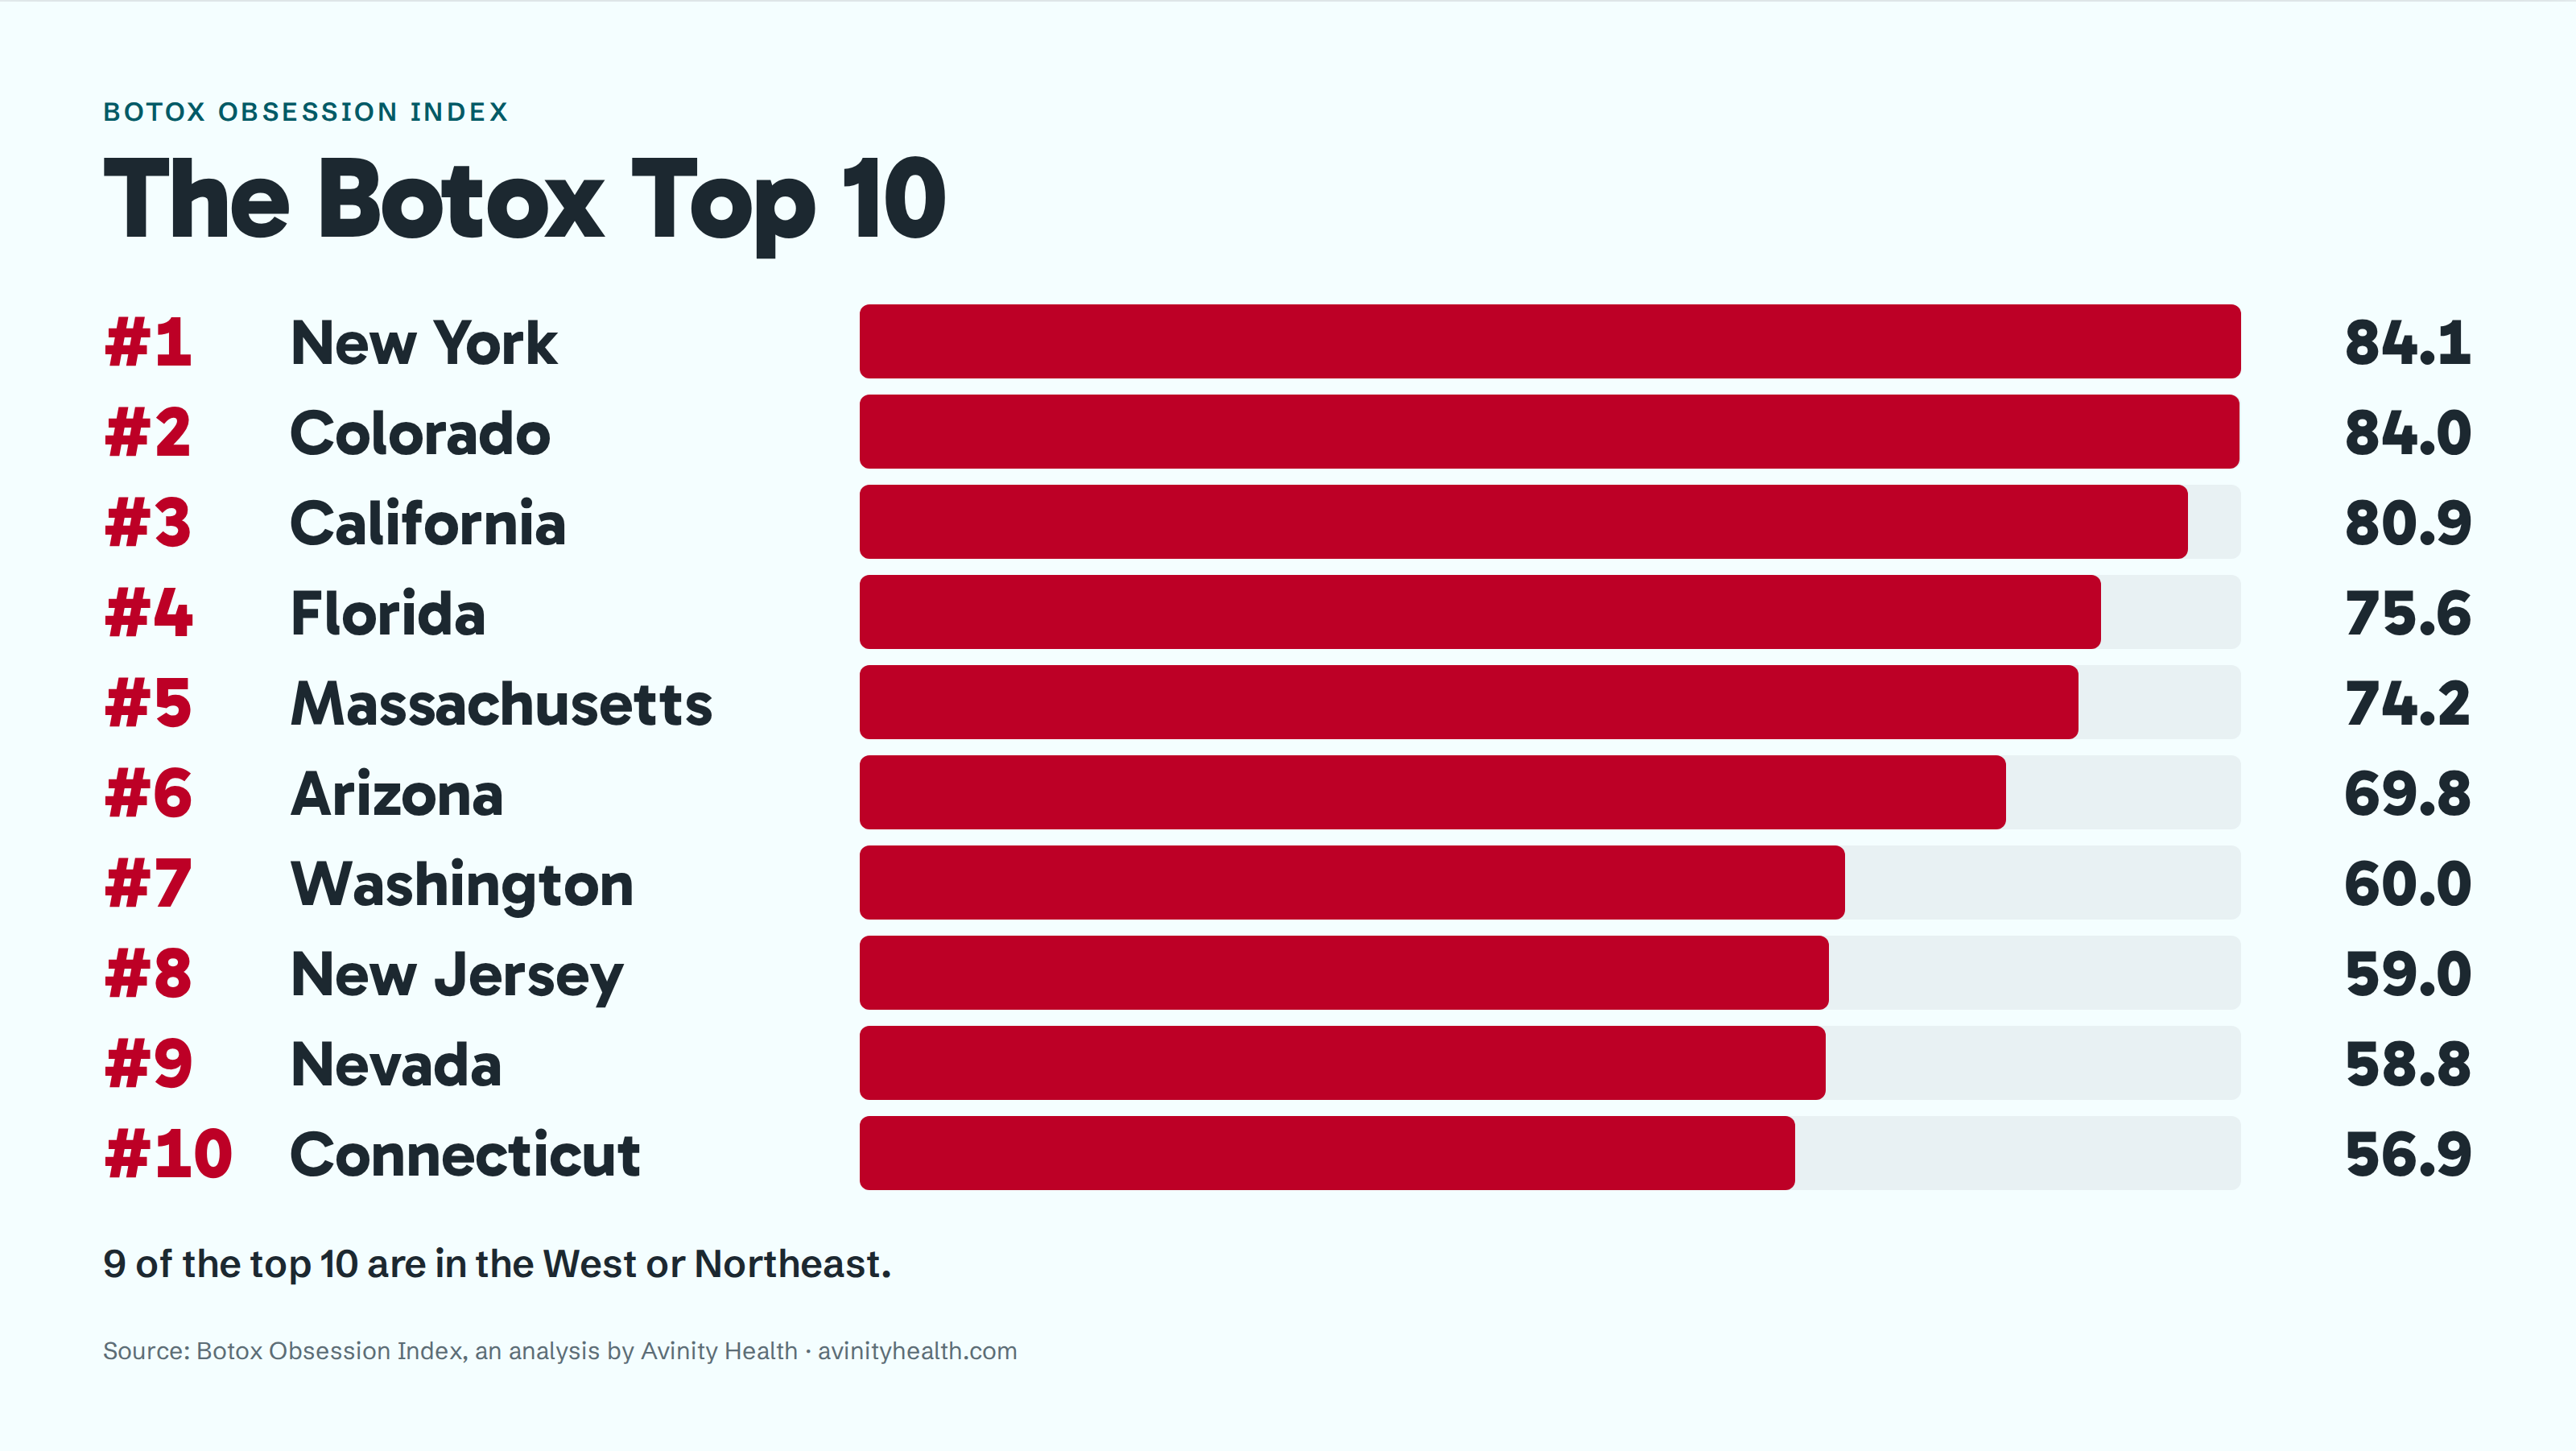
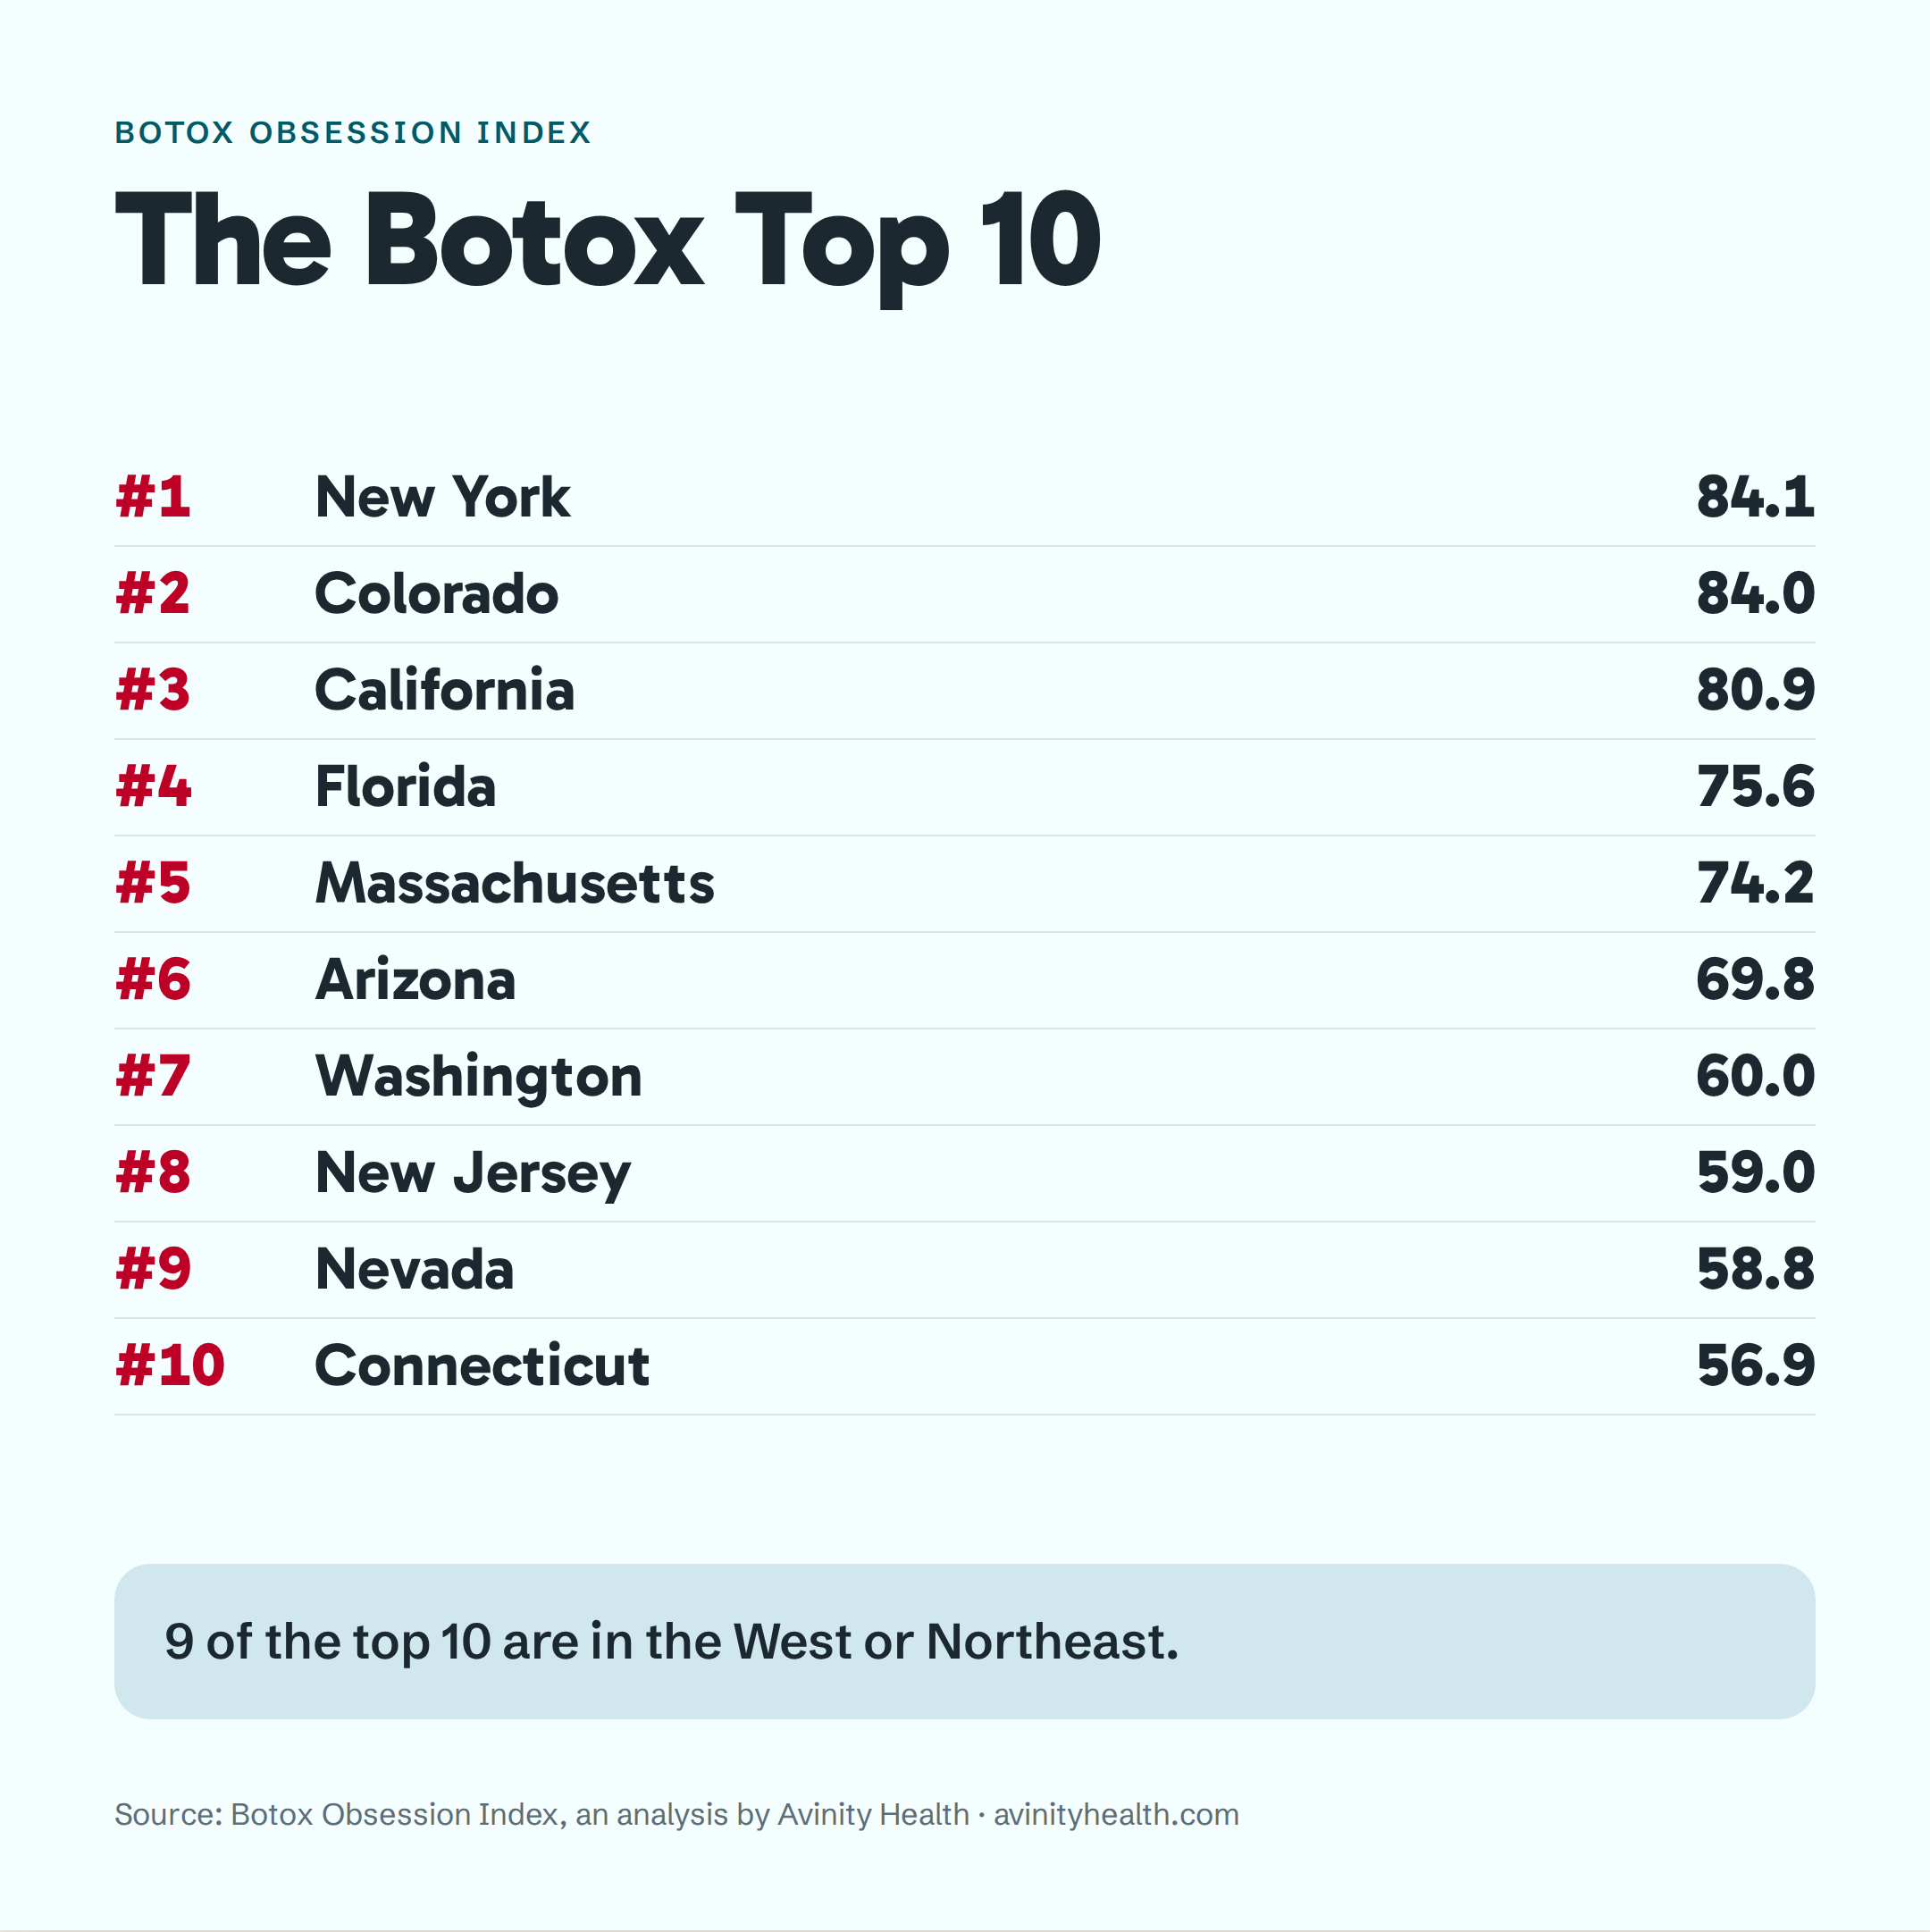
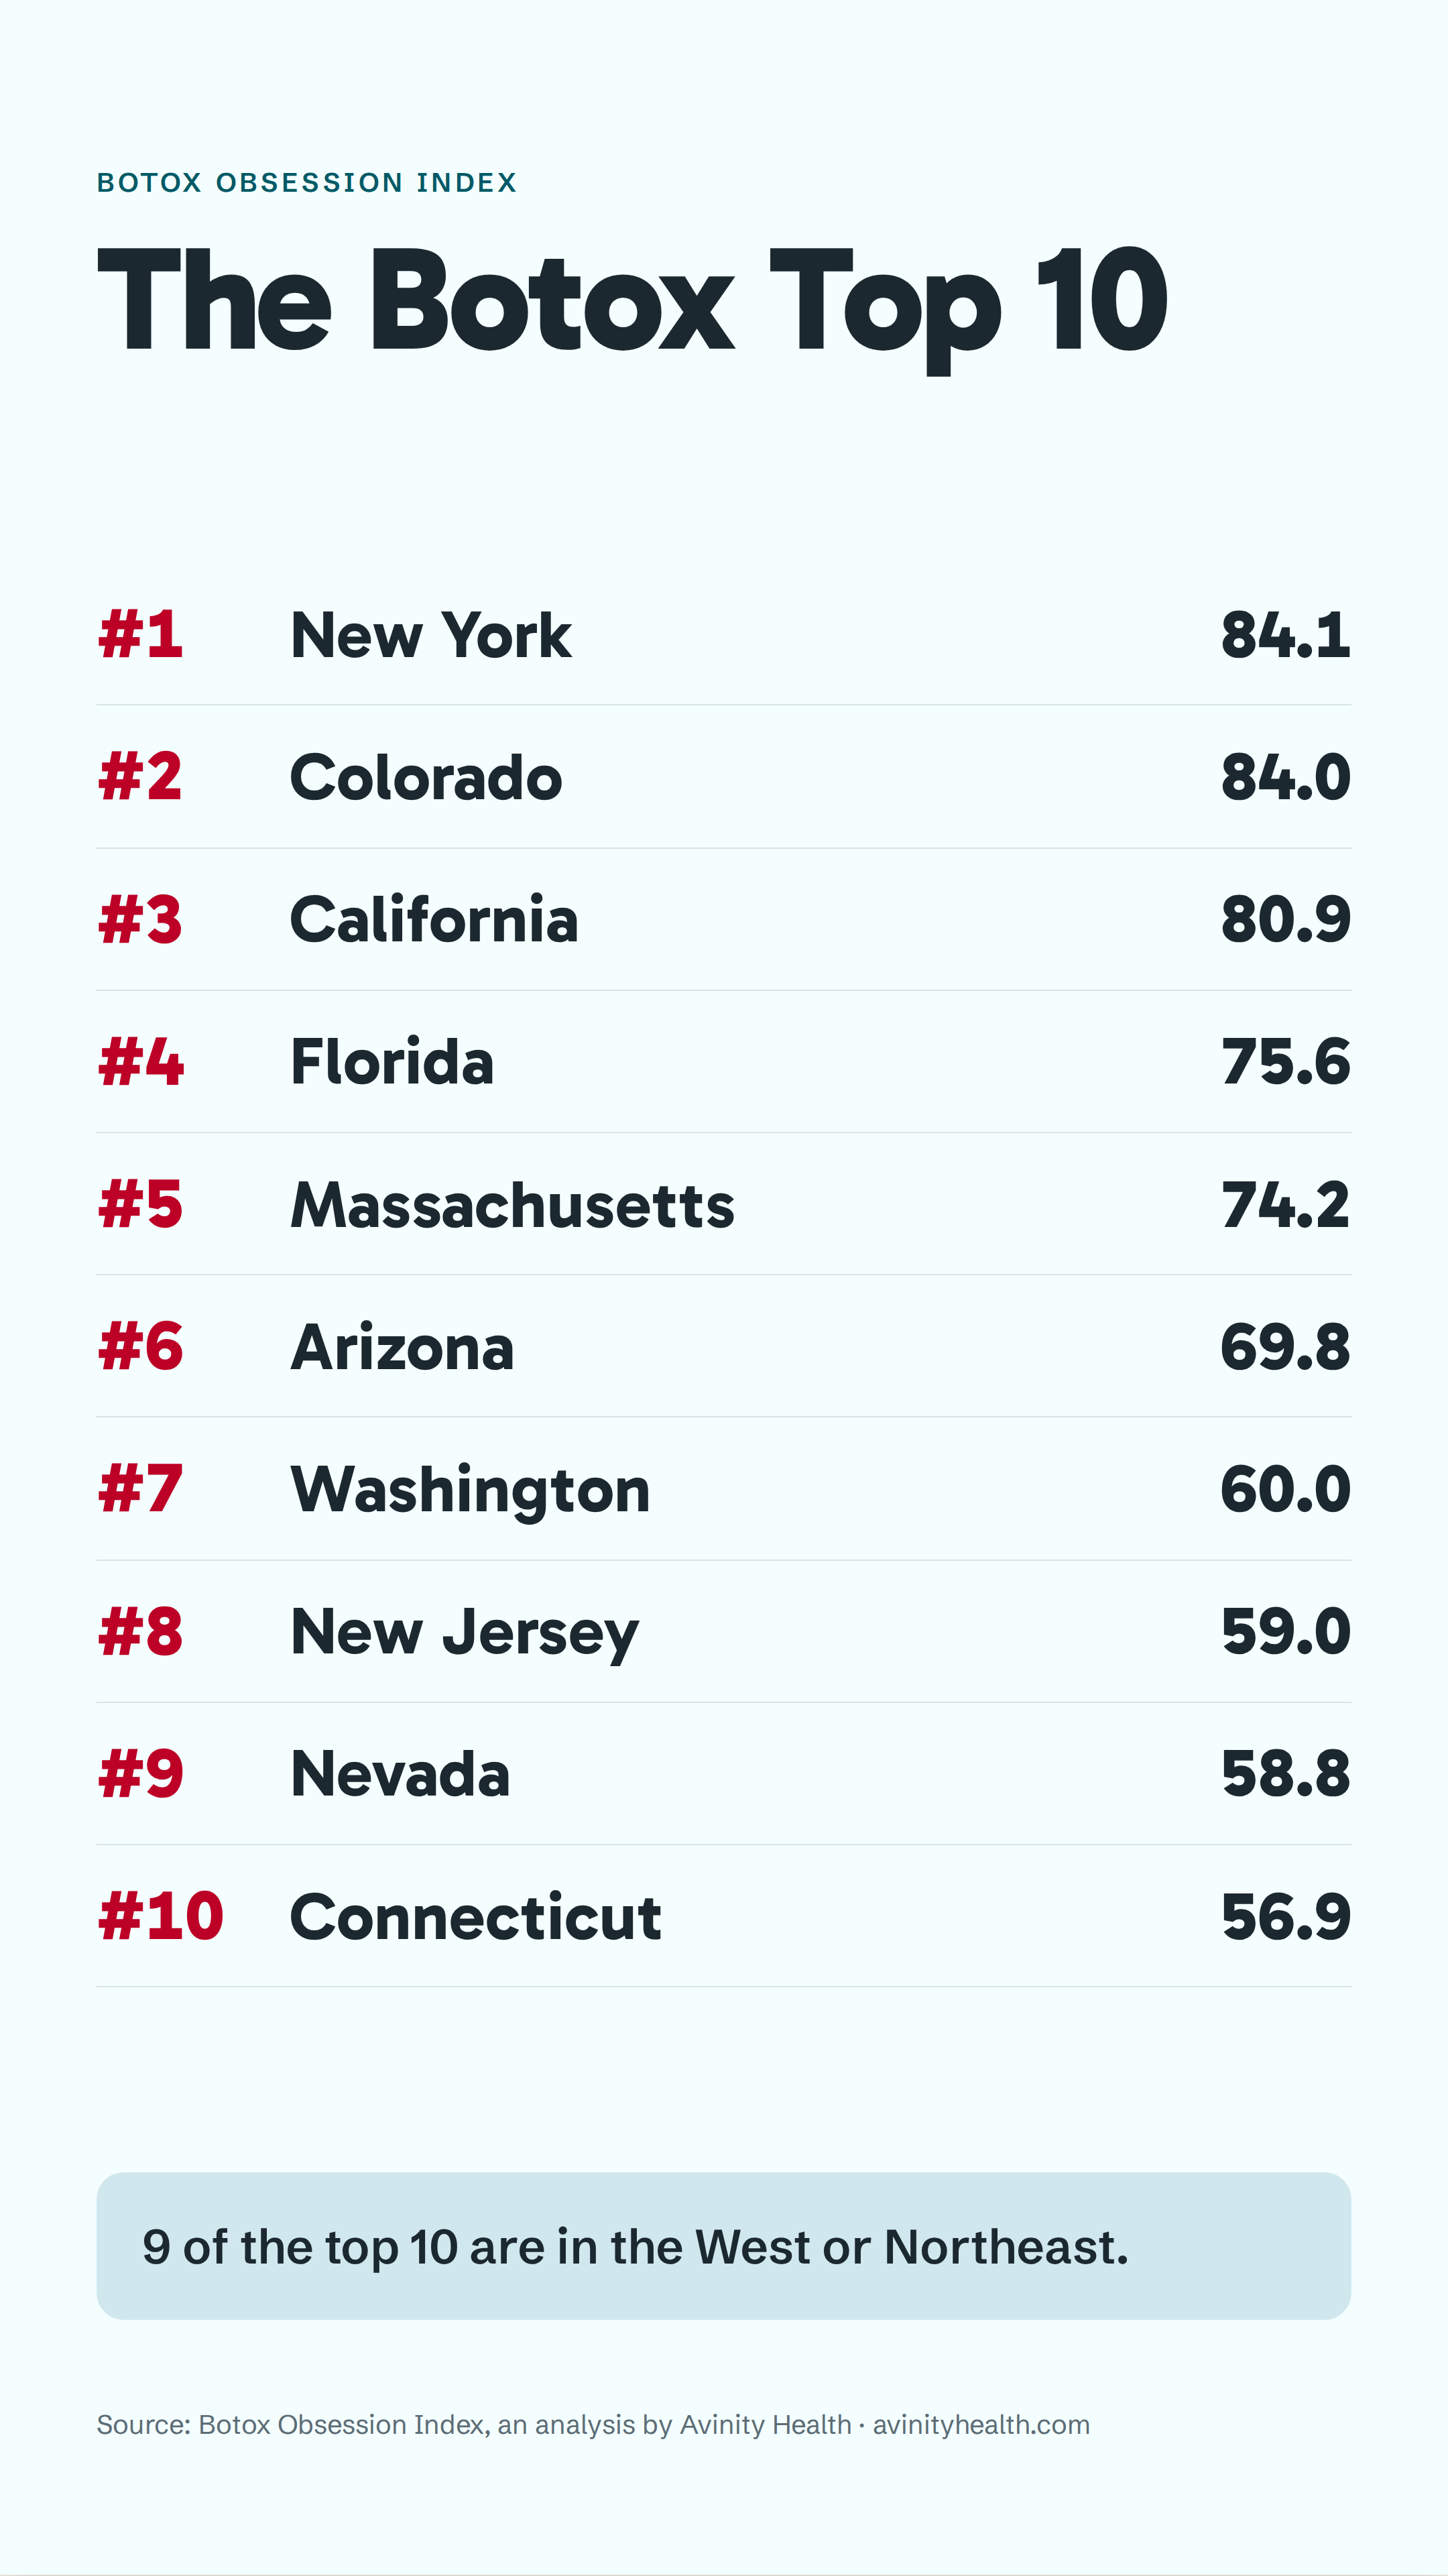
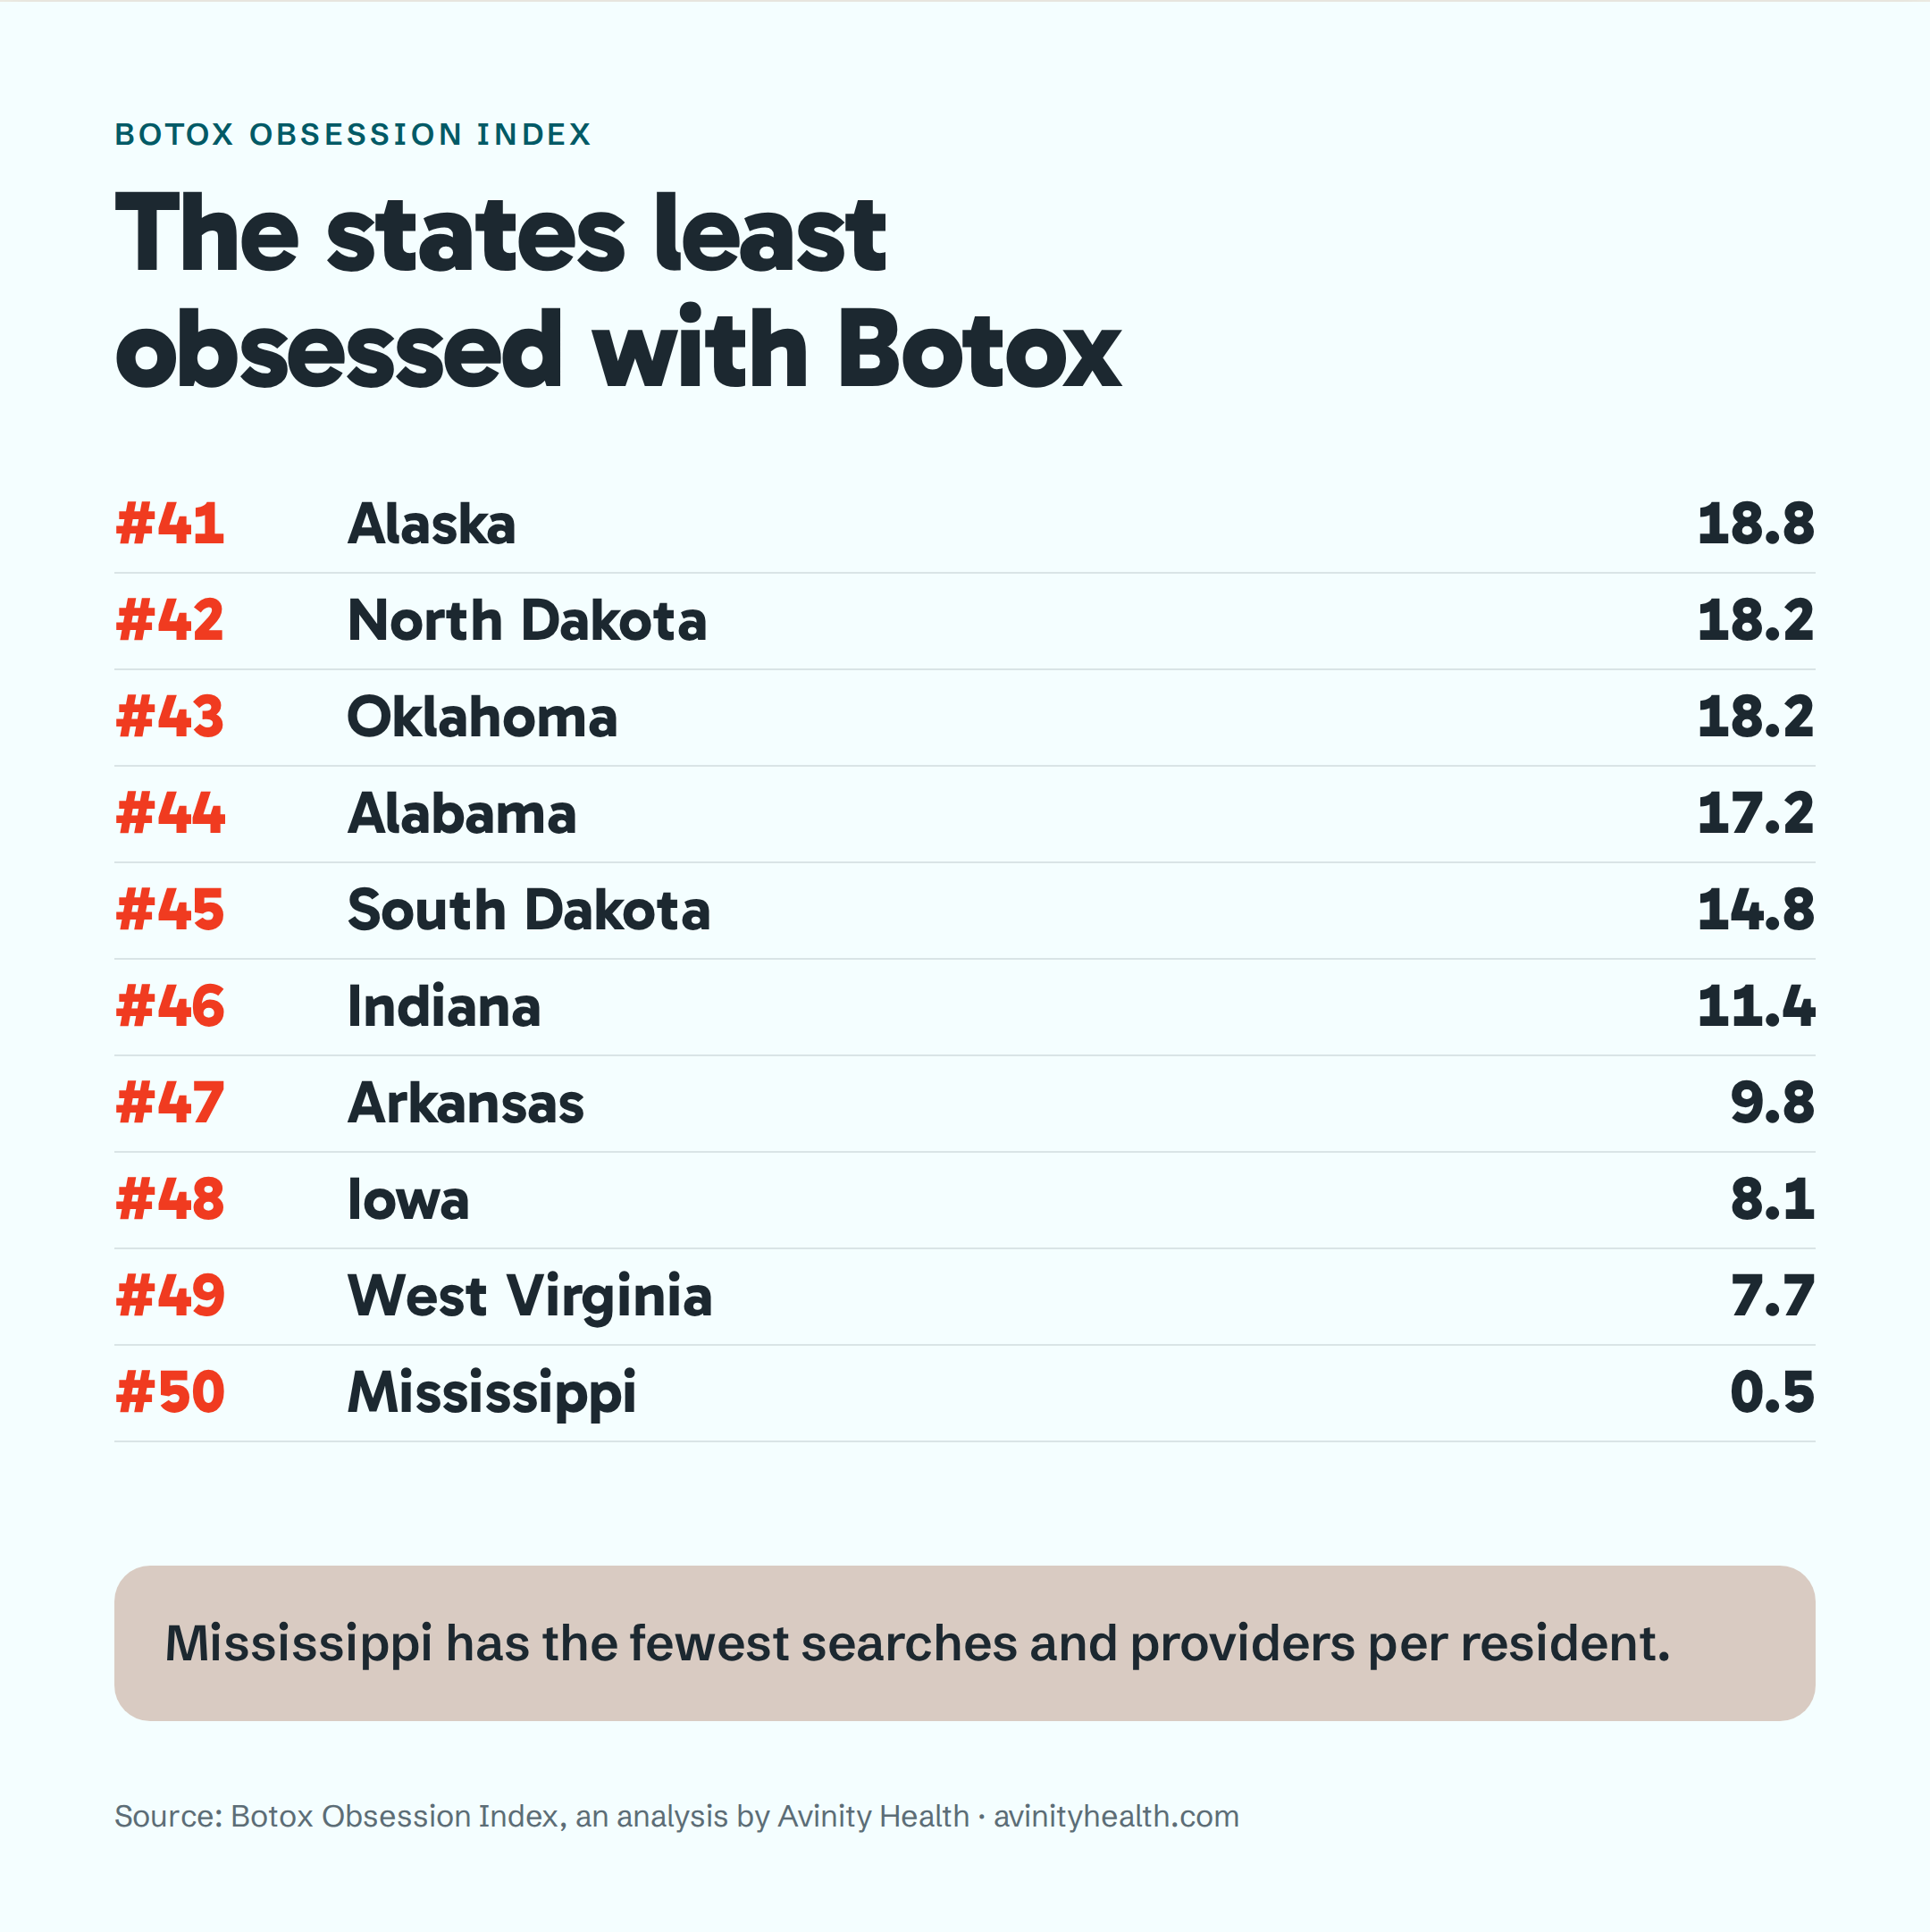
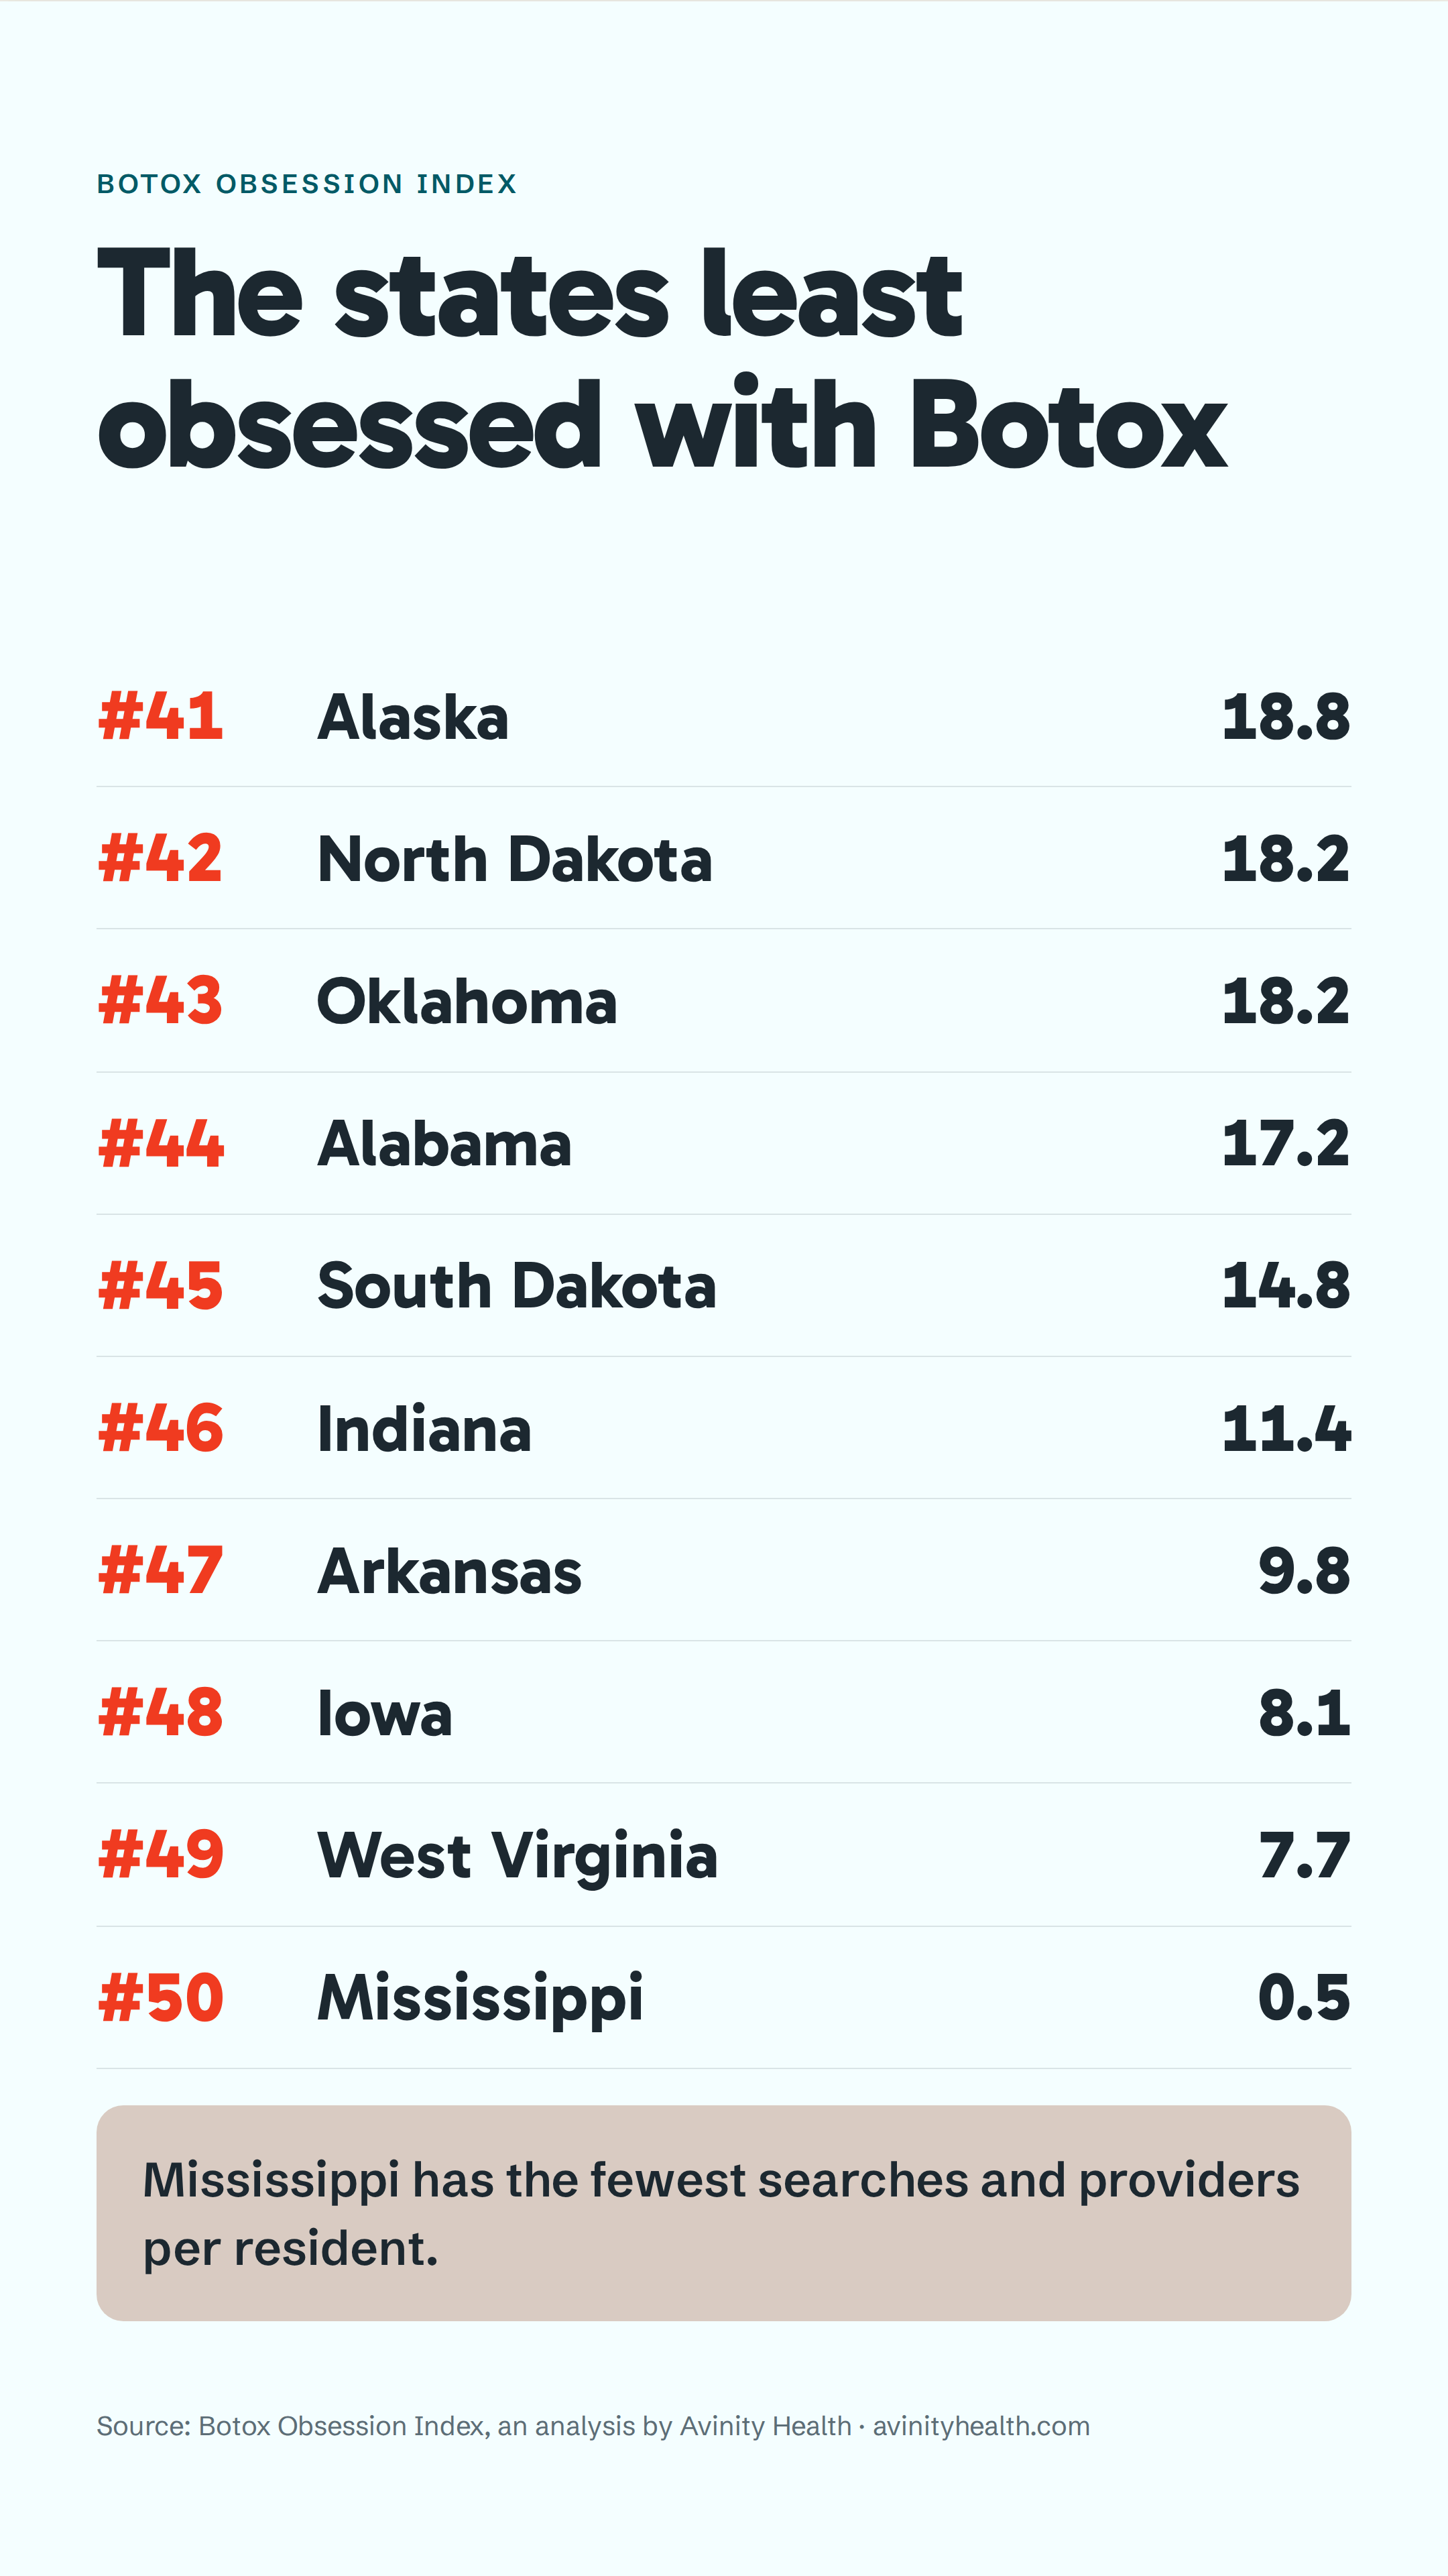
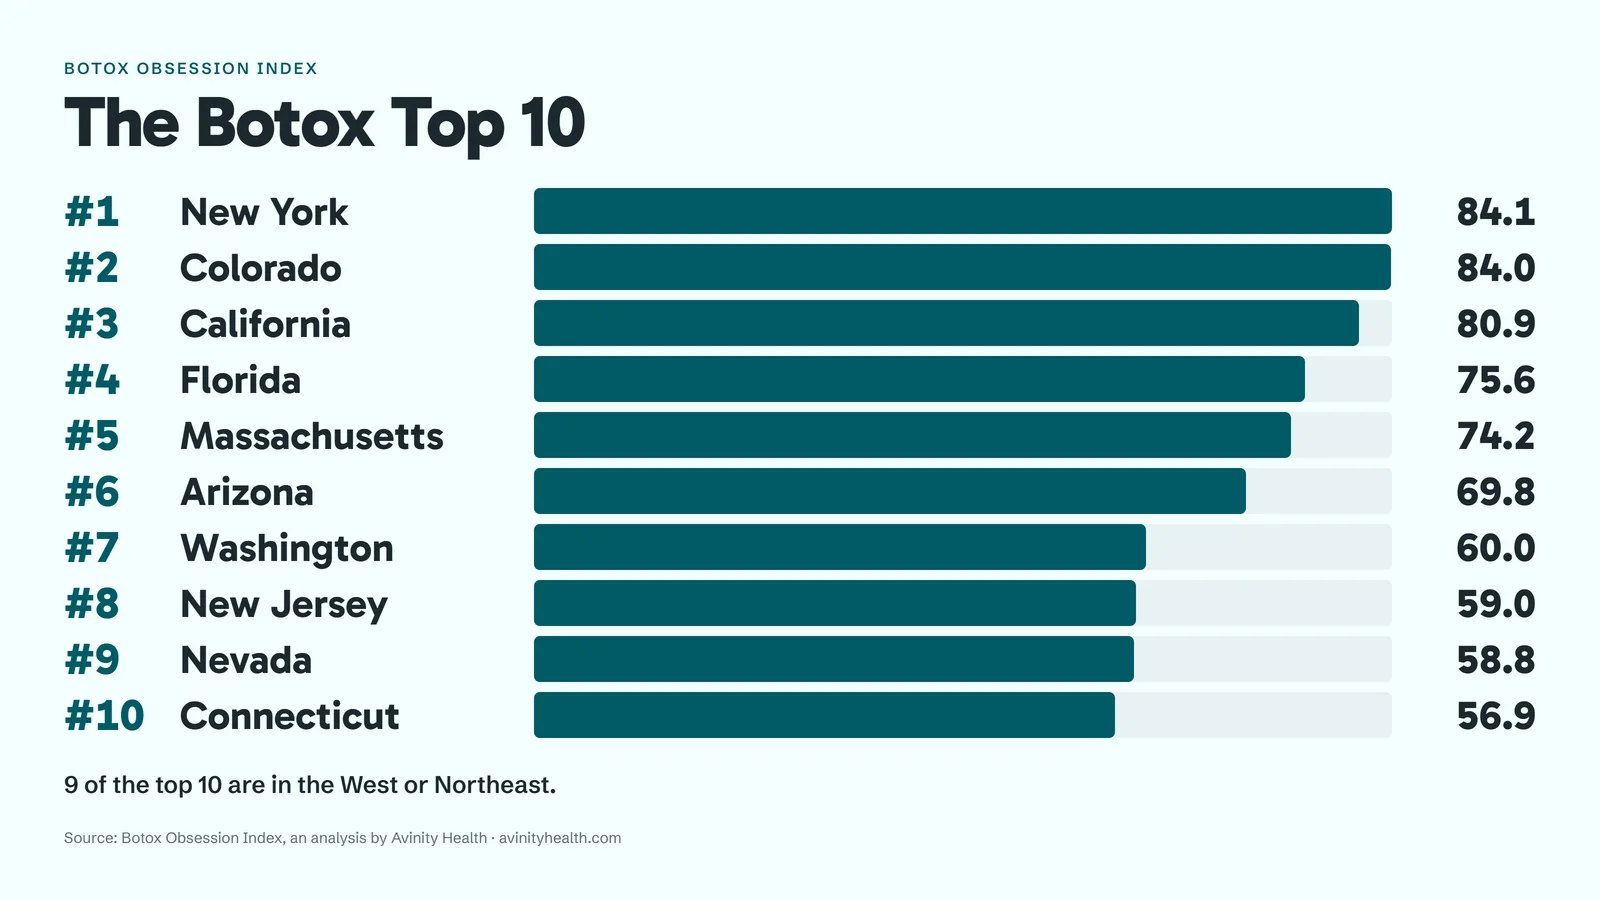
All 50 states, with every component score, are in the CSV, and the Top 10 is also a ready-made graphic in the section below.
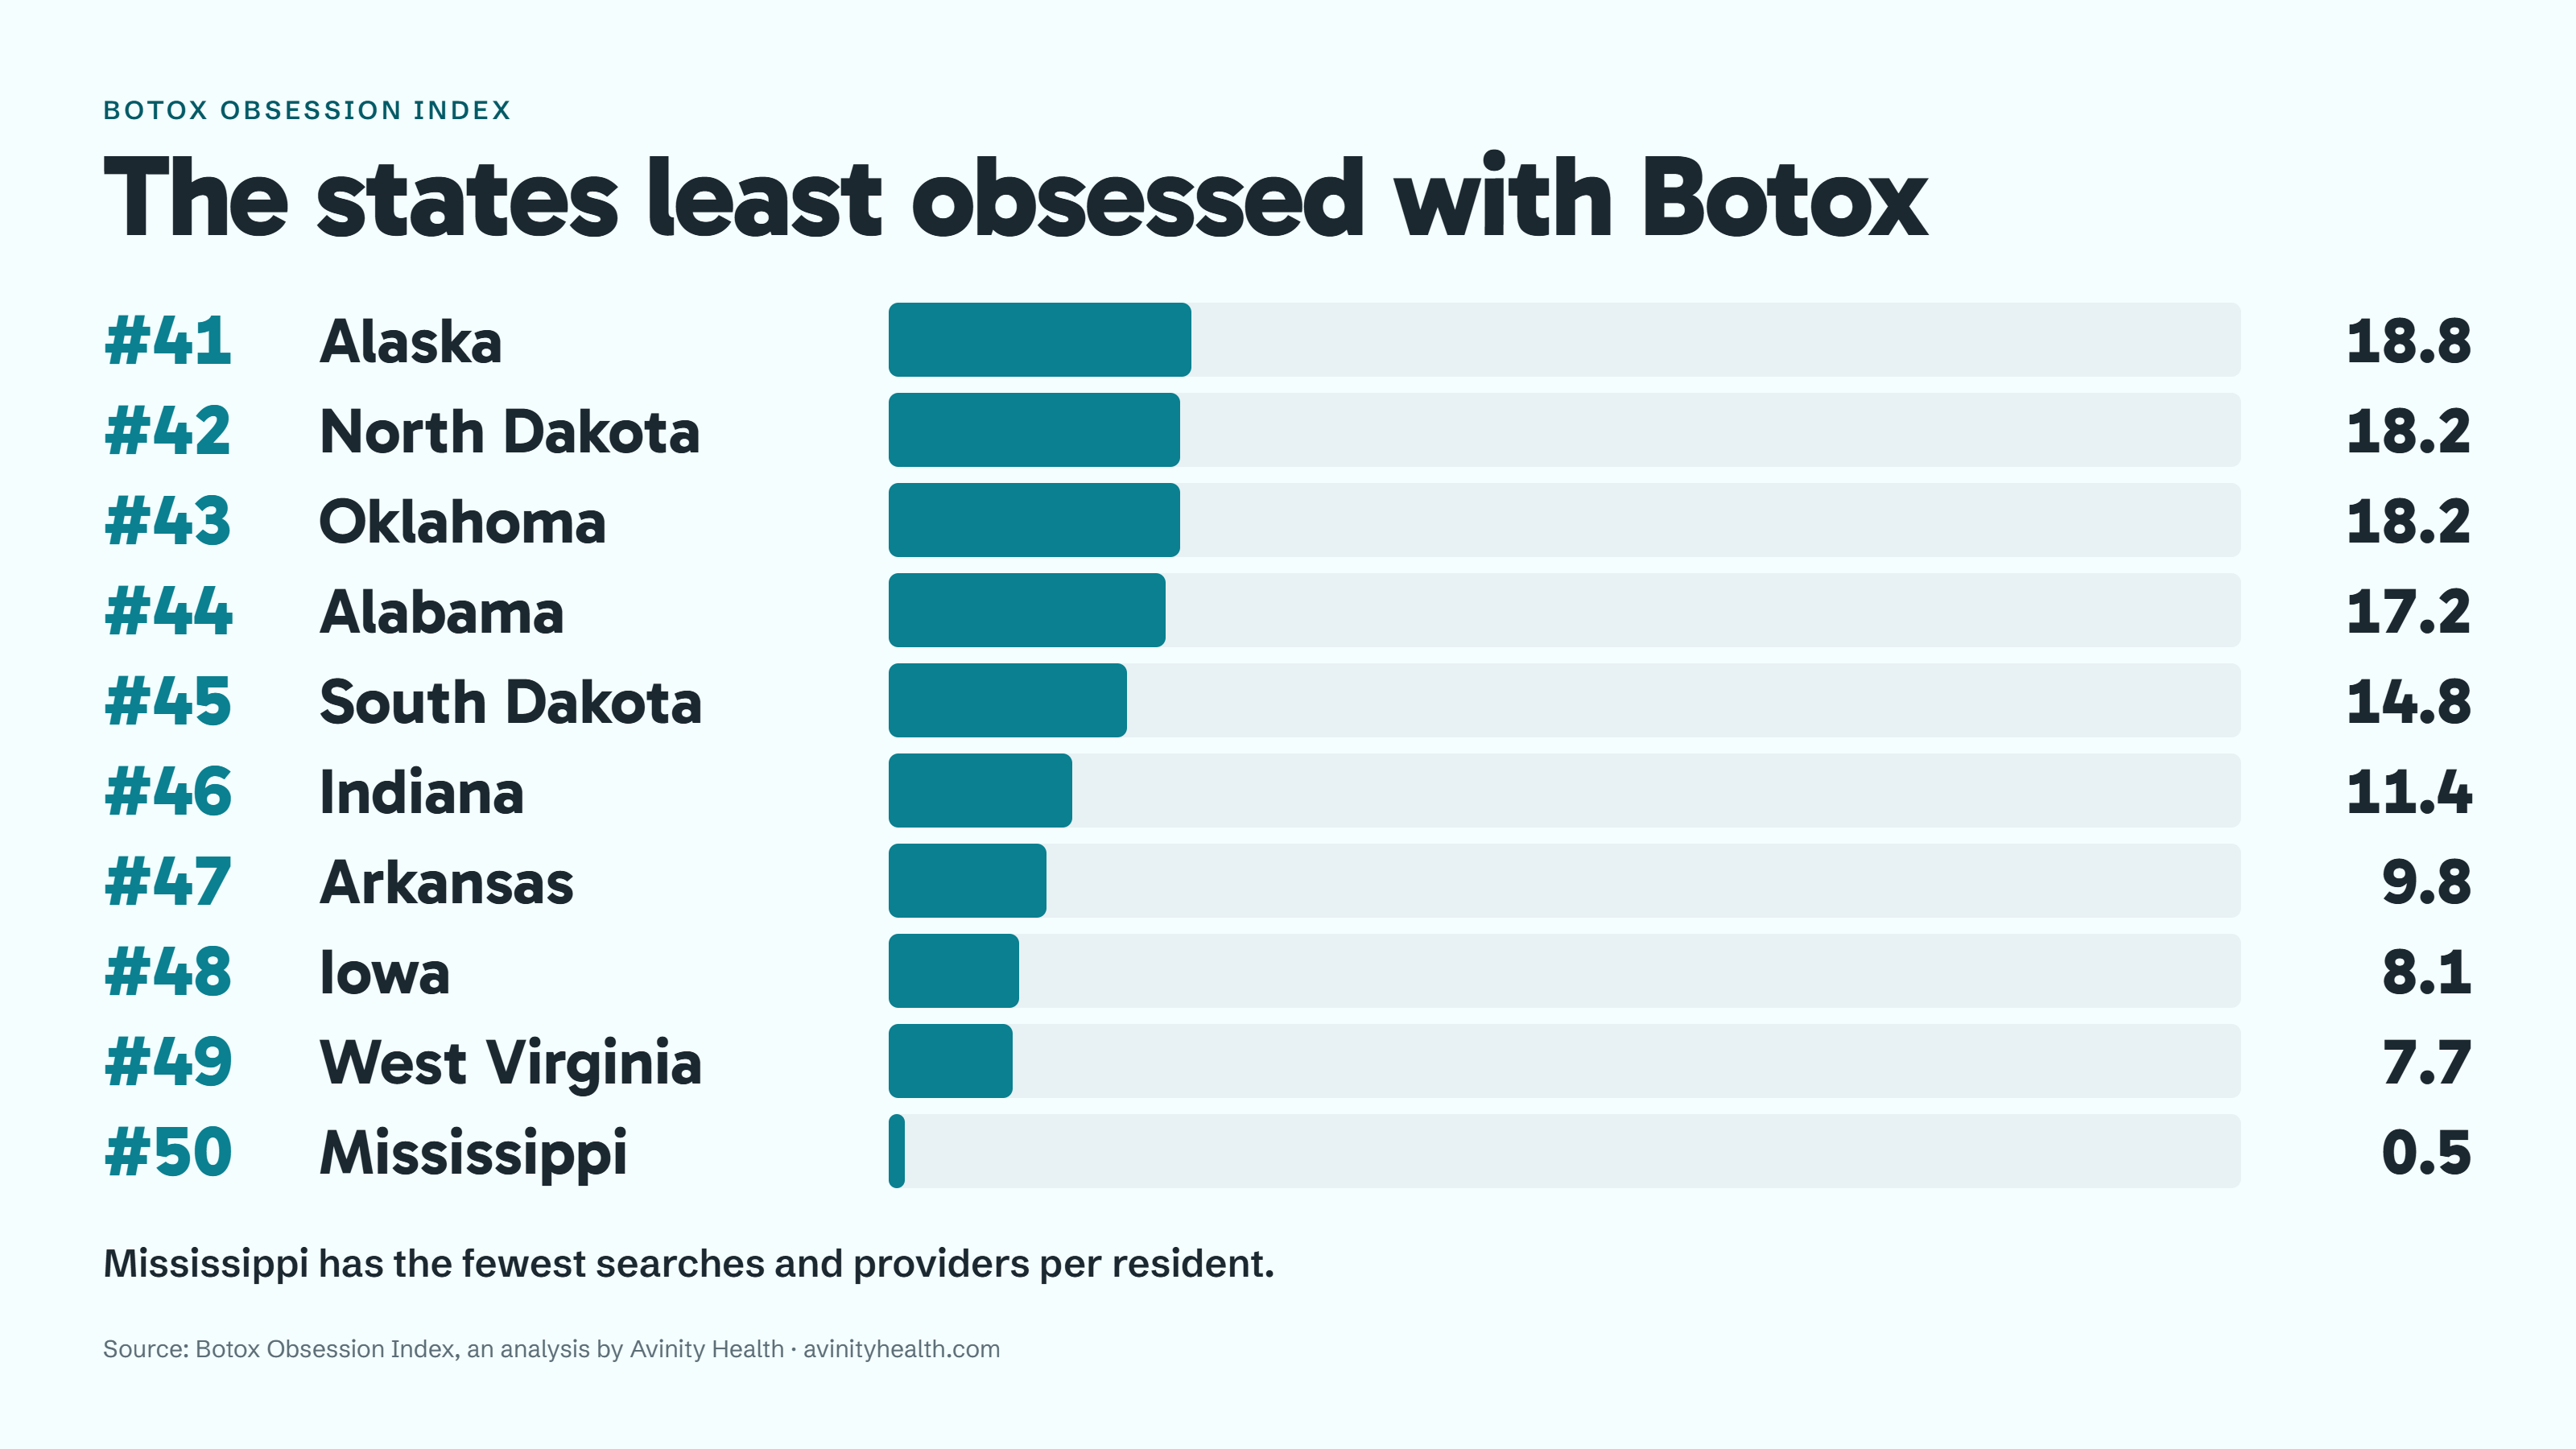
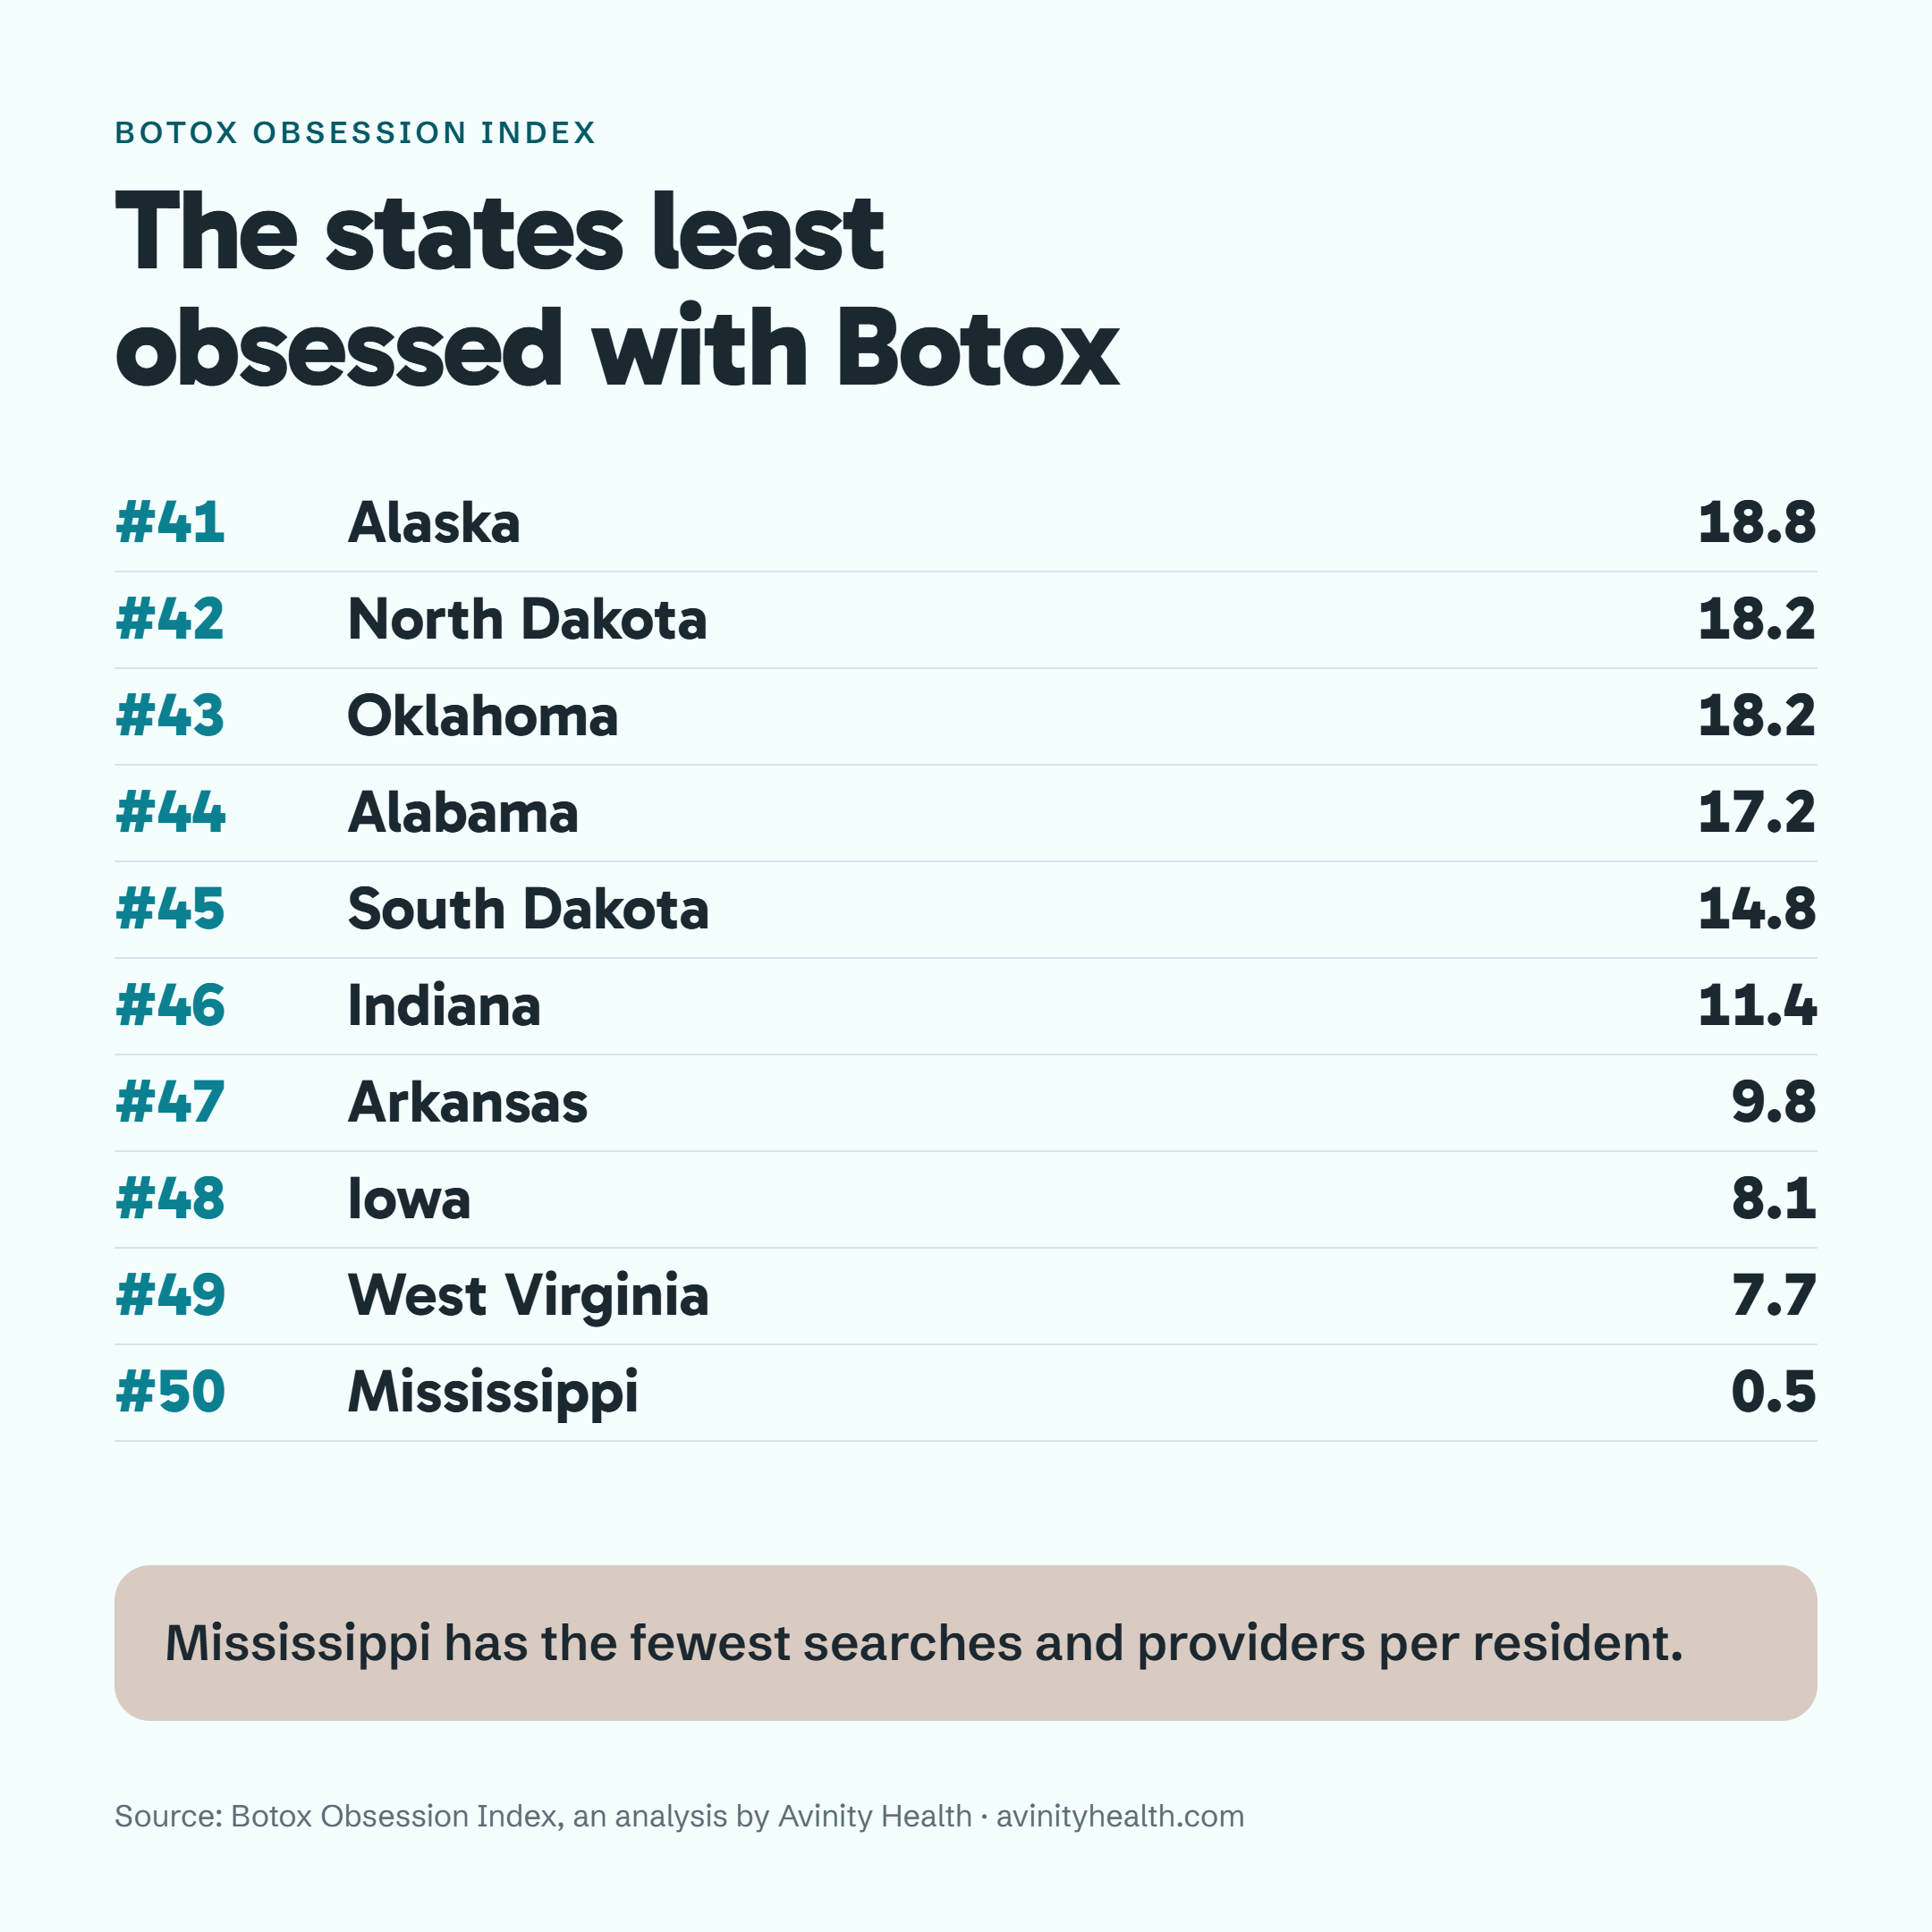
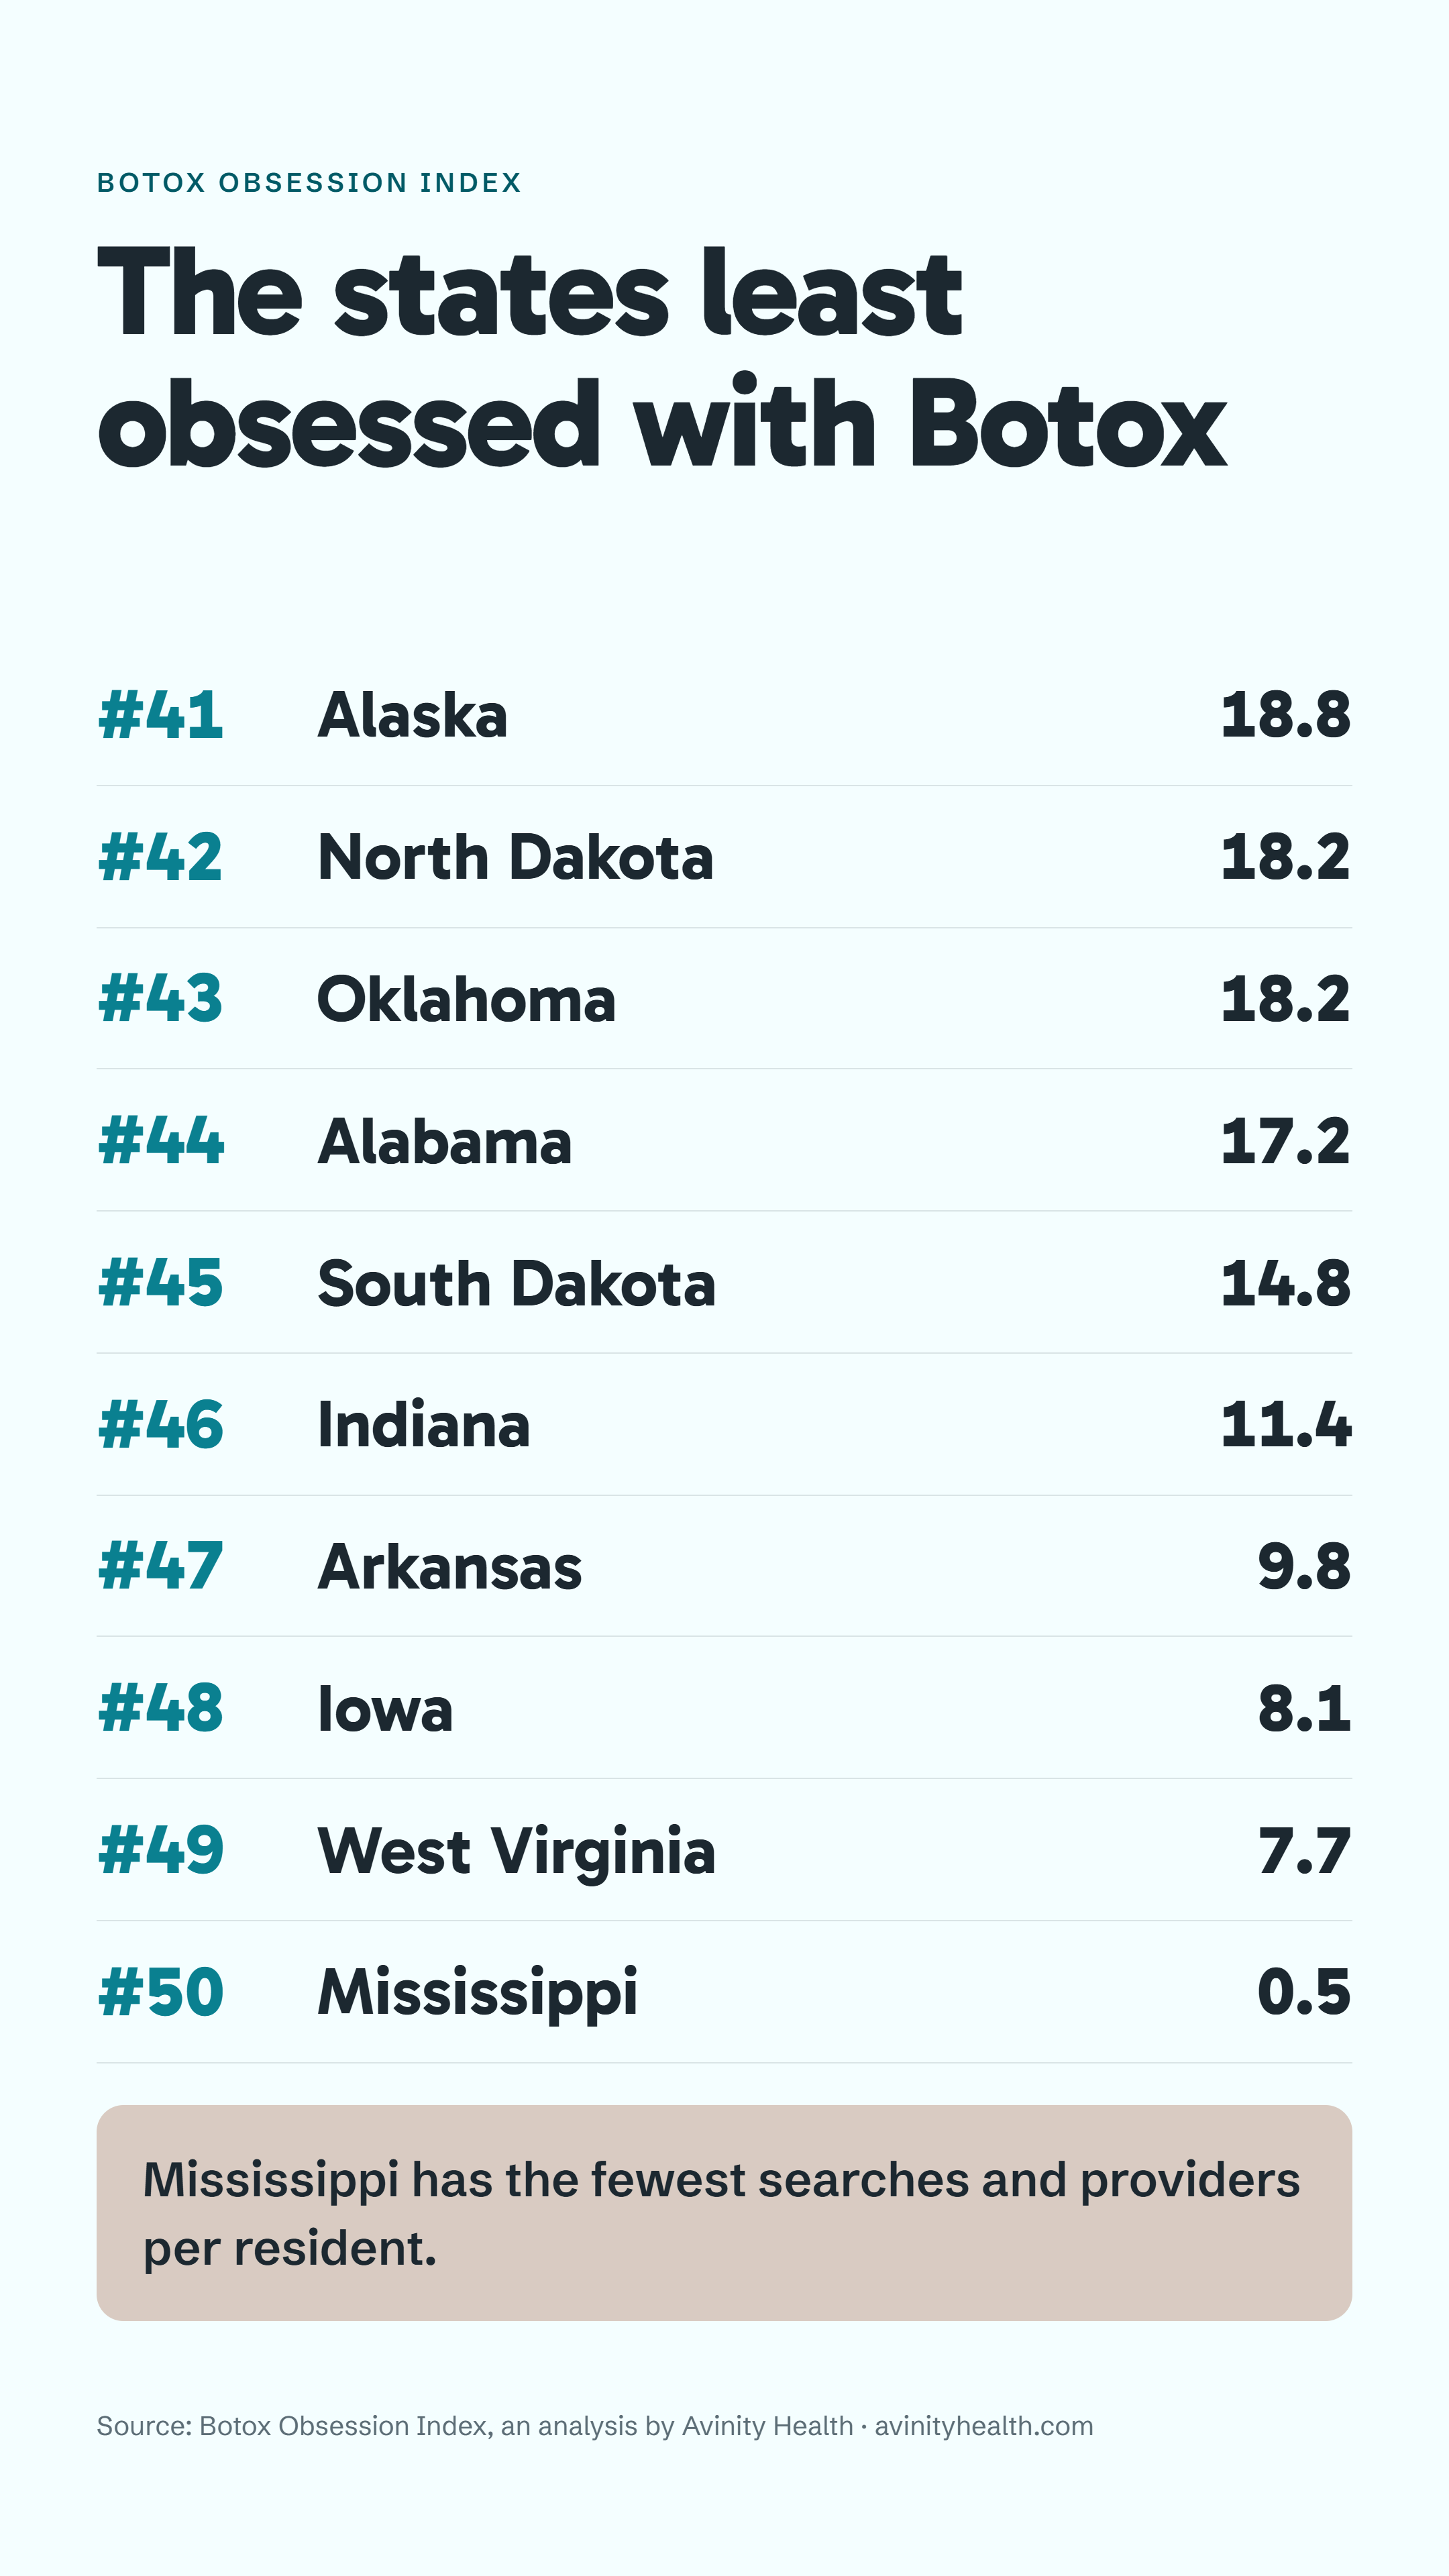
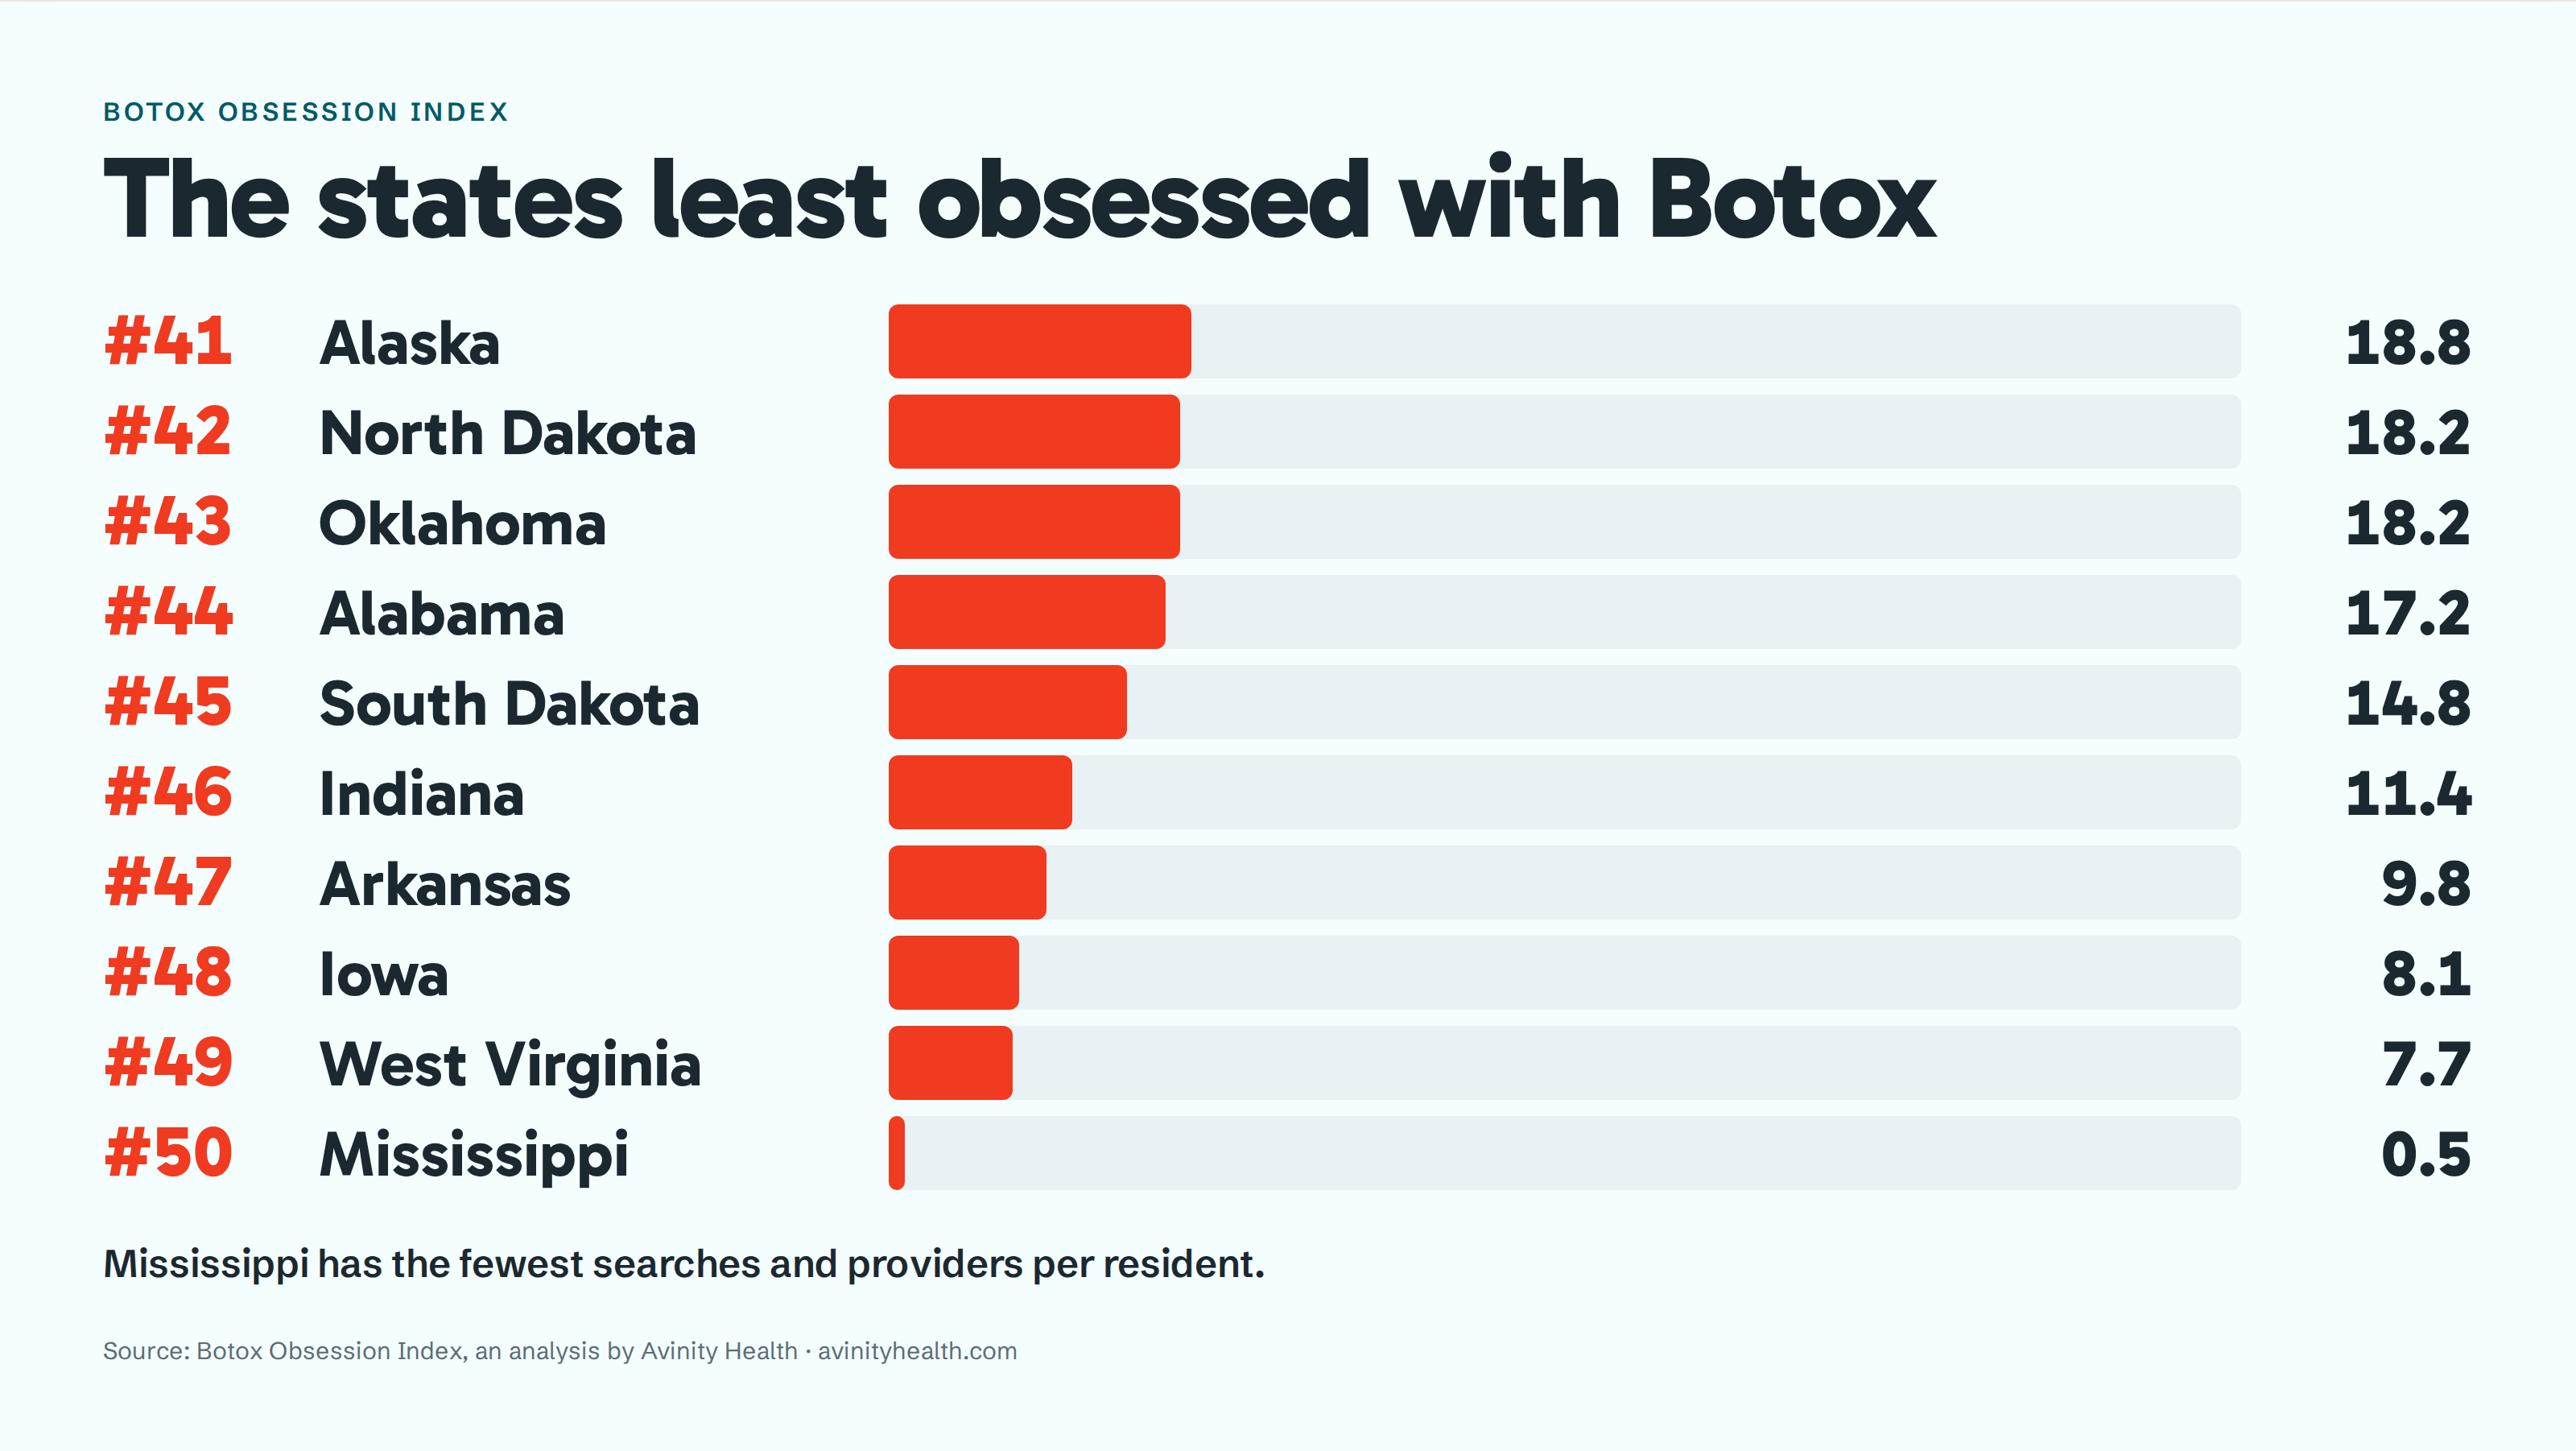
Every graphic carries its source line and is free to republish.
Two color schemes, matching the two embed options below. Each comes three ways: with the six callouts we chose, with no callouts at all, and as an editable SVG.
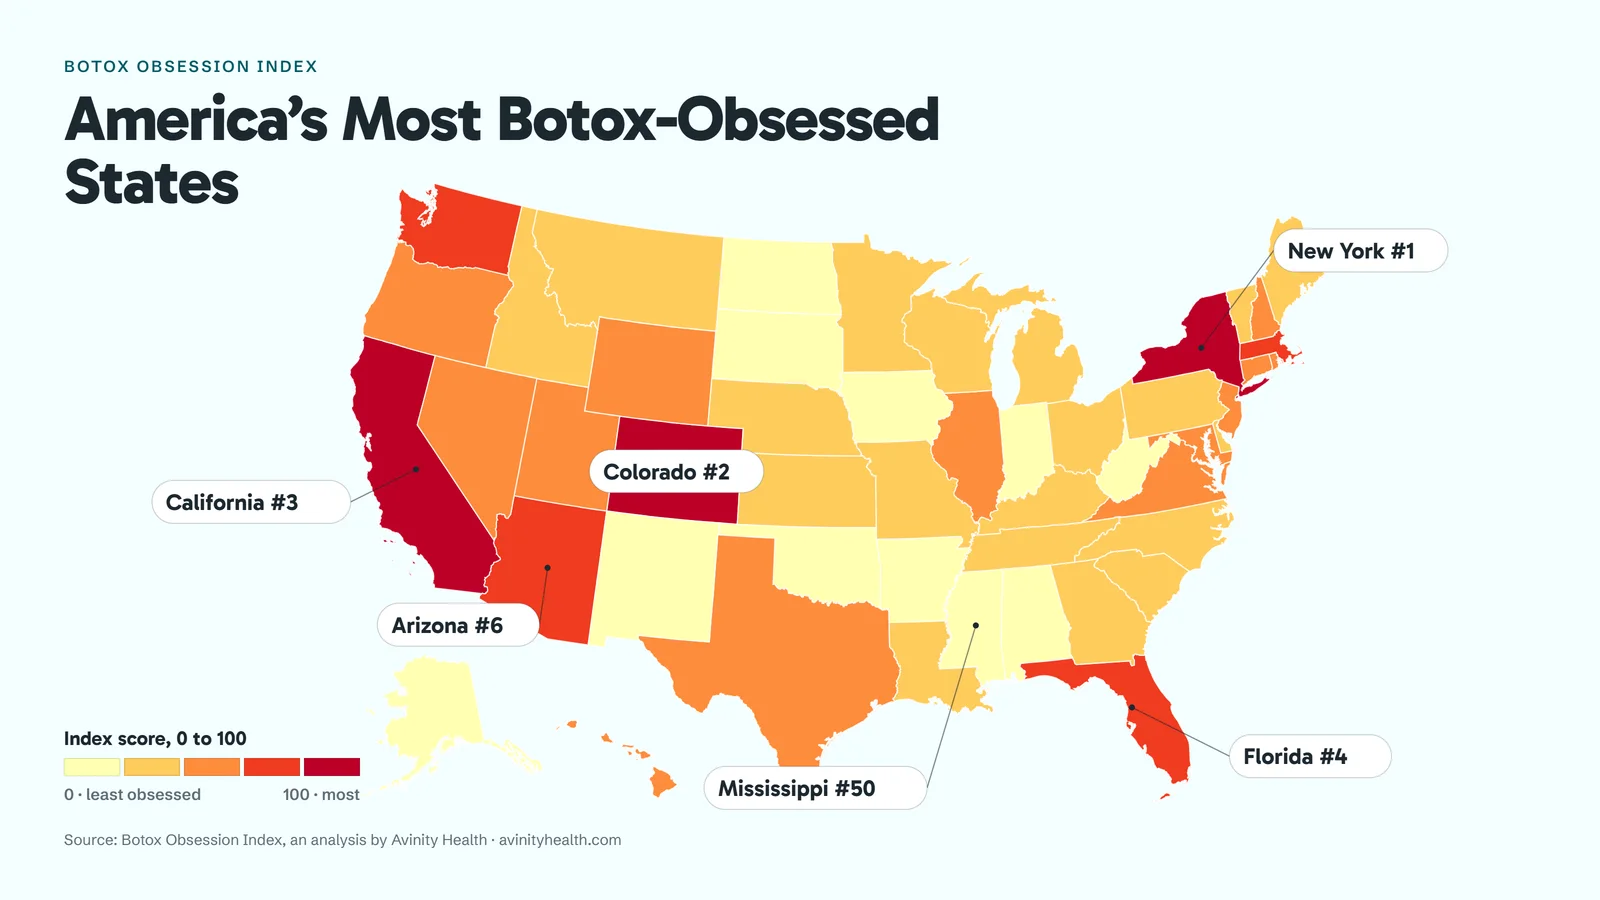
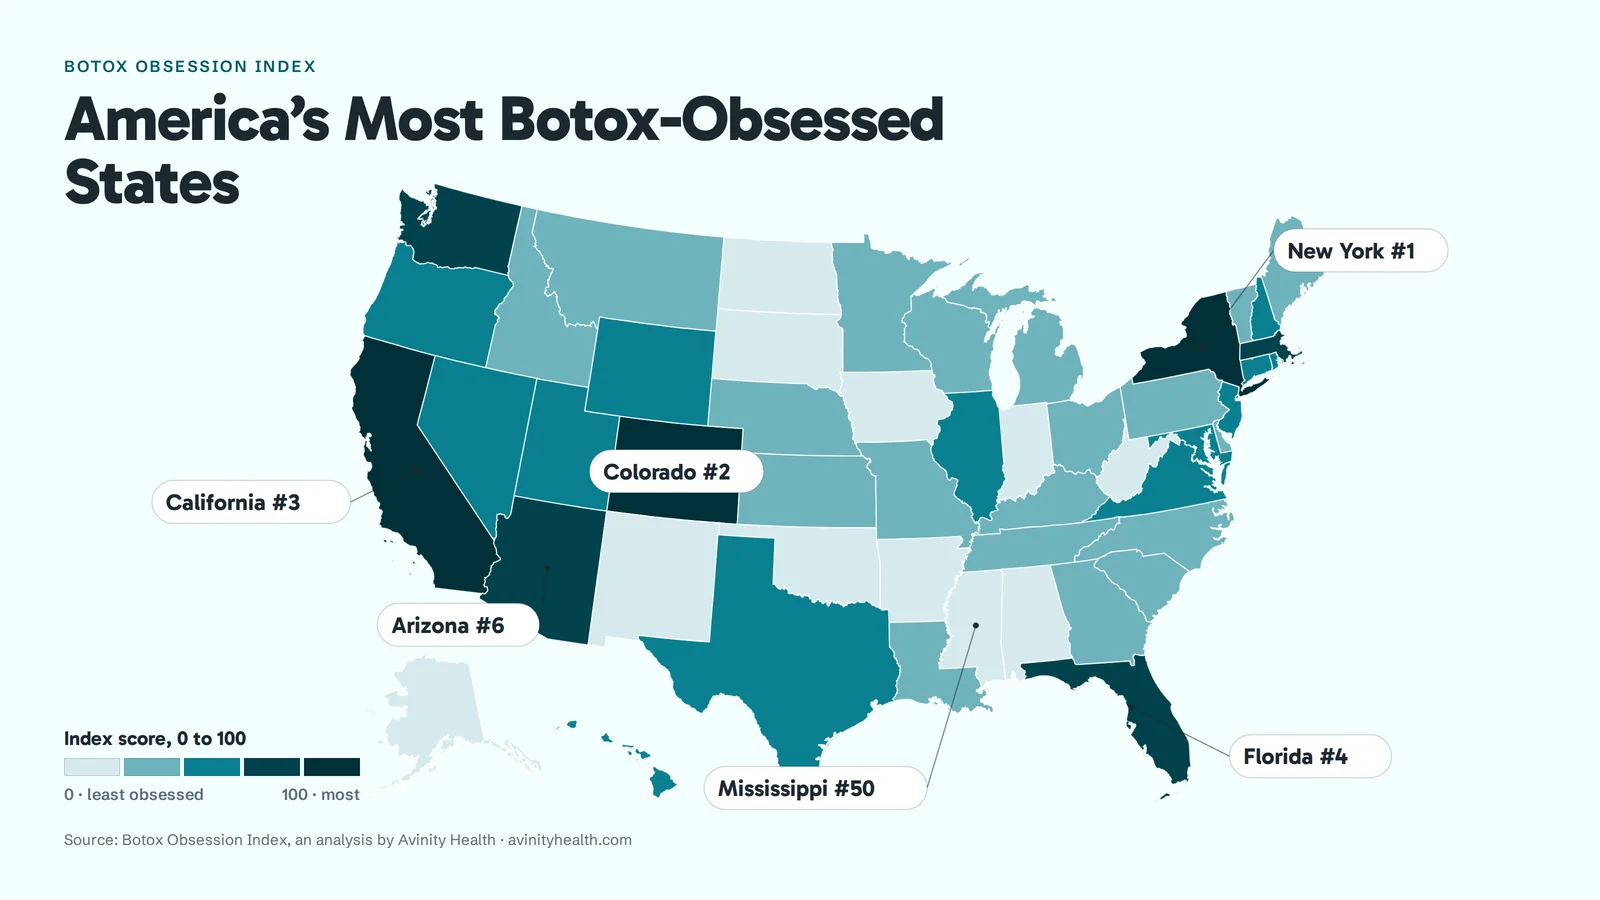
If our six callouts are not the states your story is about, build your own: open the map builder, click the states you want, drag each label where it reads best, pick either color scheme, and export as SVG or PNG with the source line already on it.
Prefer to work in your own tools? Take the version with no callouts and annotate it, or open the SVG, where every state is a named path carrying its own rank and index score.
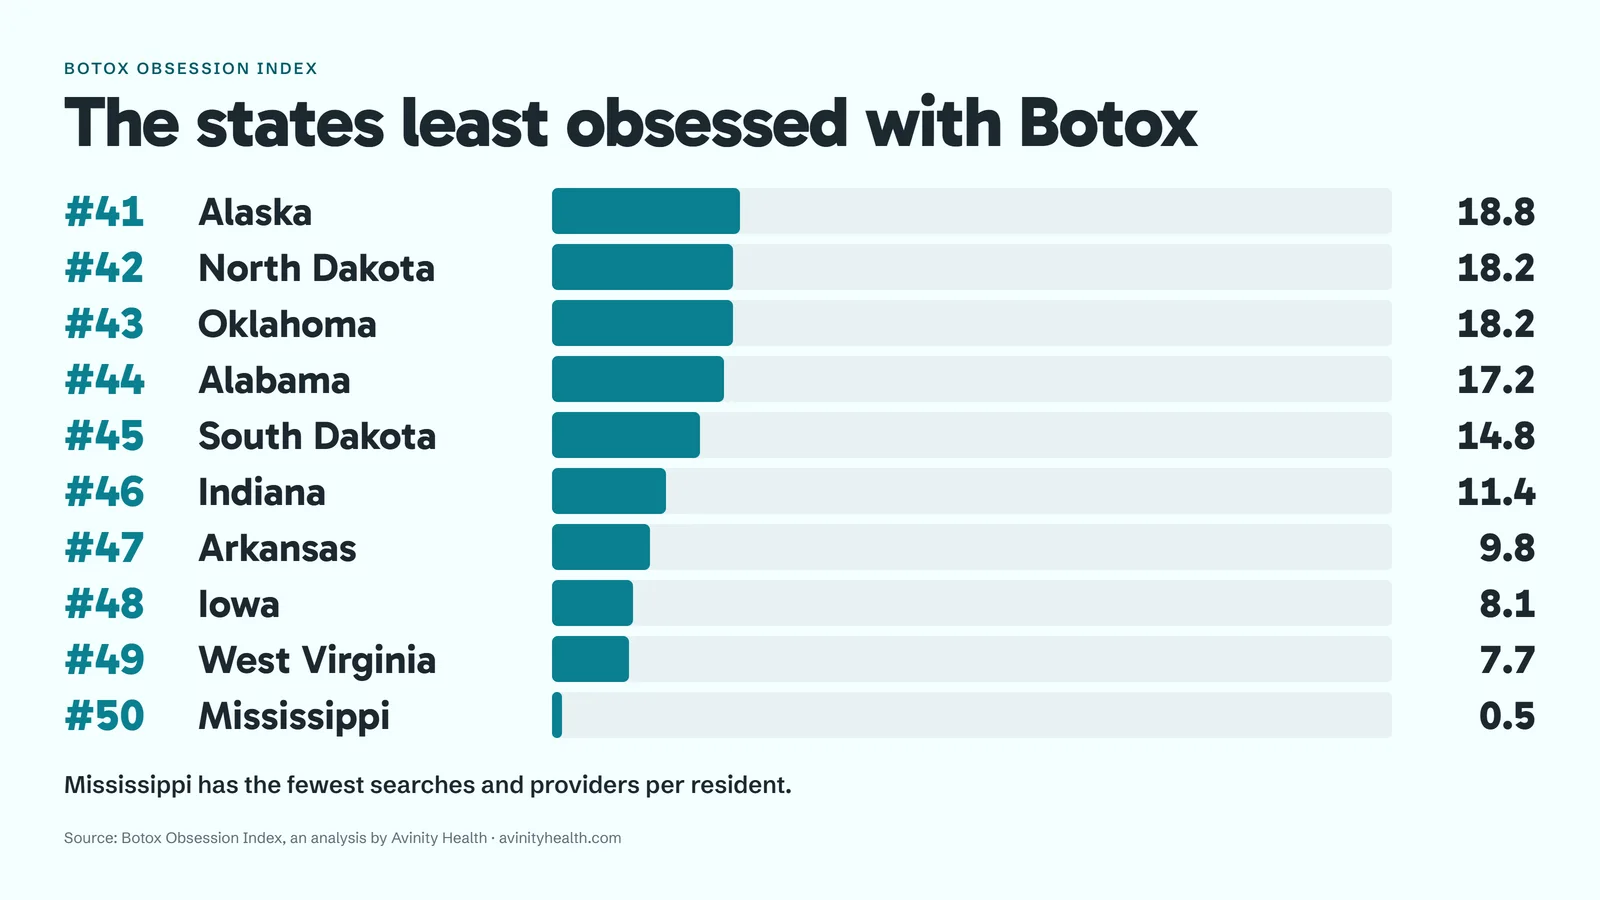
Both come in the same two color schemes as the map, so a ranked bar and the national map can run together without clashing. Shown here in the original; the news versions use the same red ramp as the news map.
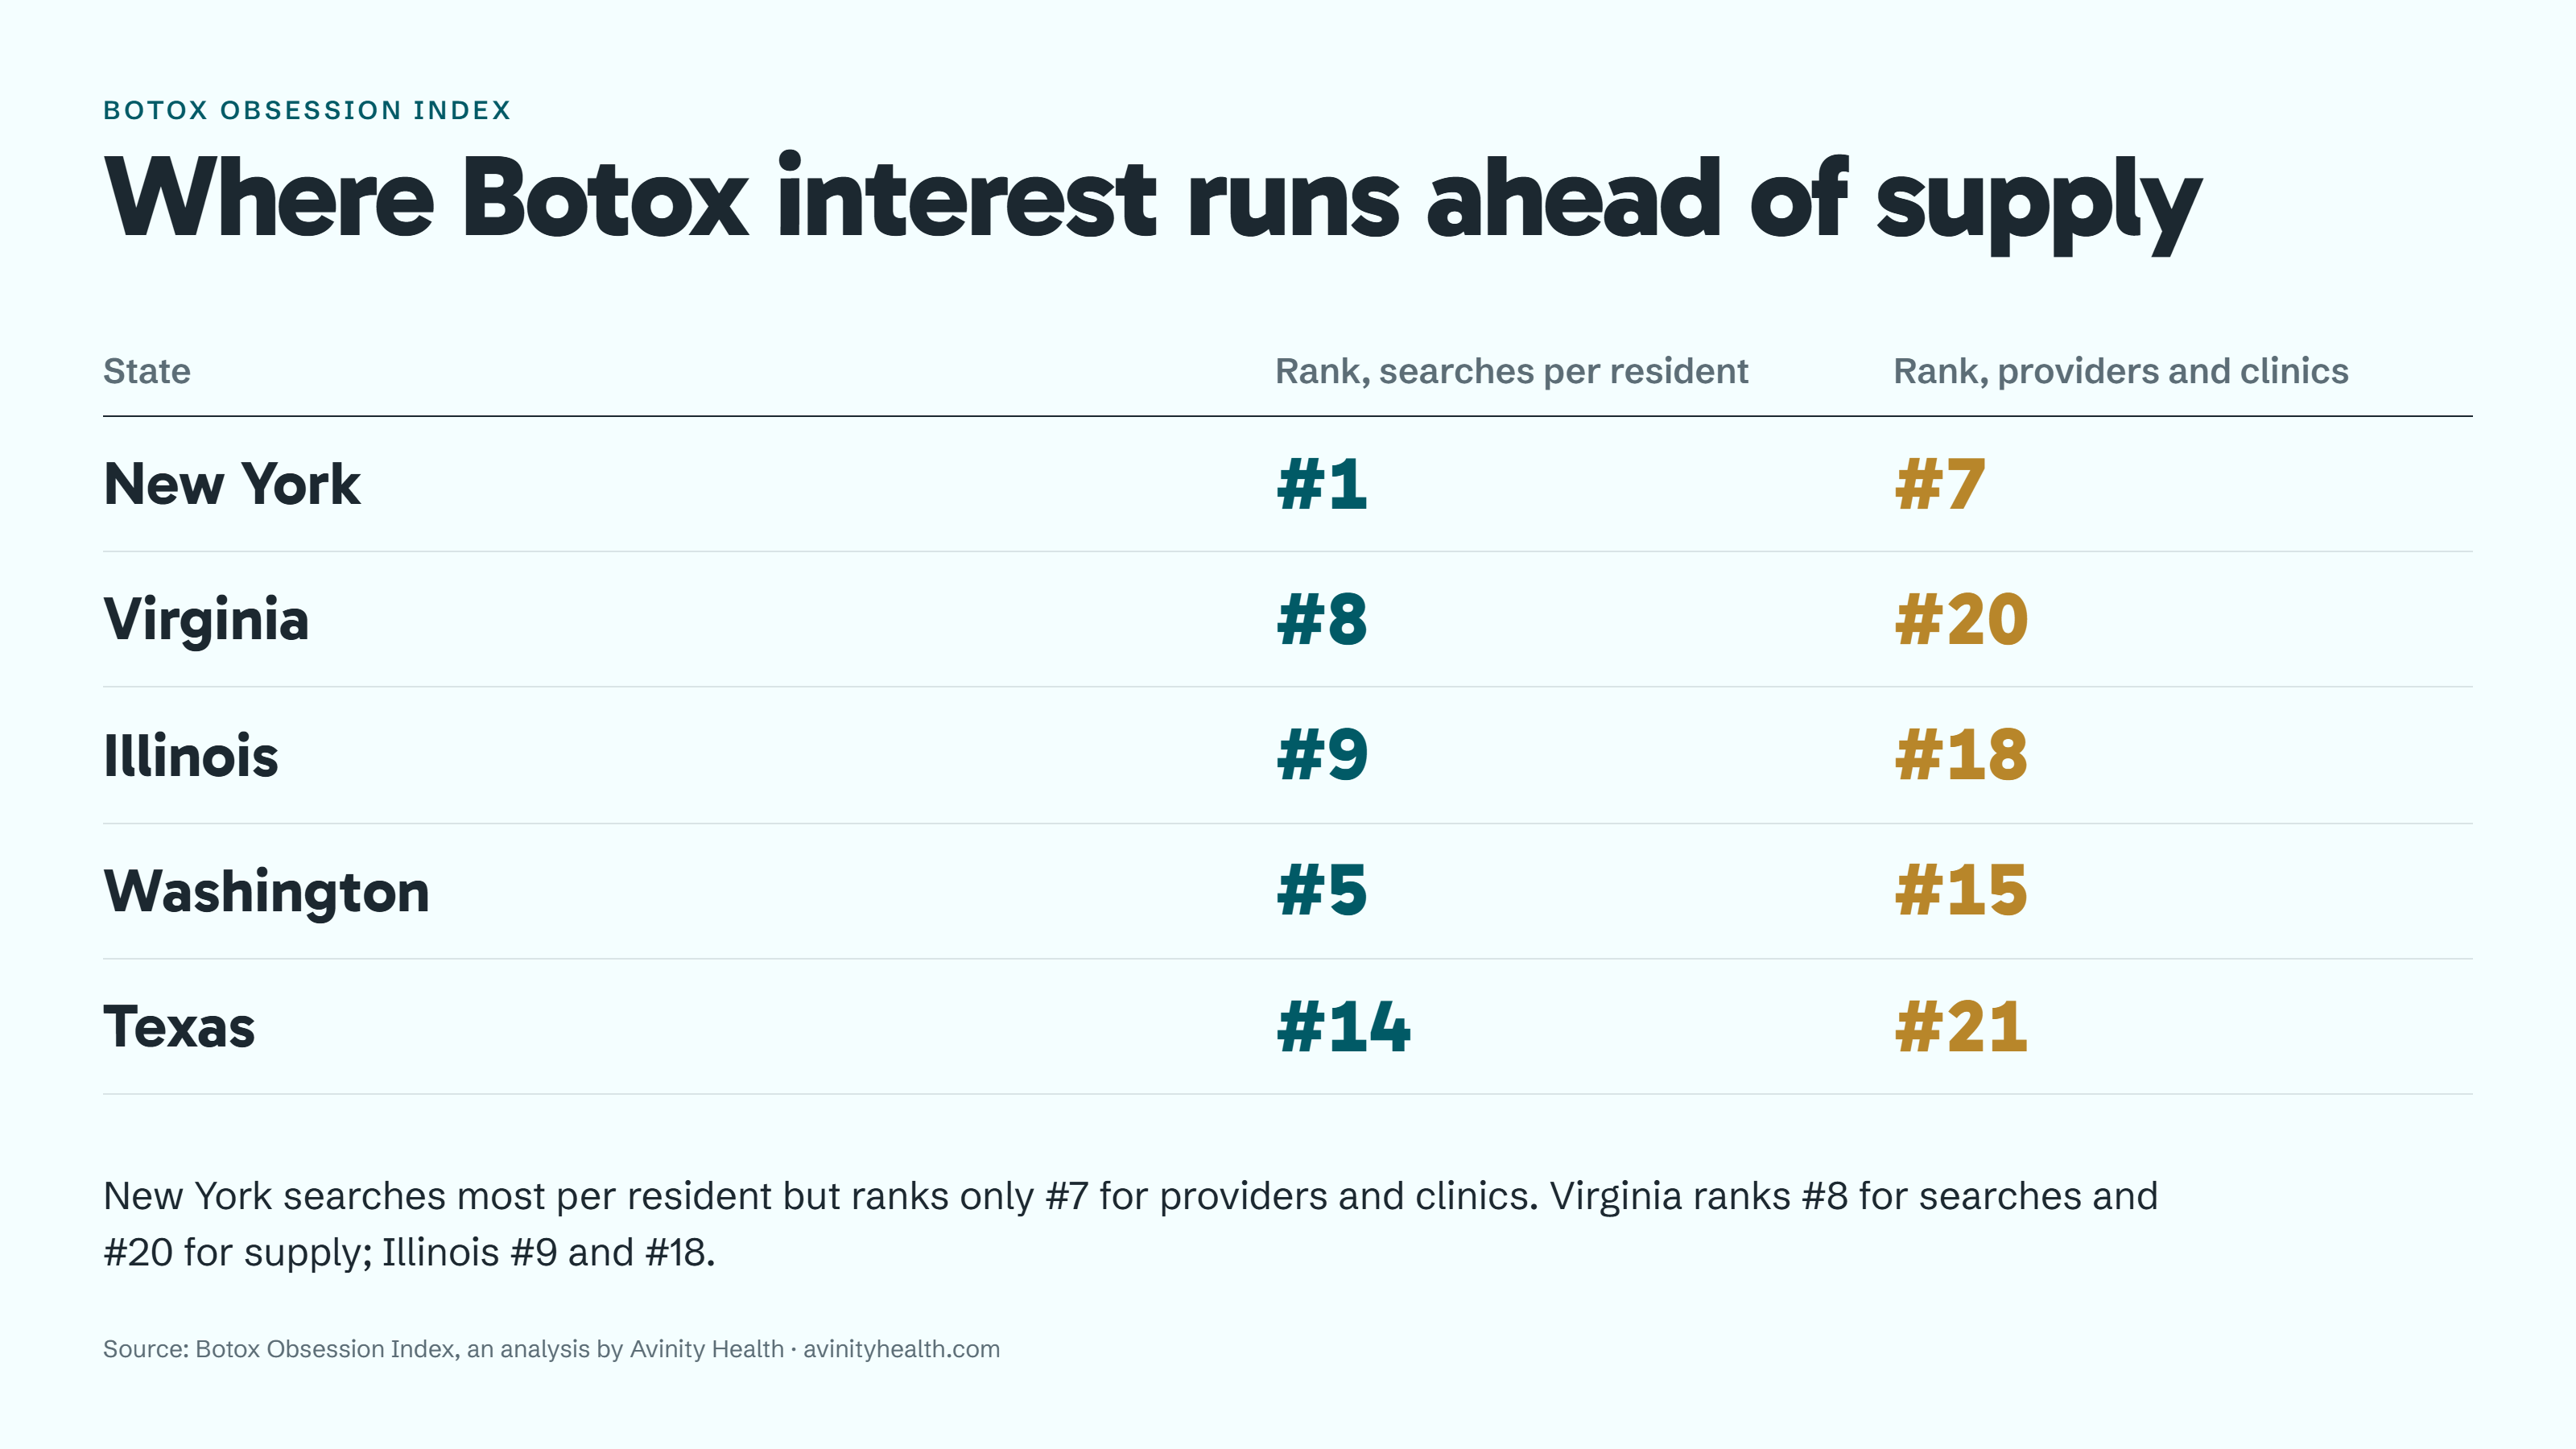
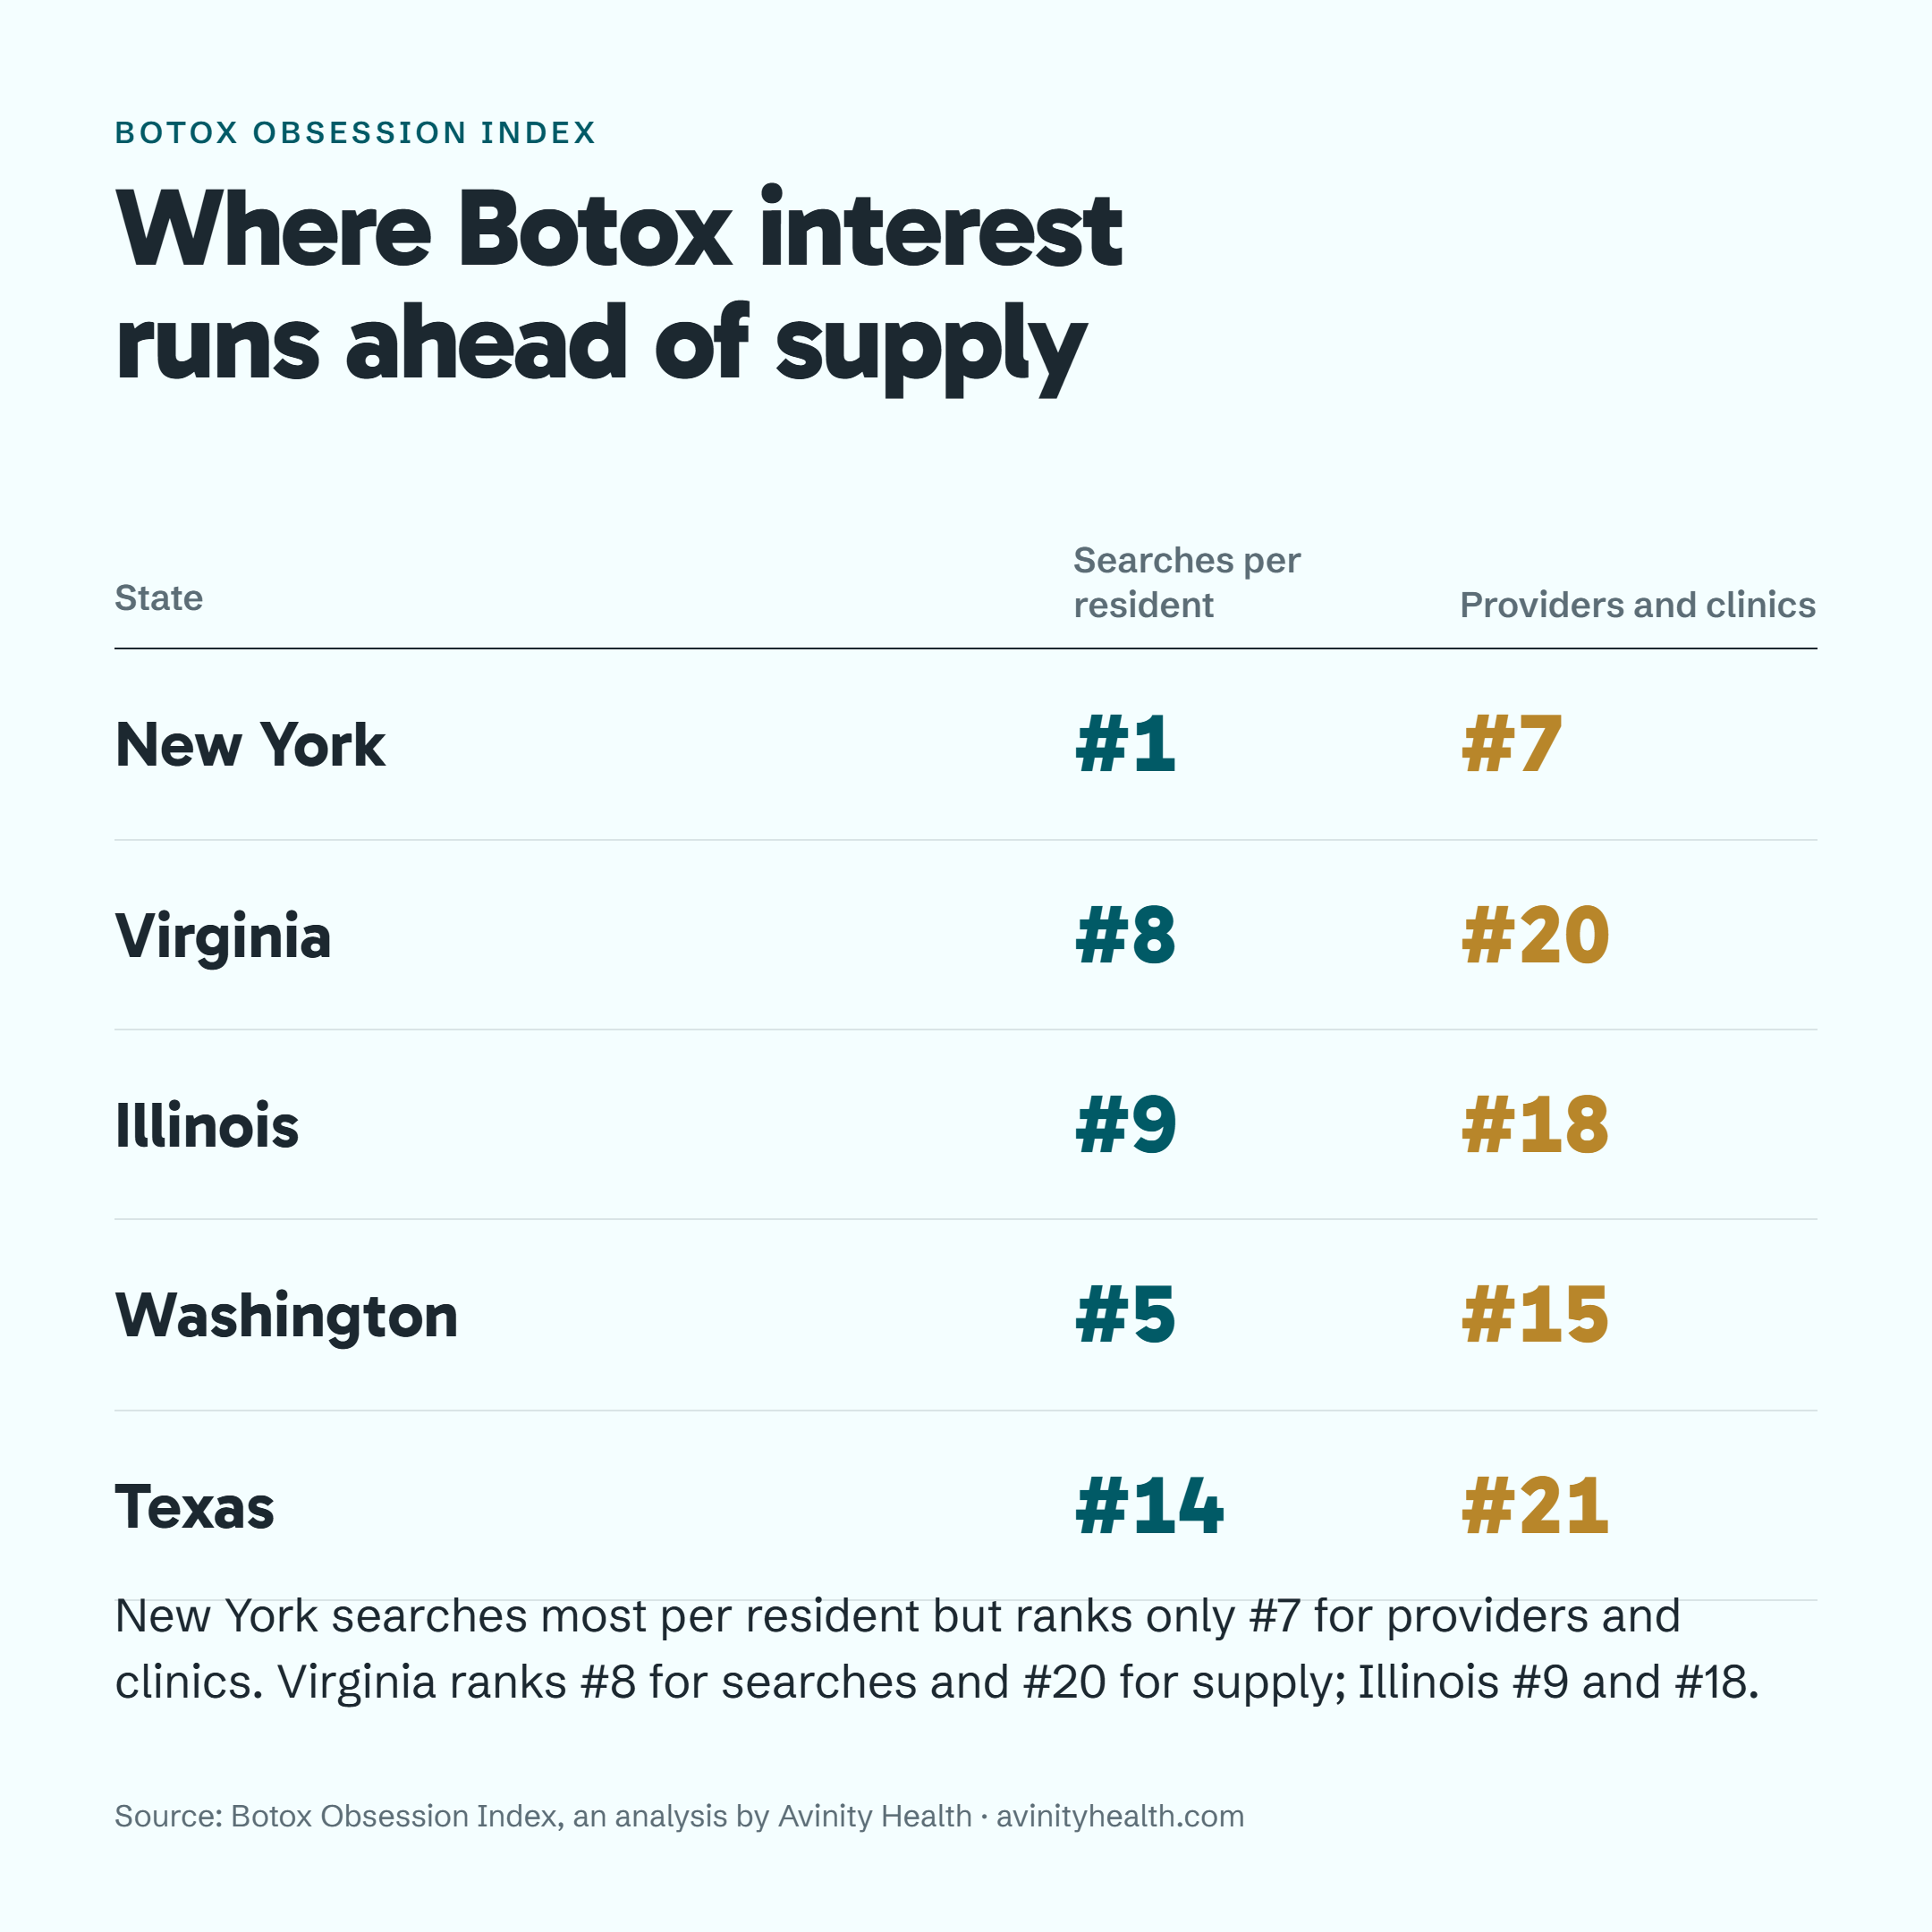
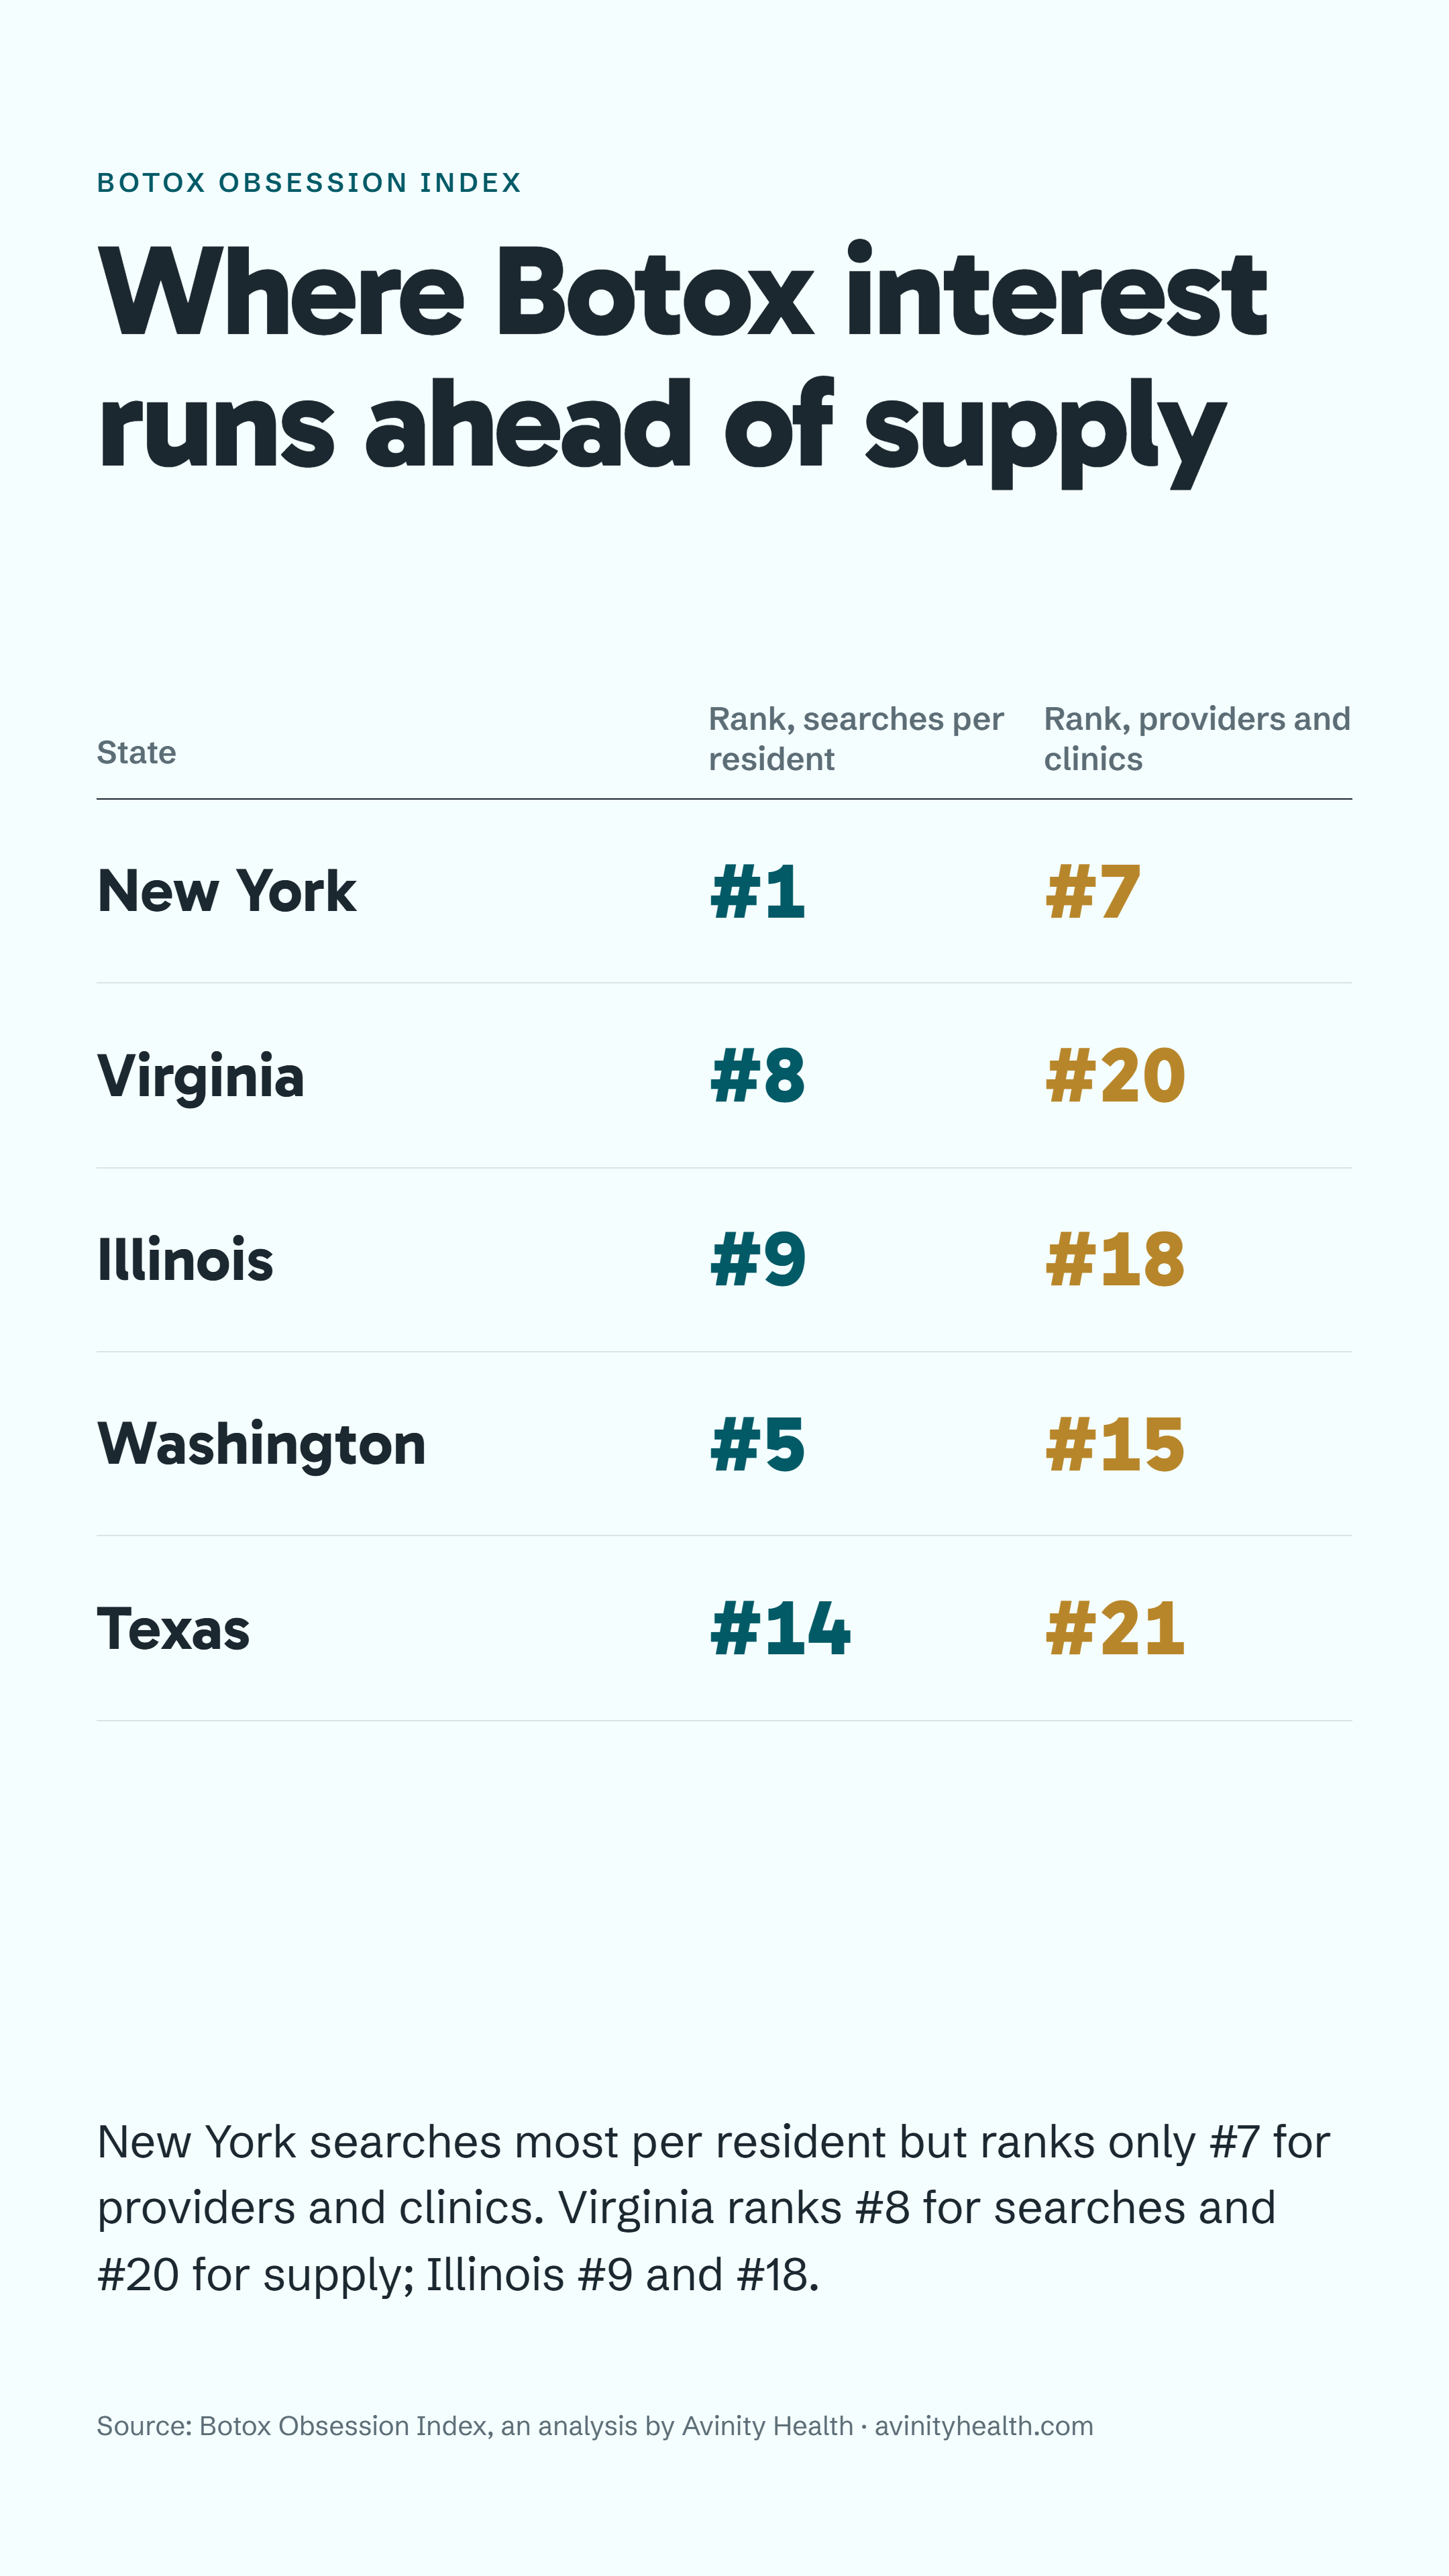
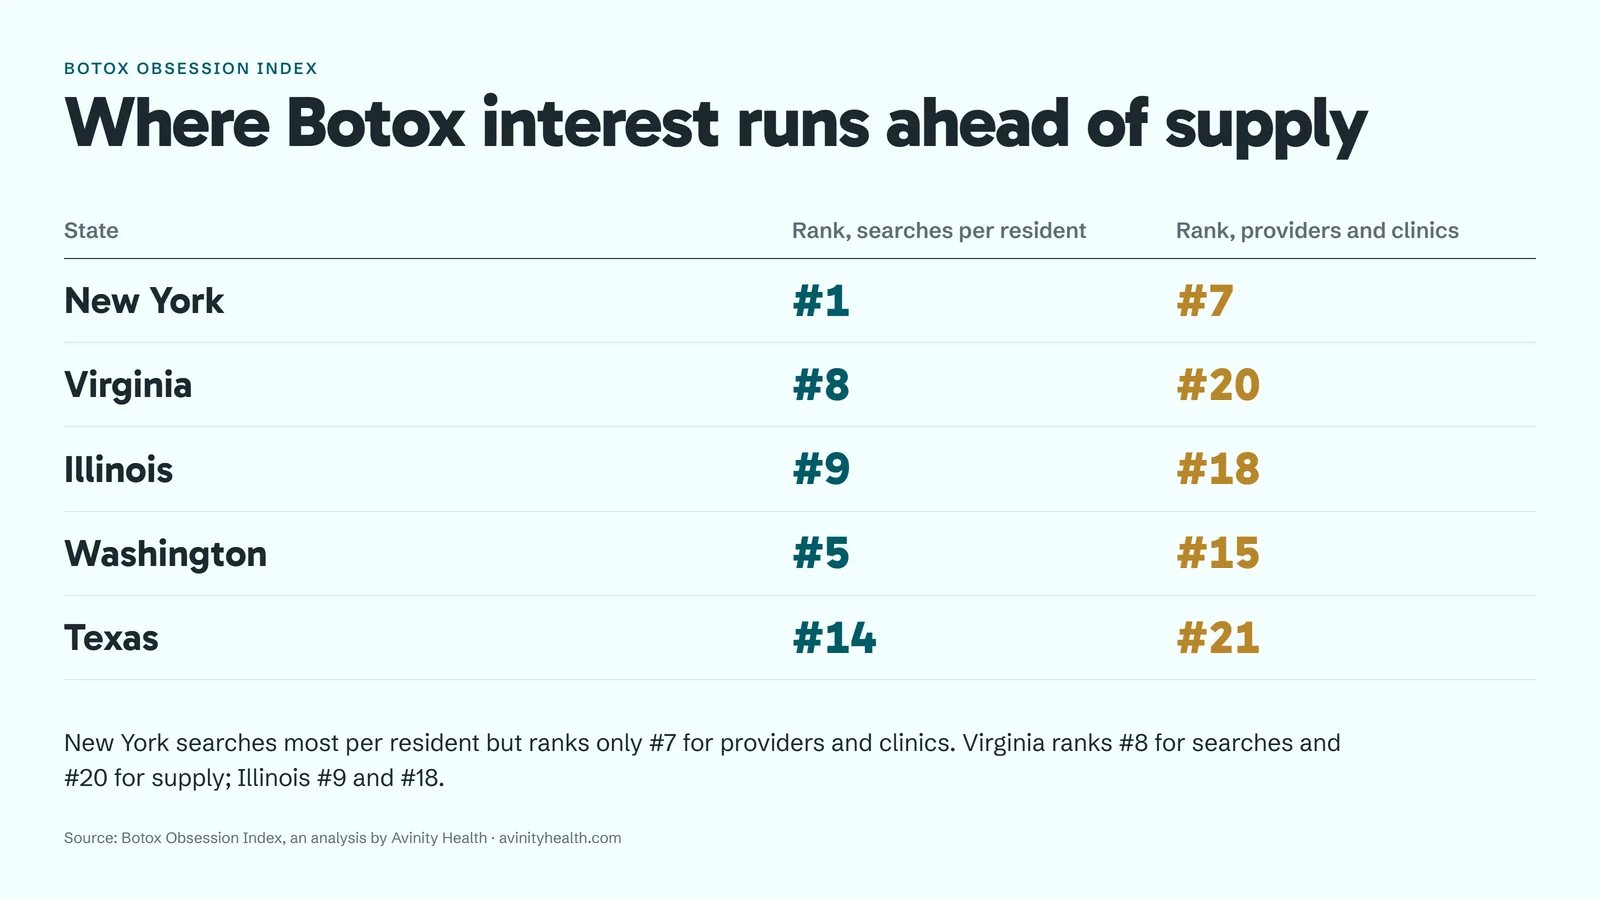
The states where search interest runs furthest ahead of the local provider and clinic market, set out as each state's rank on one measure against its rank on the other.
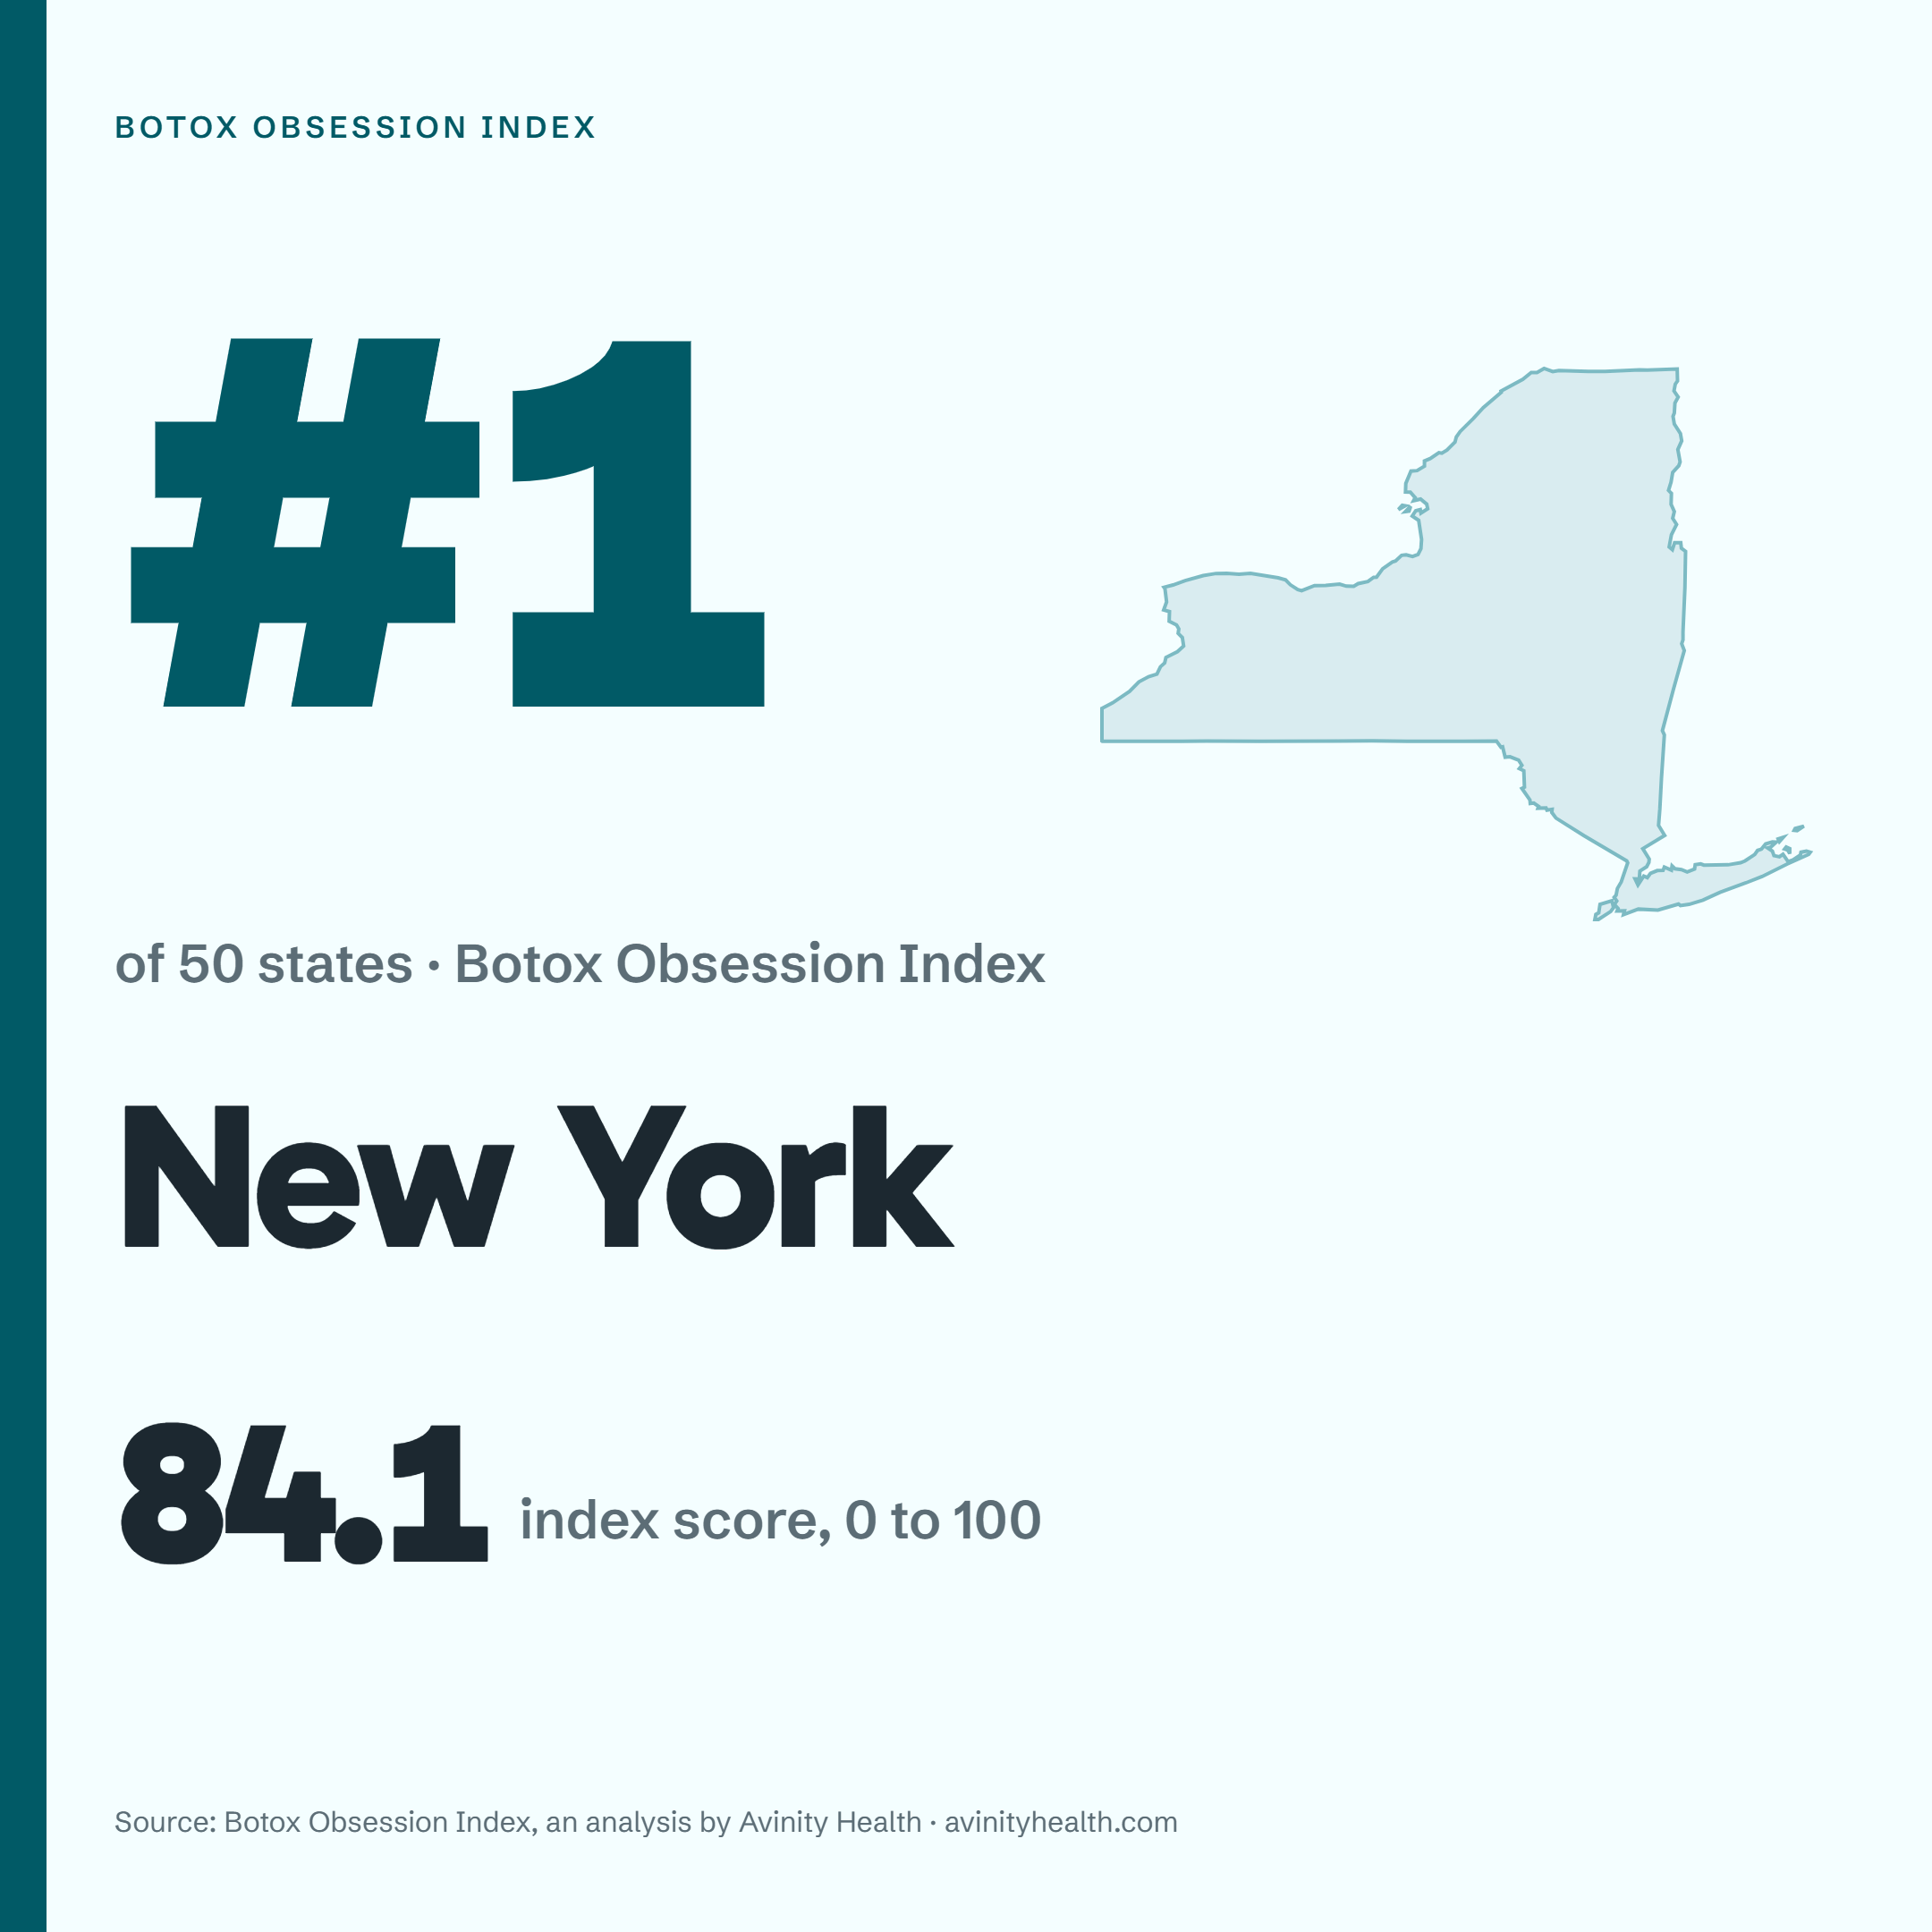
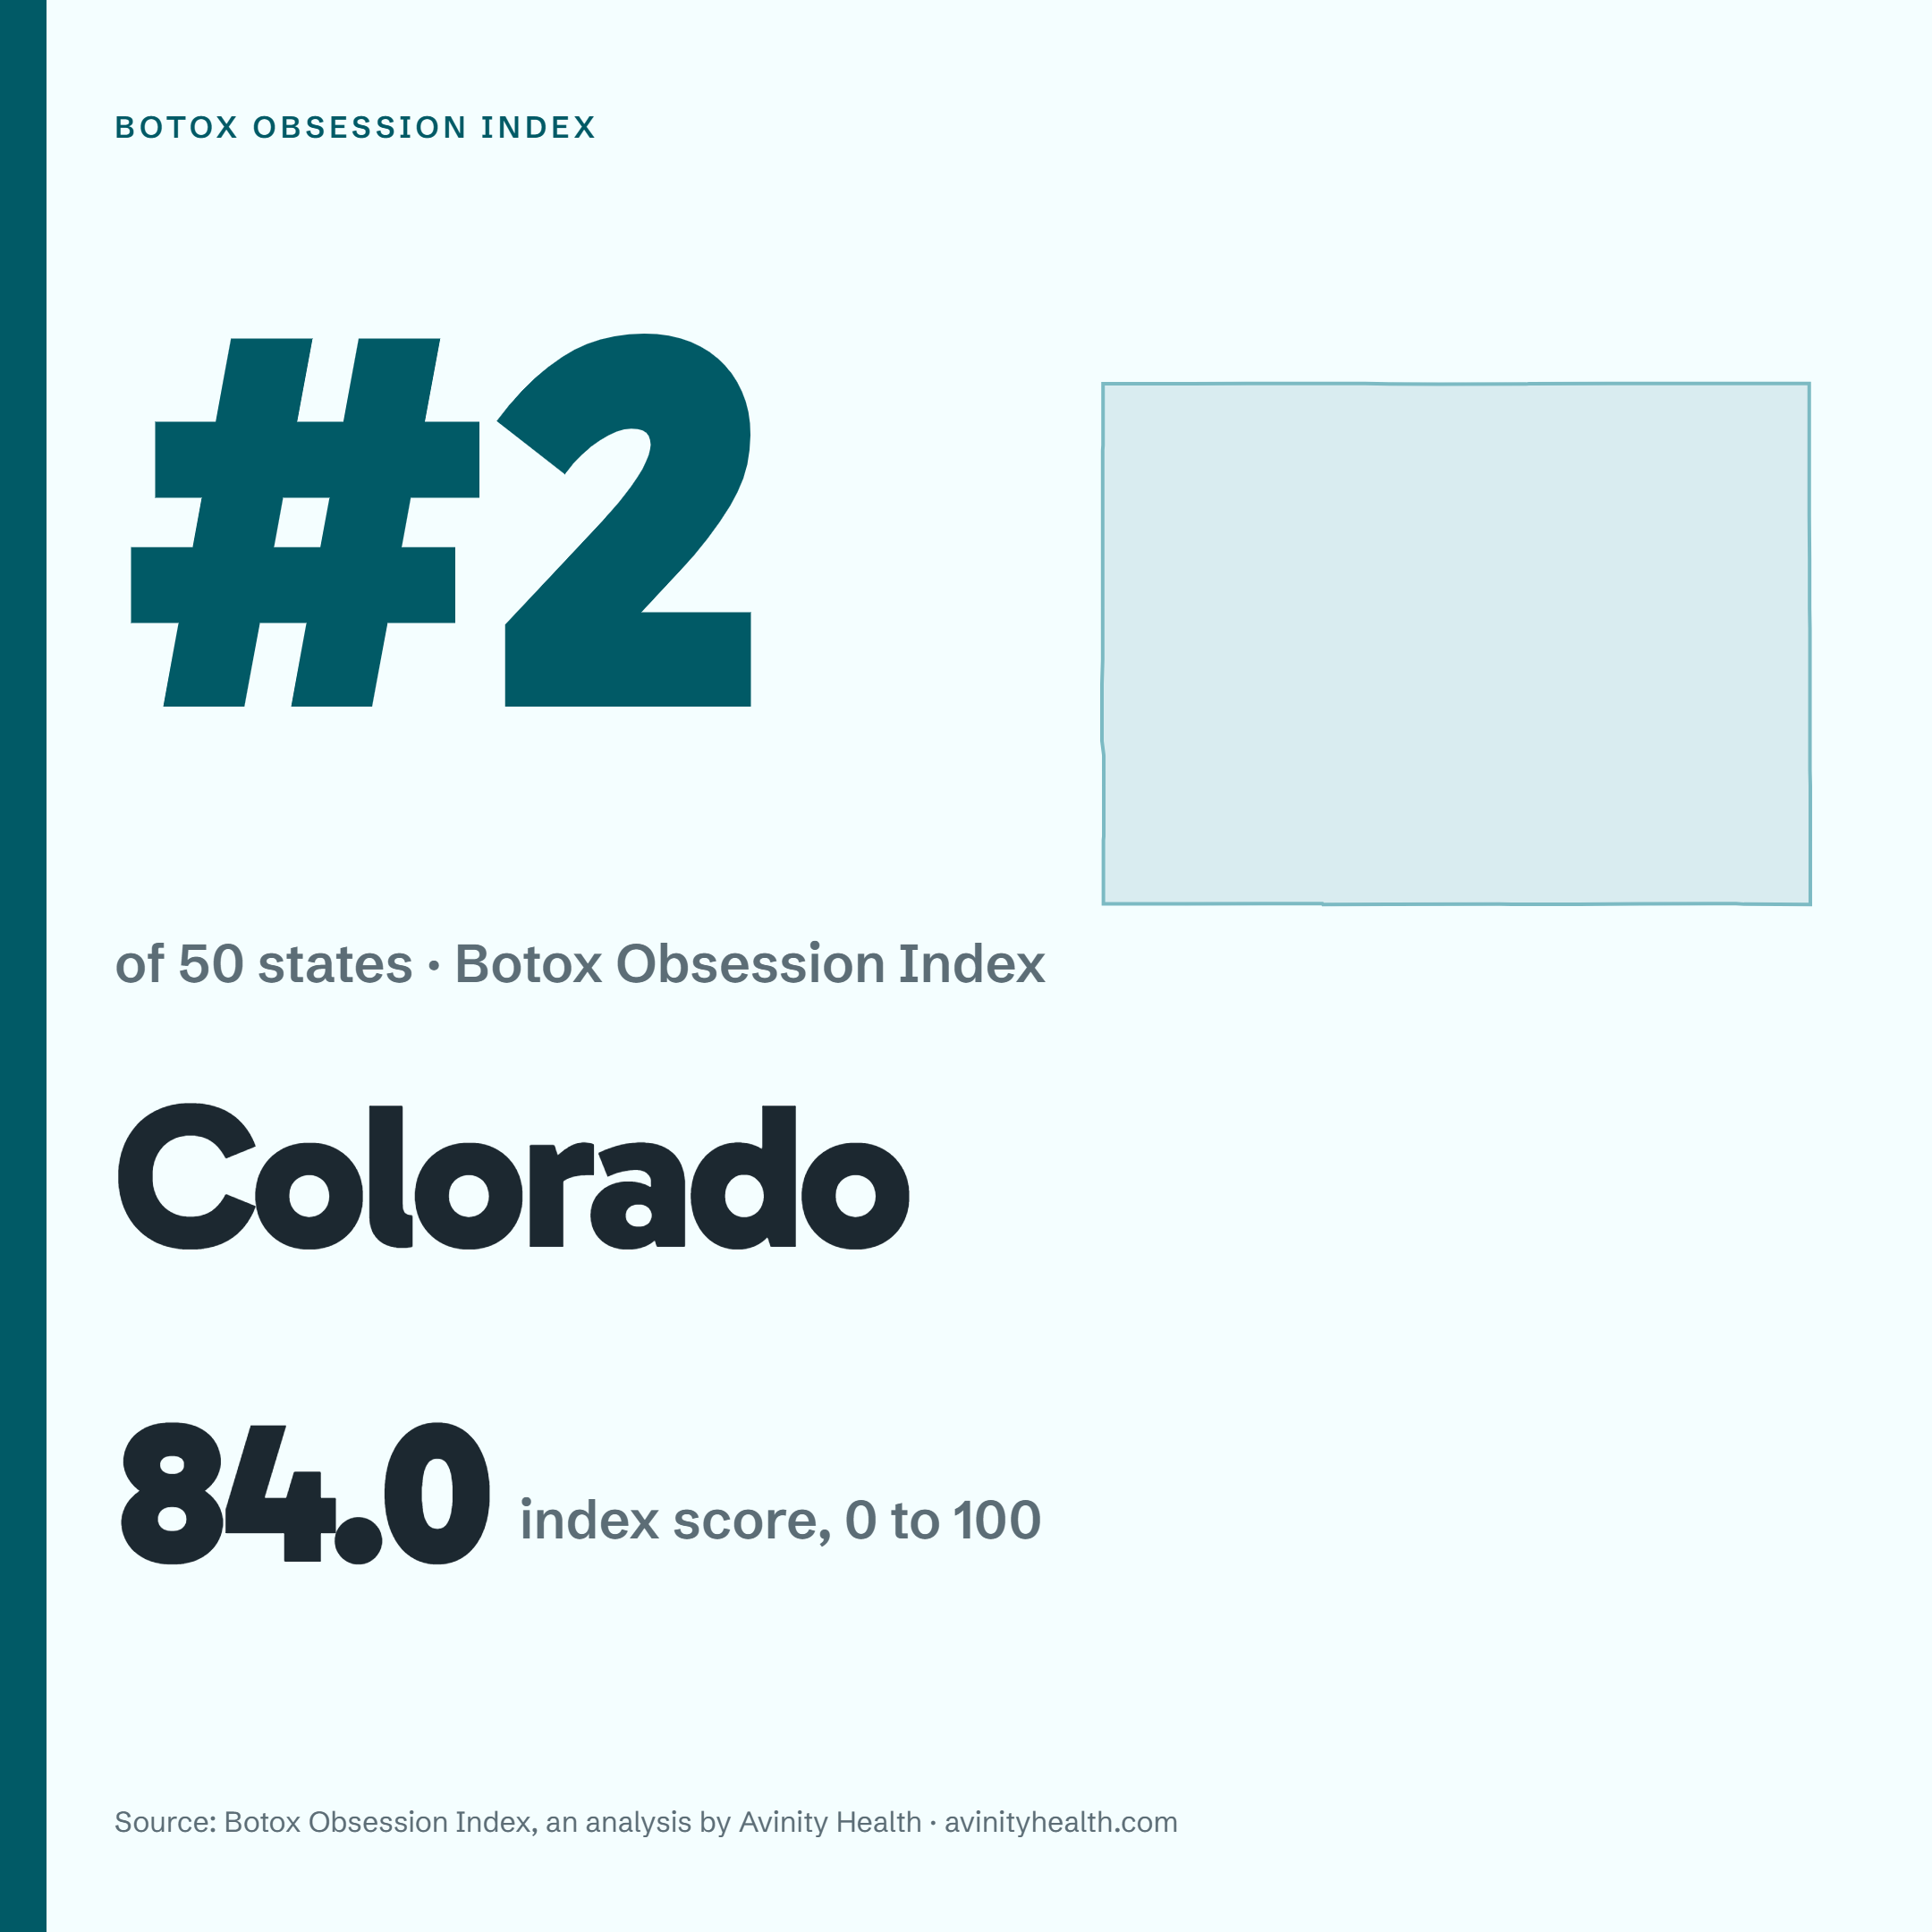
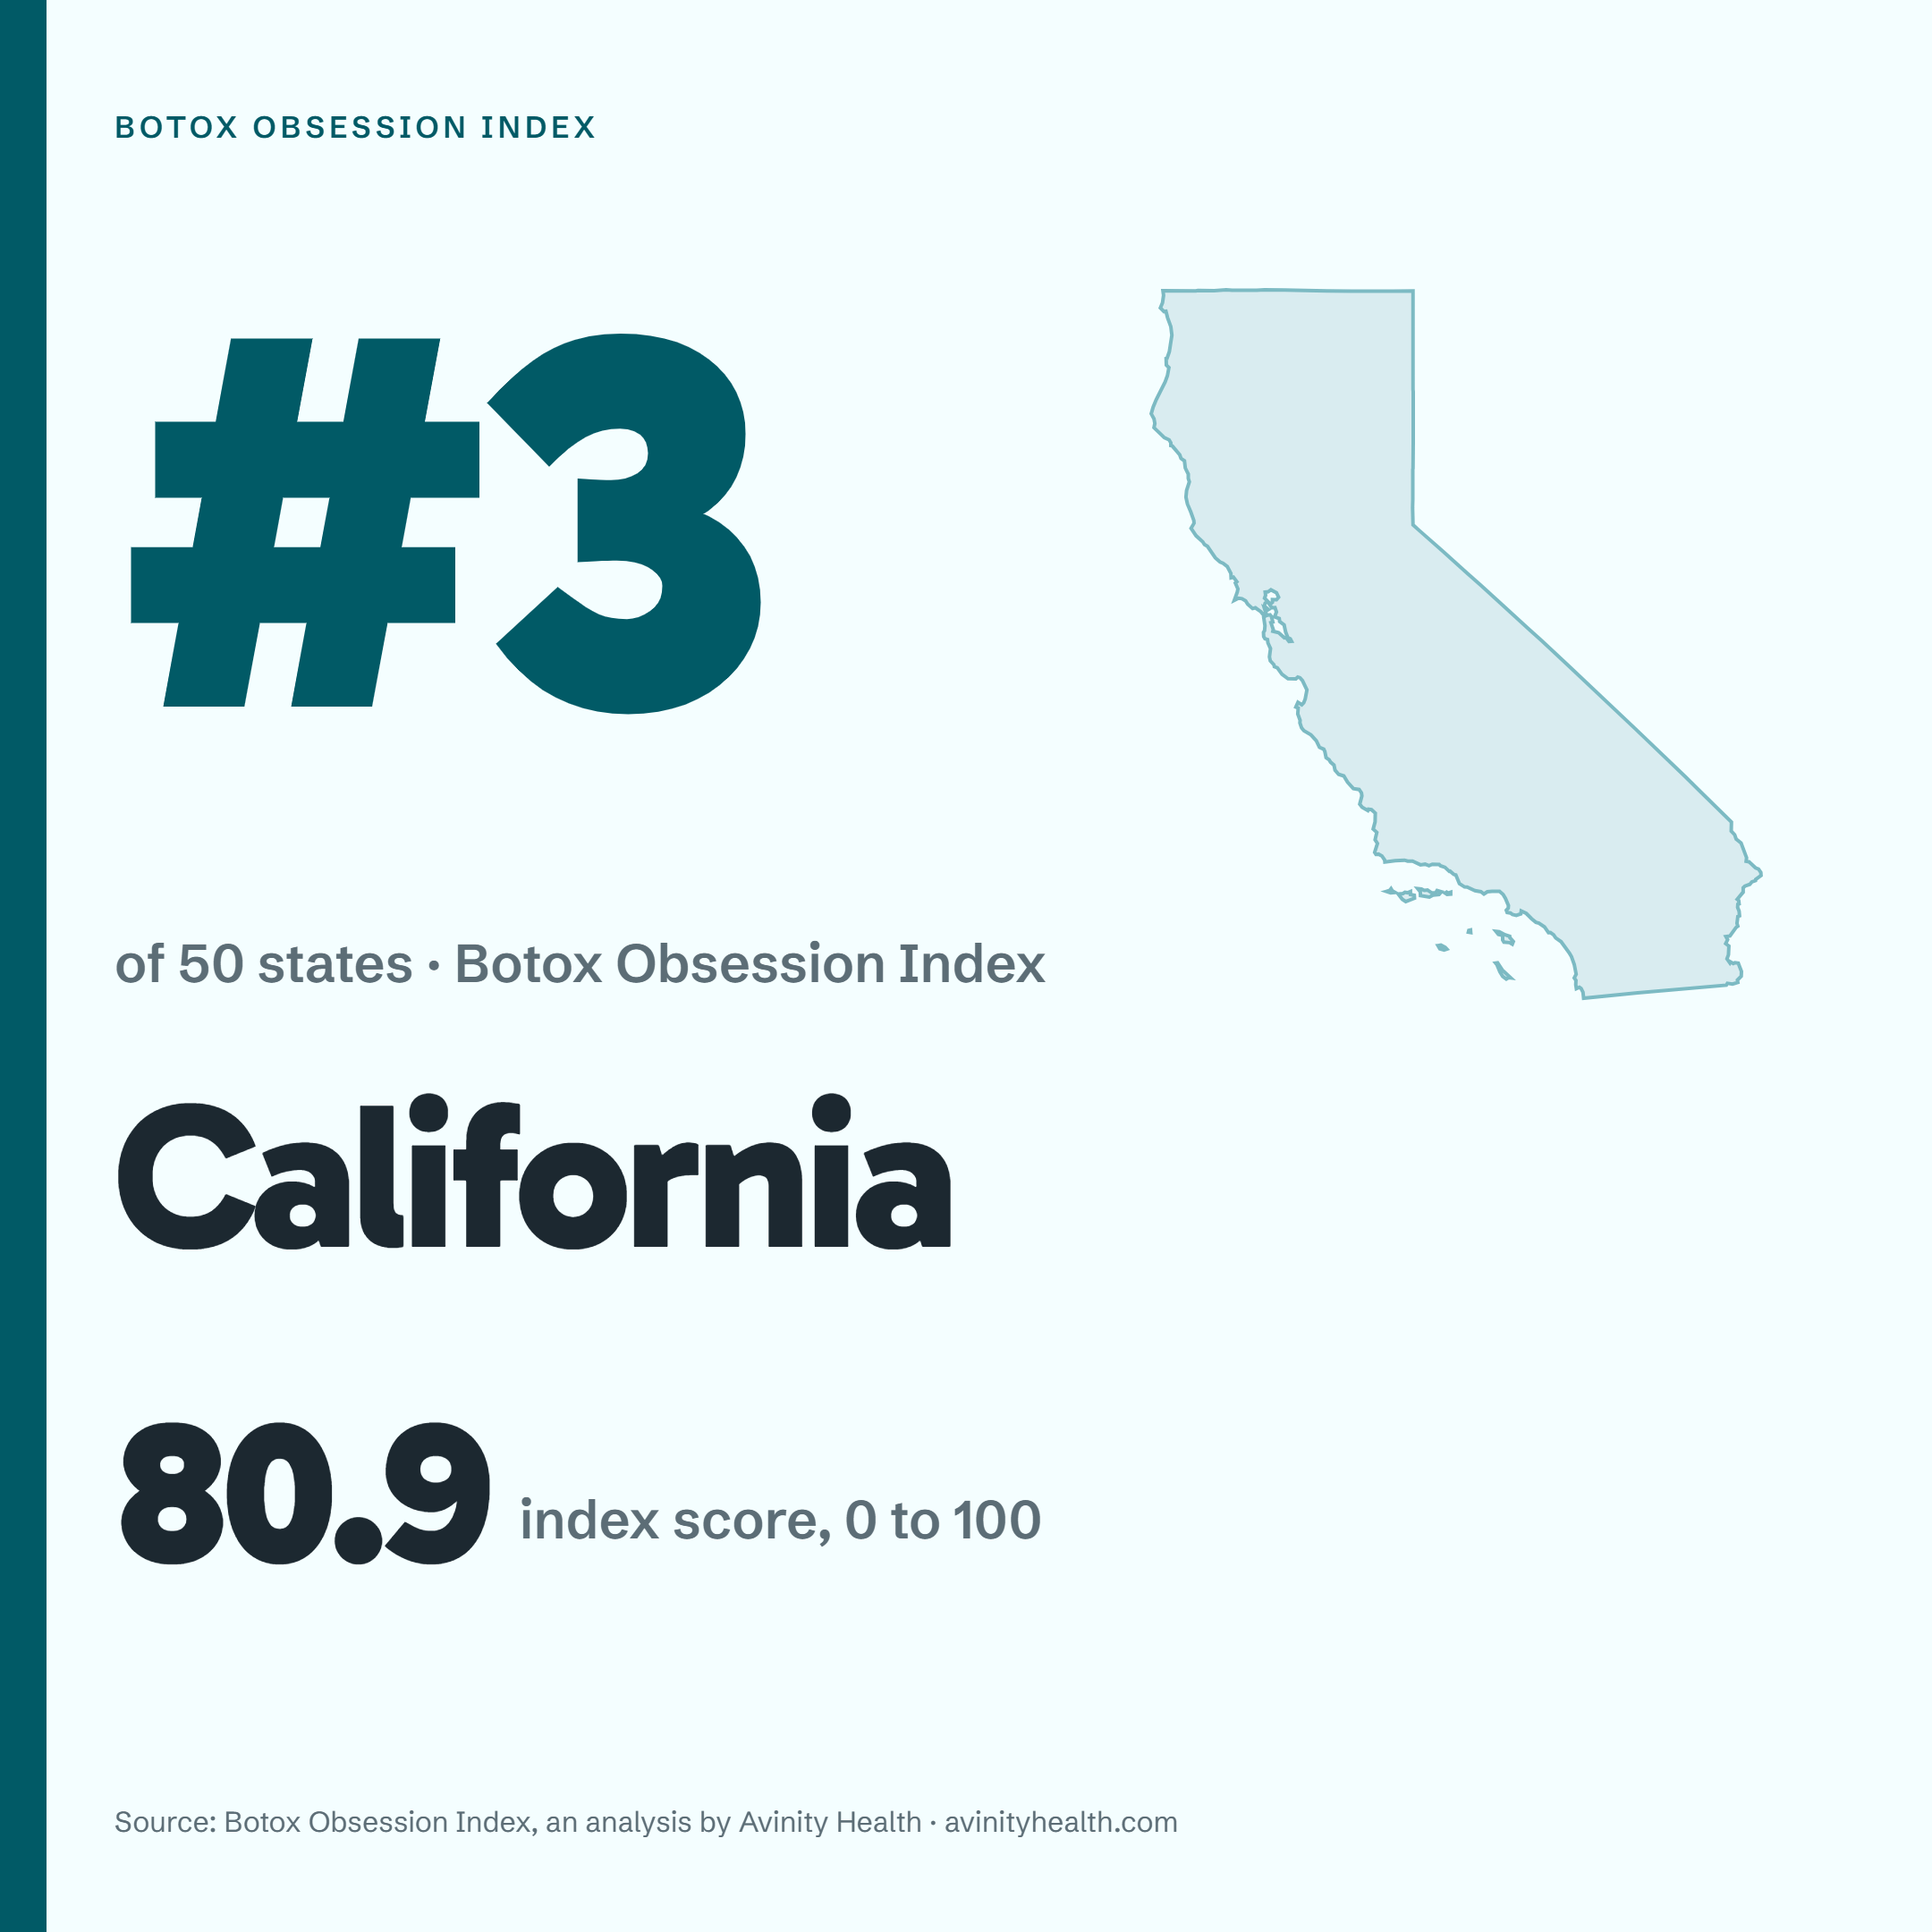
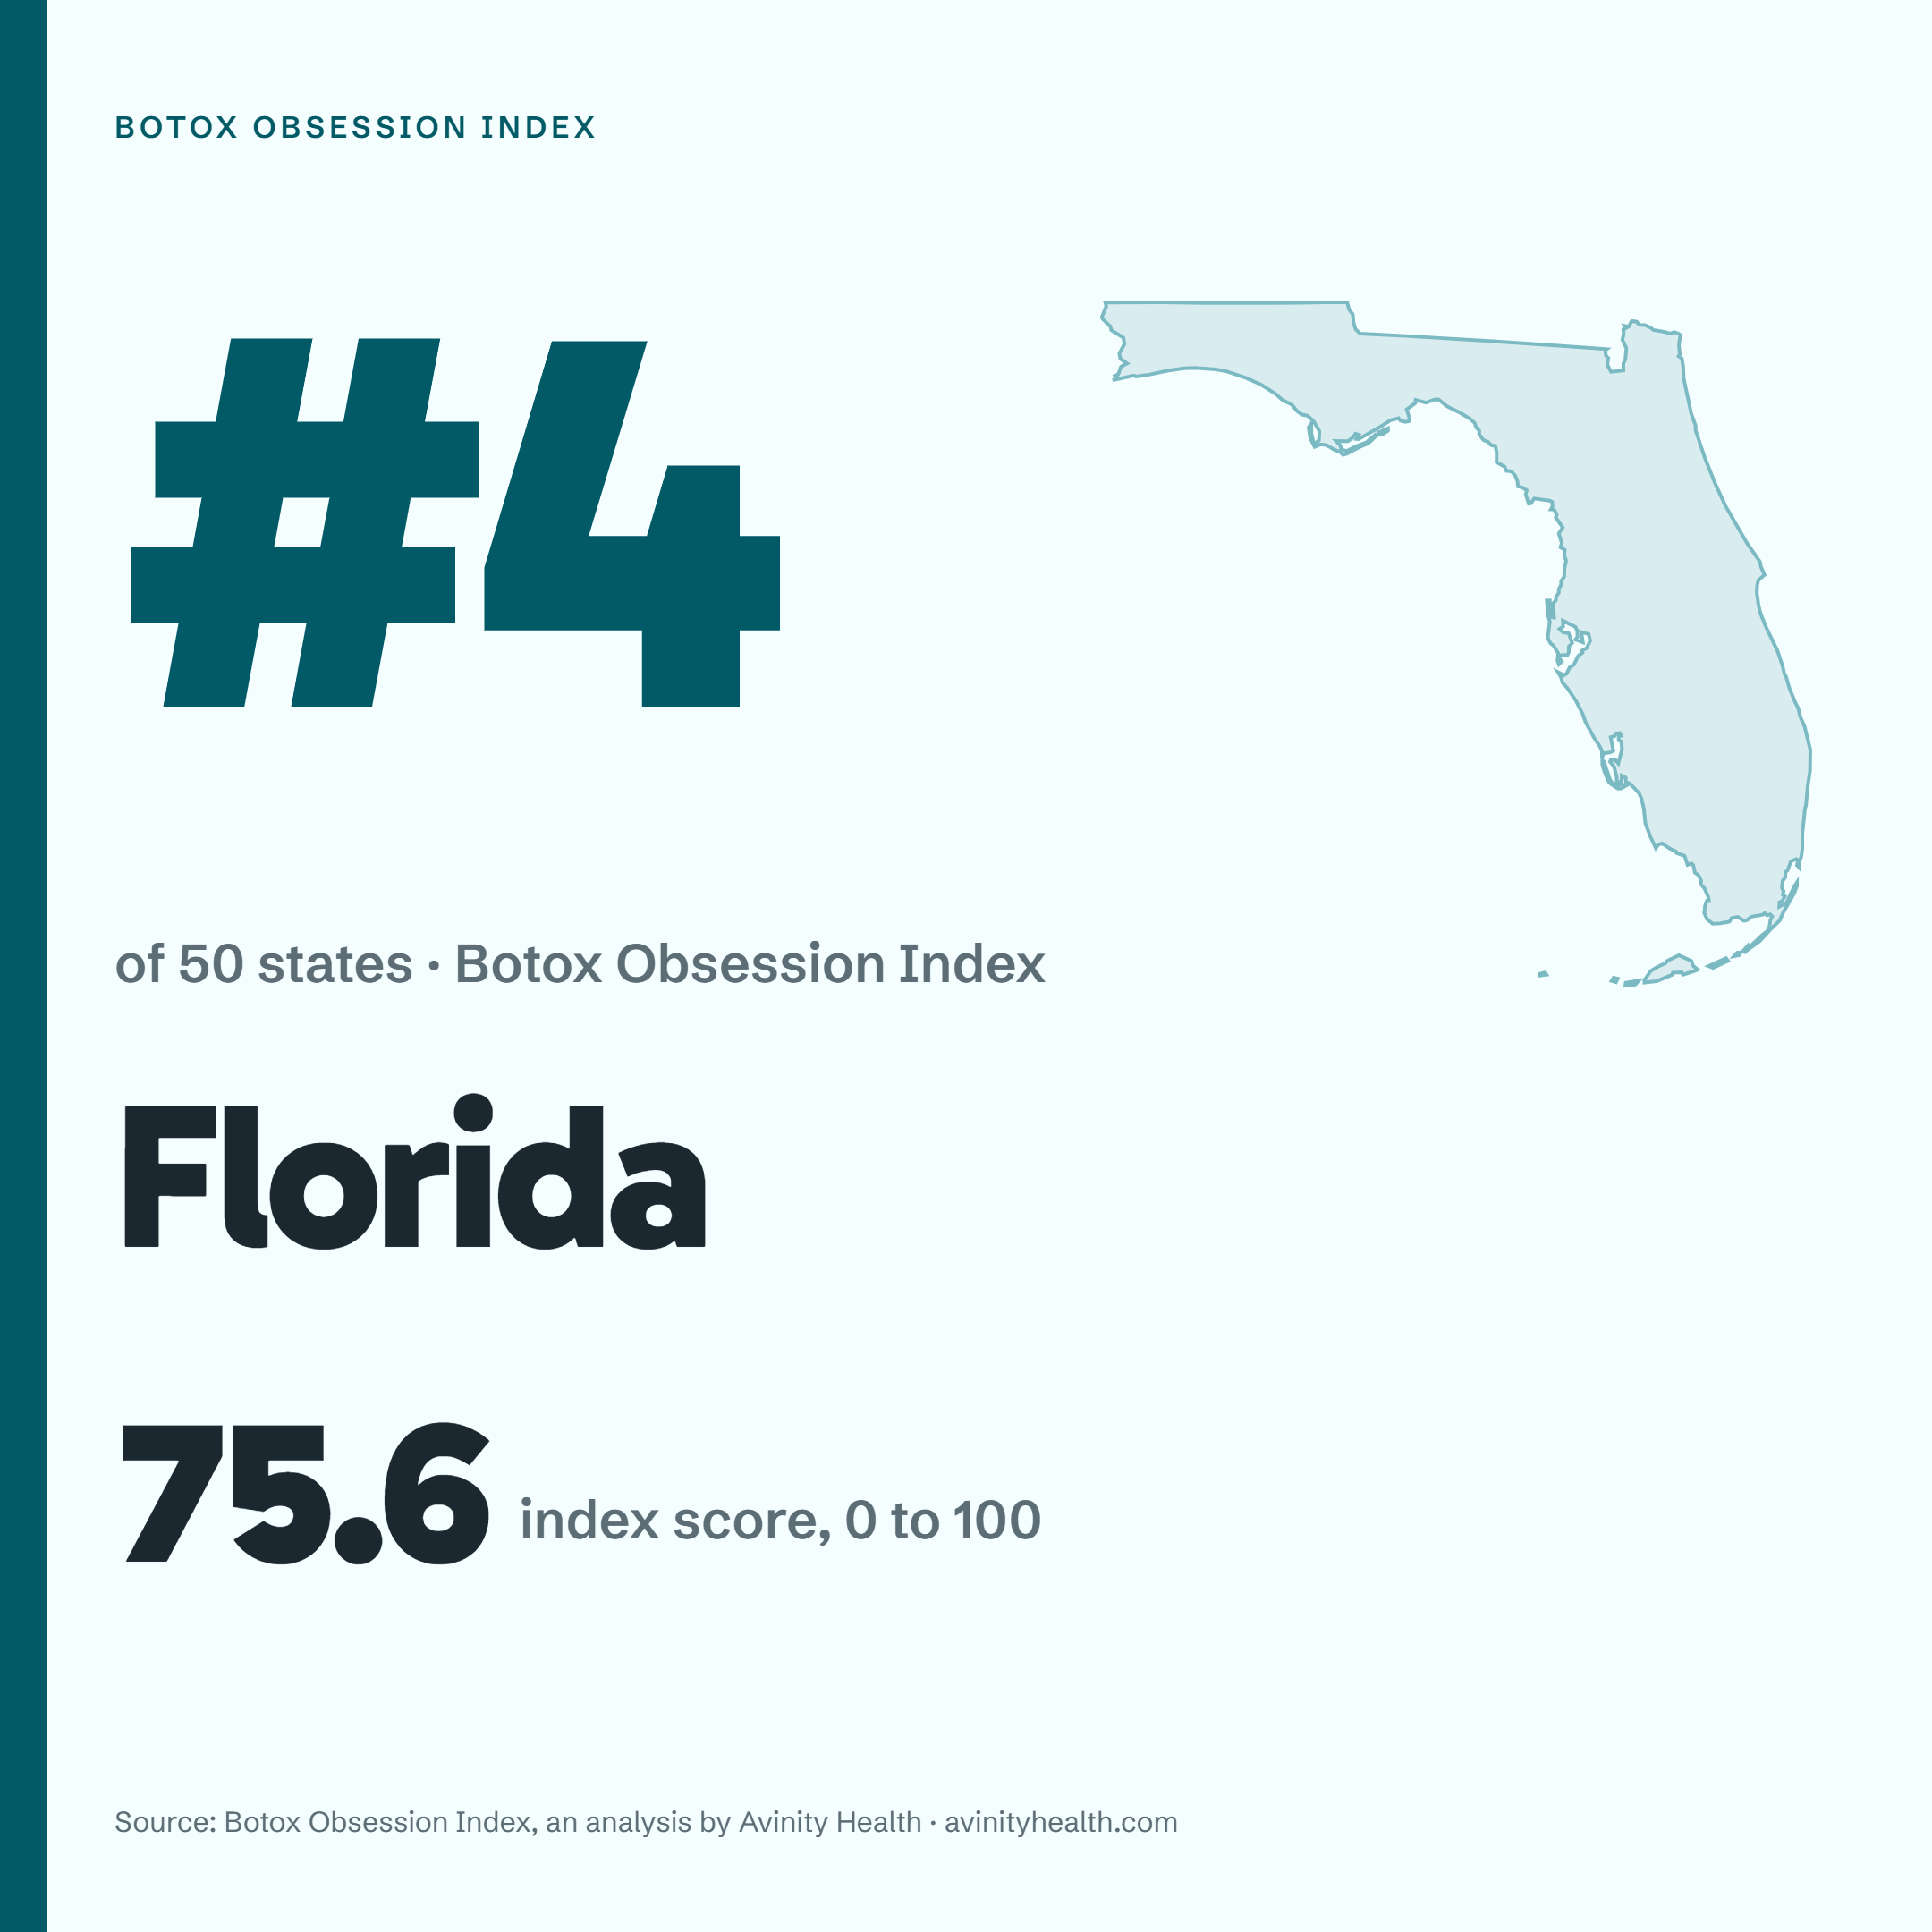
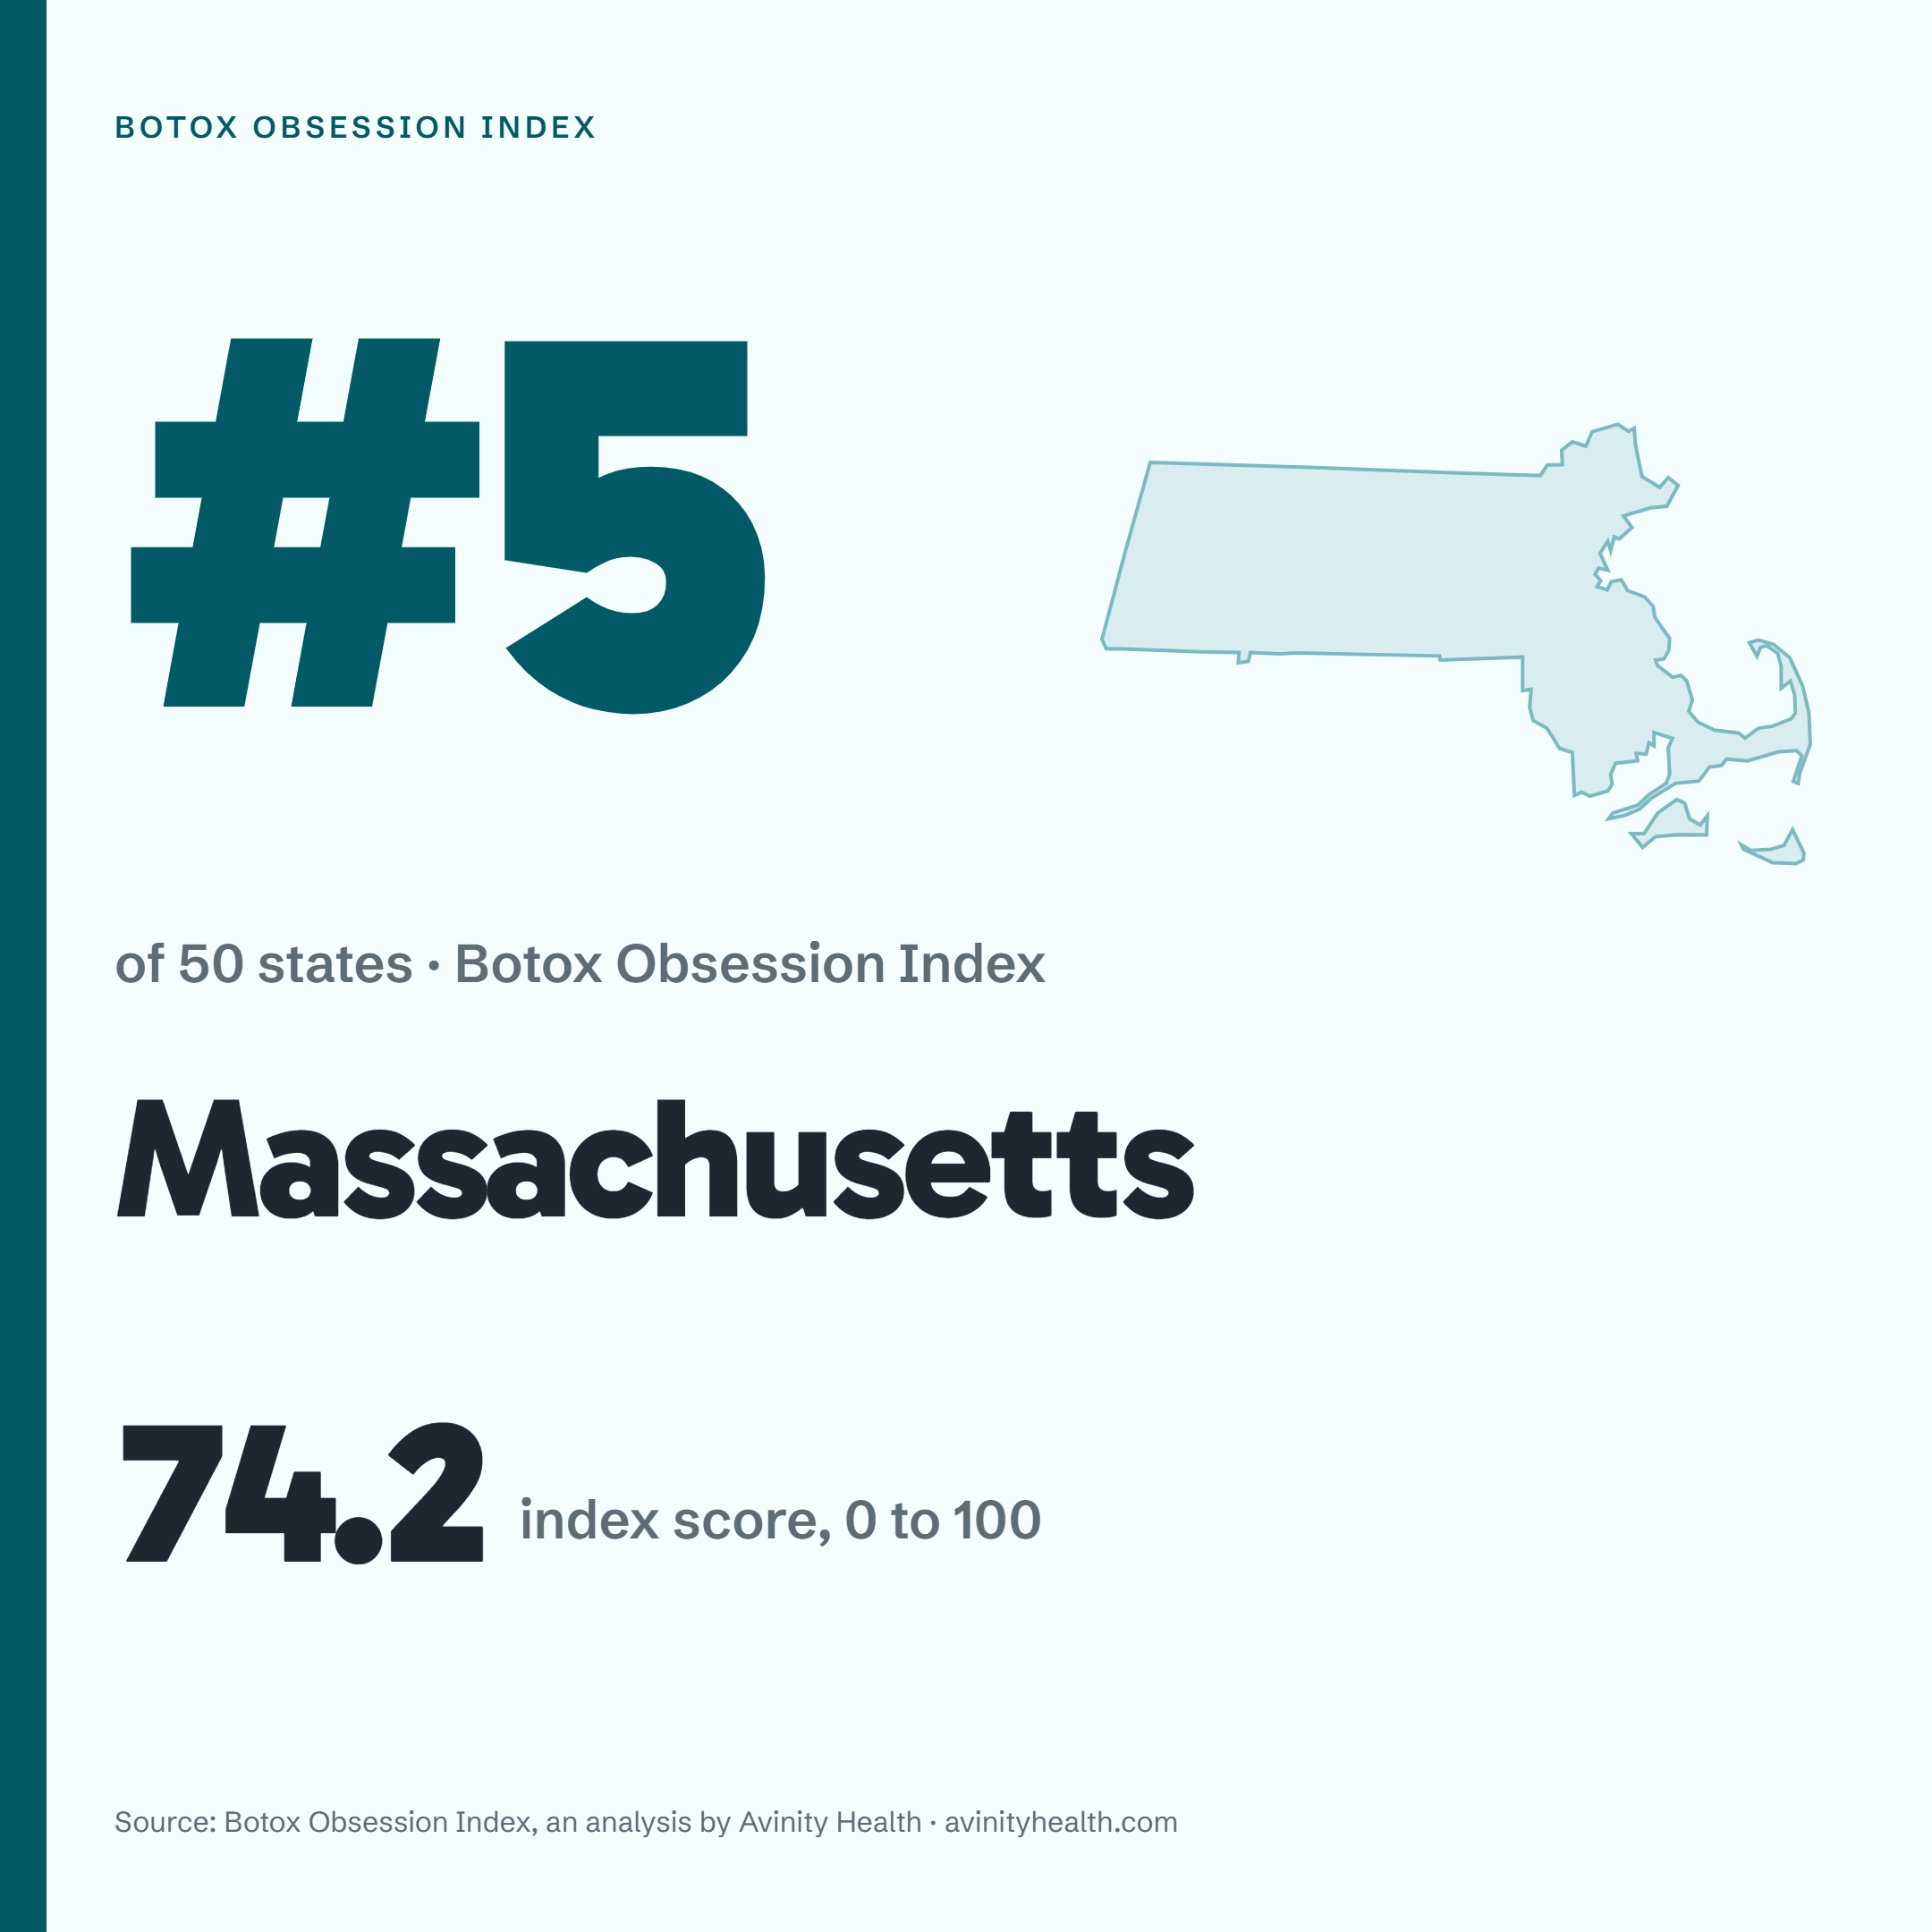
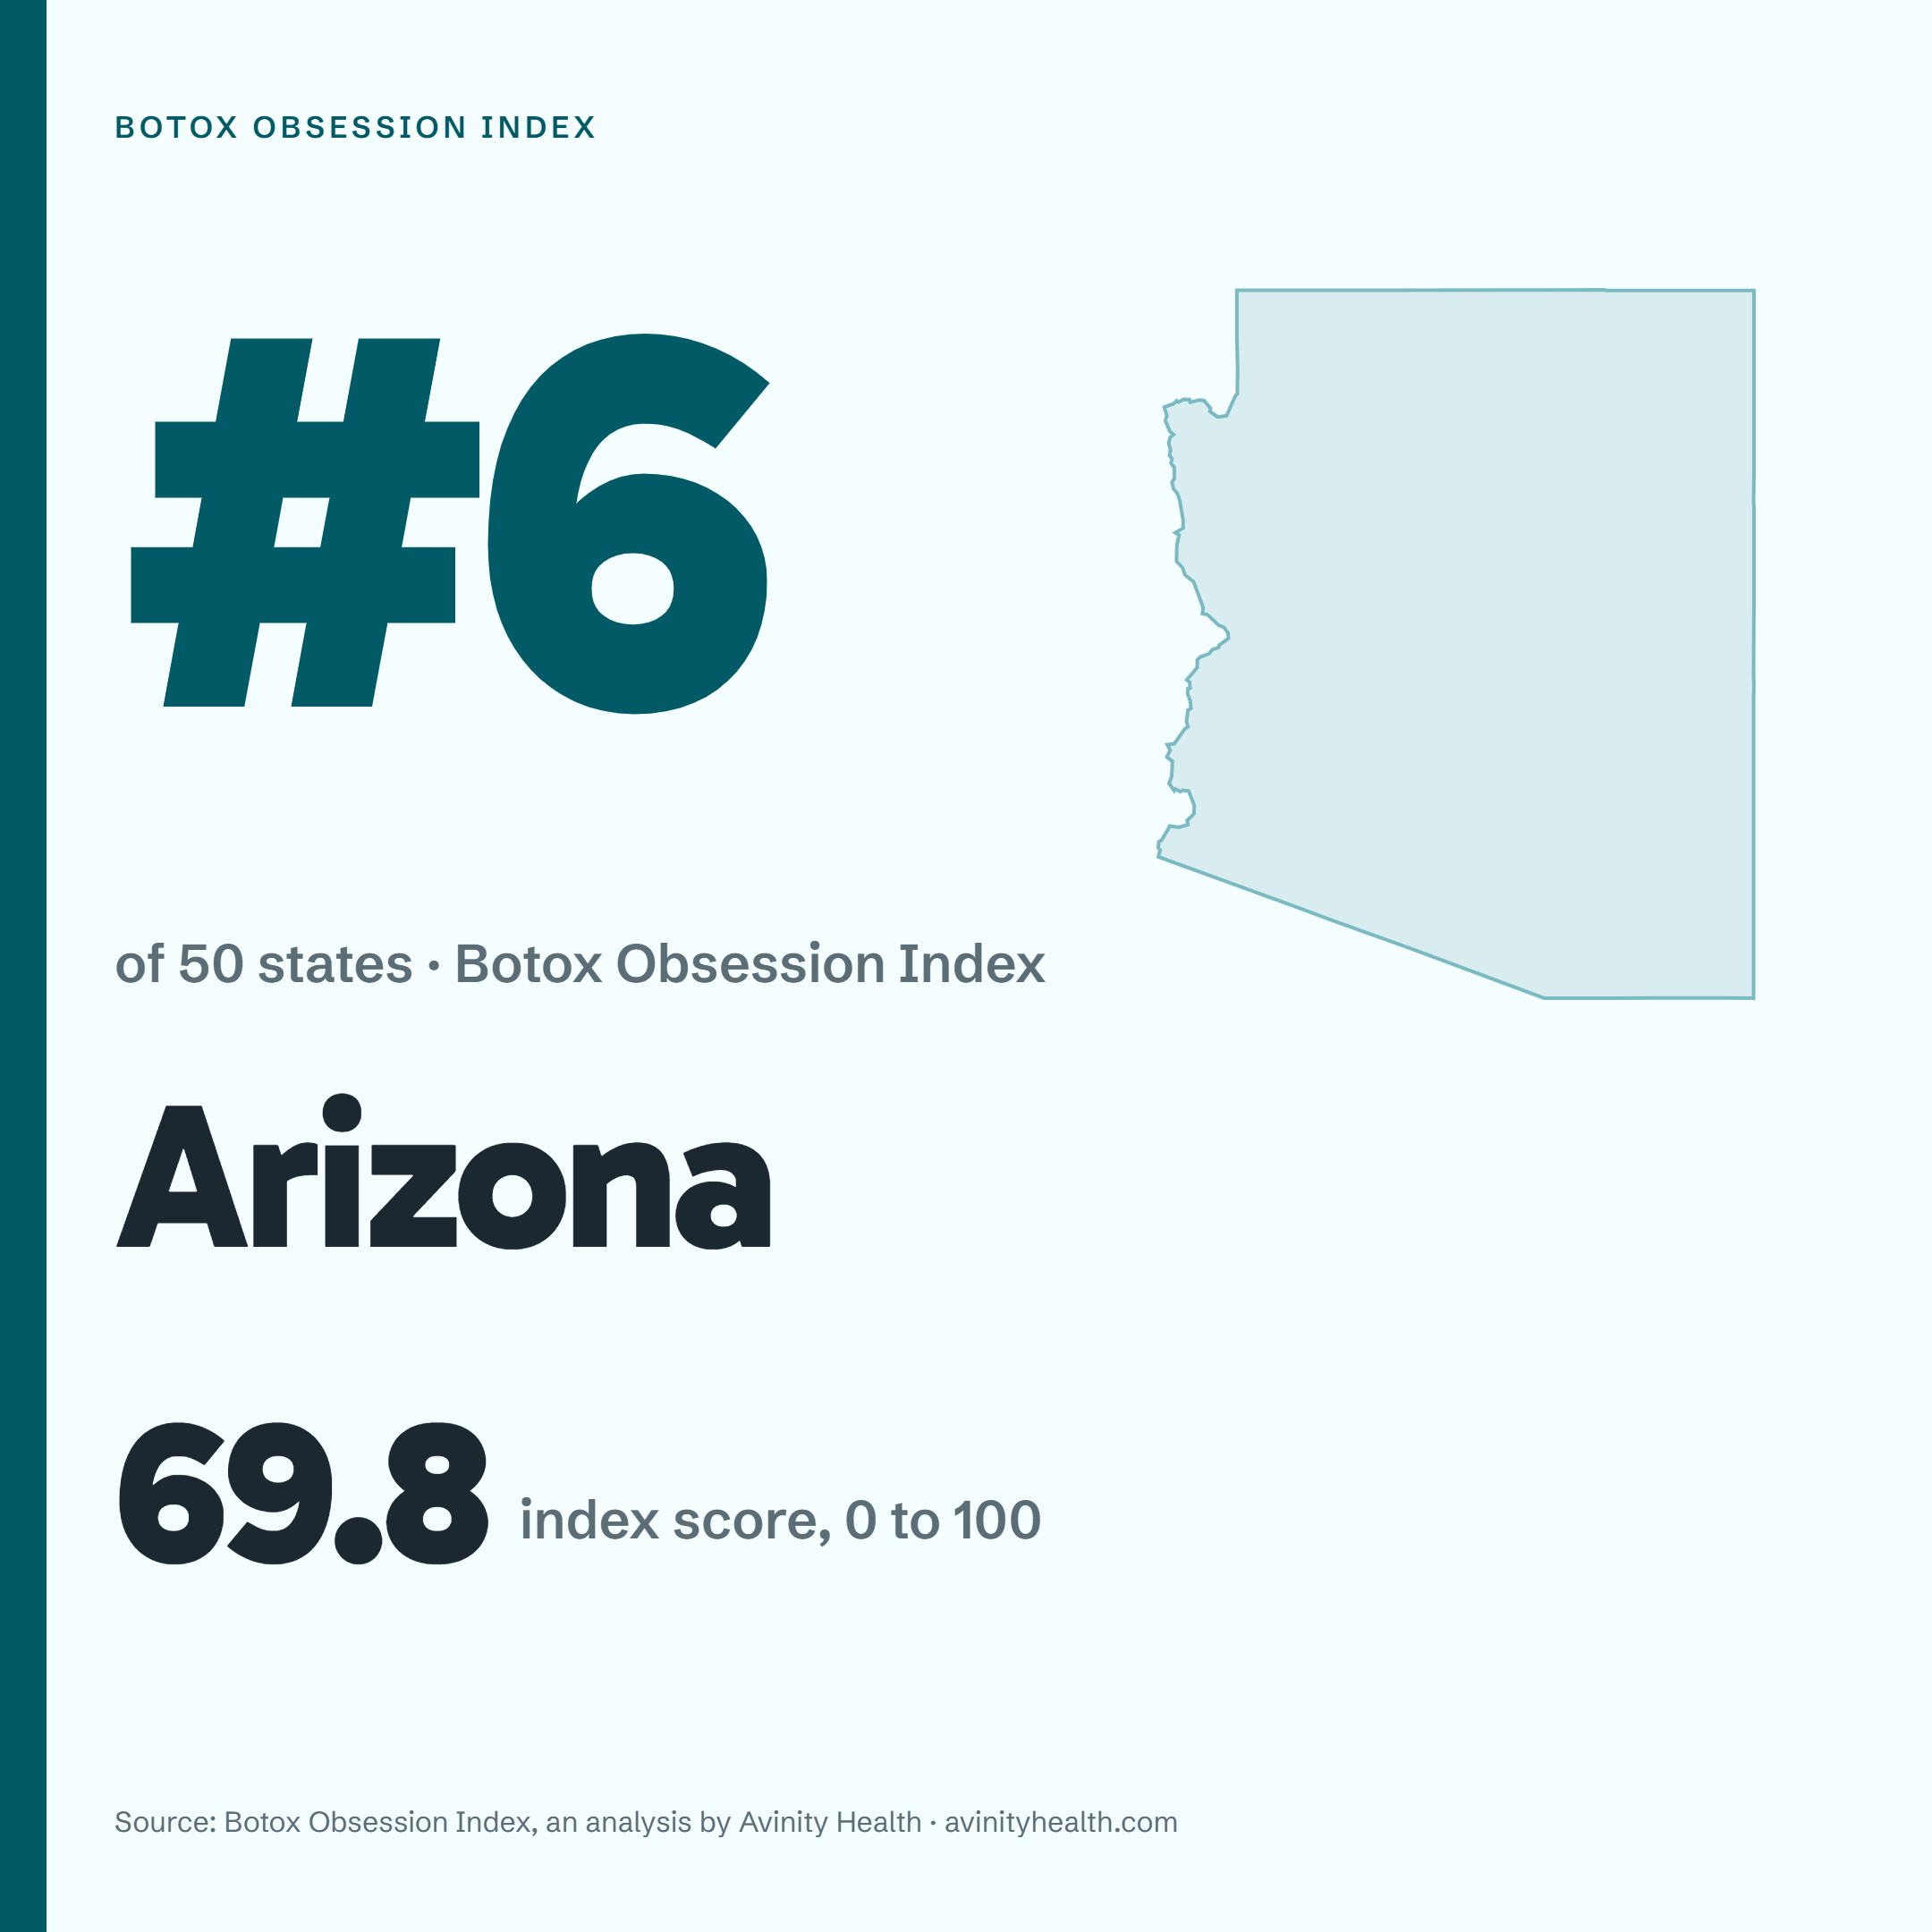
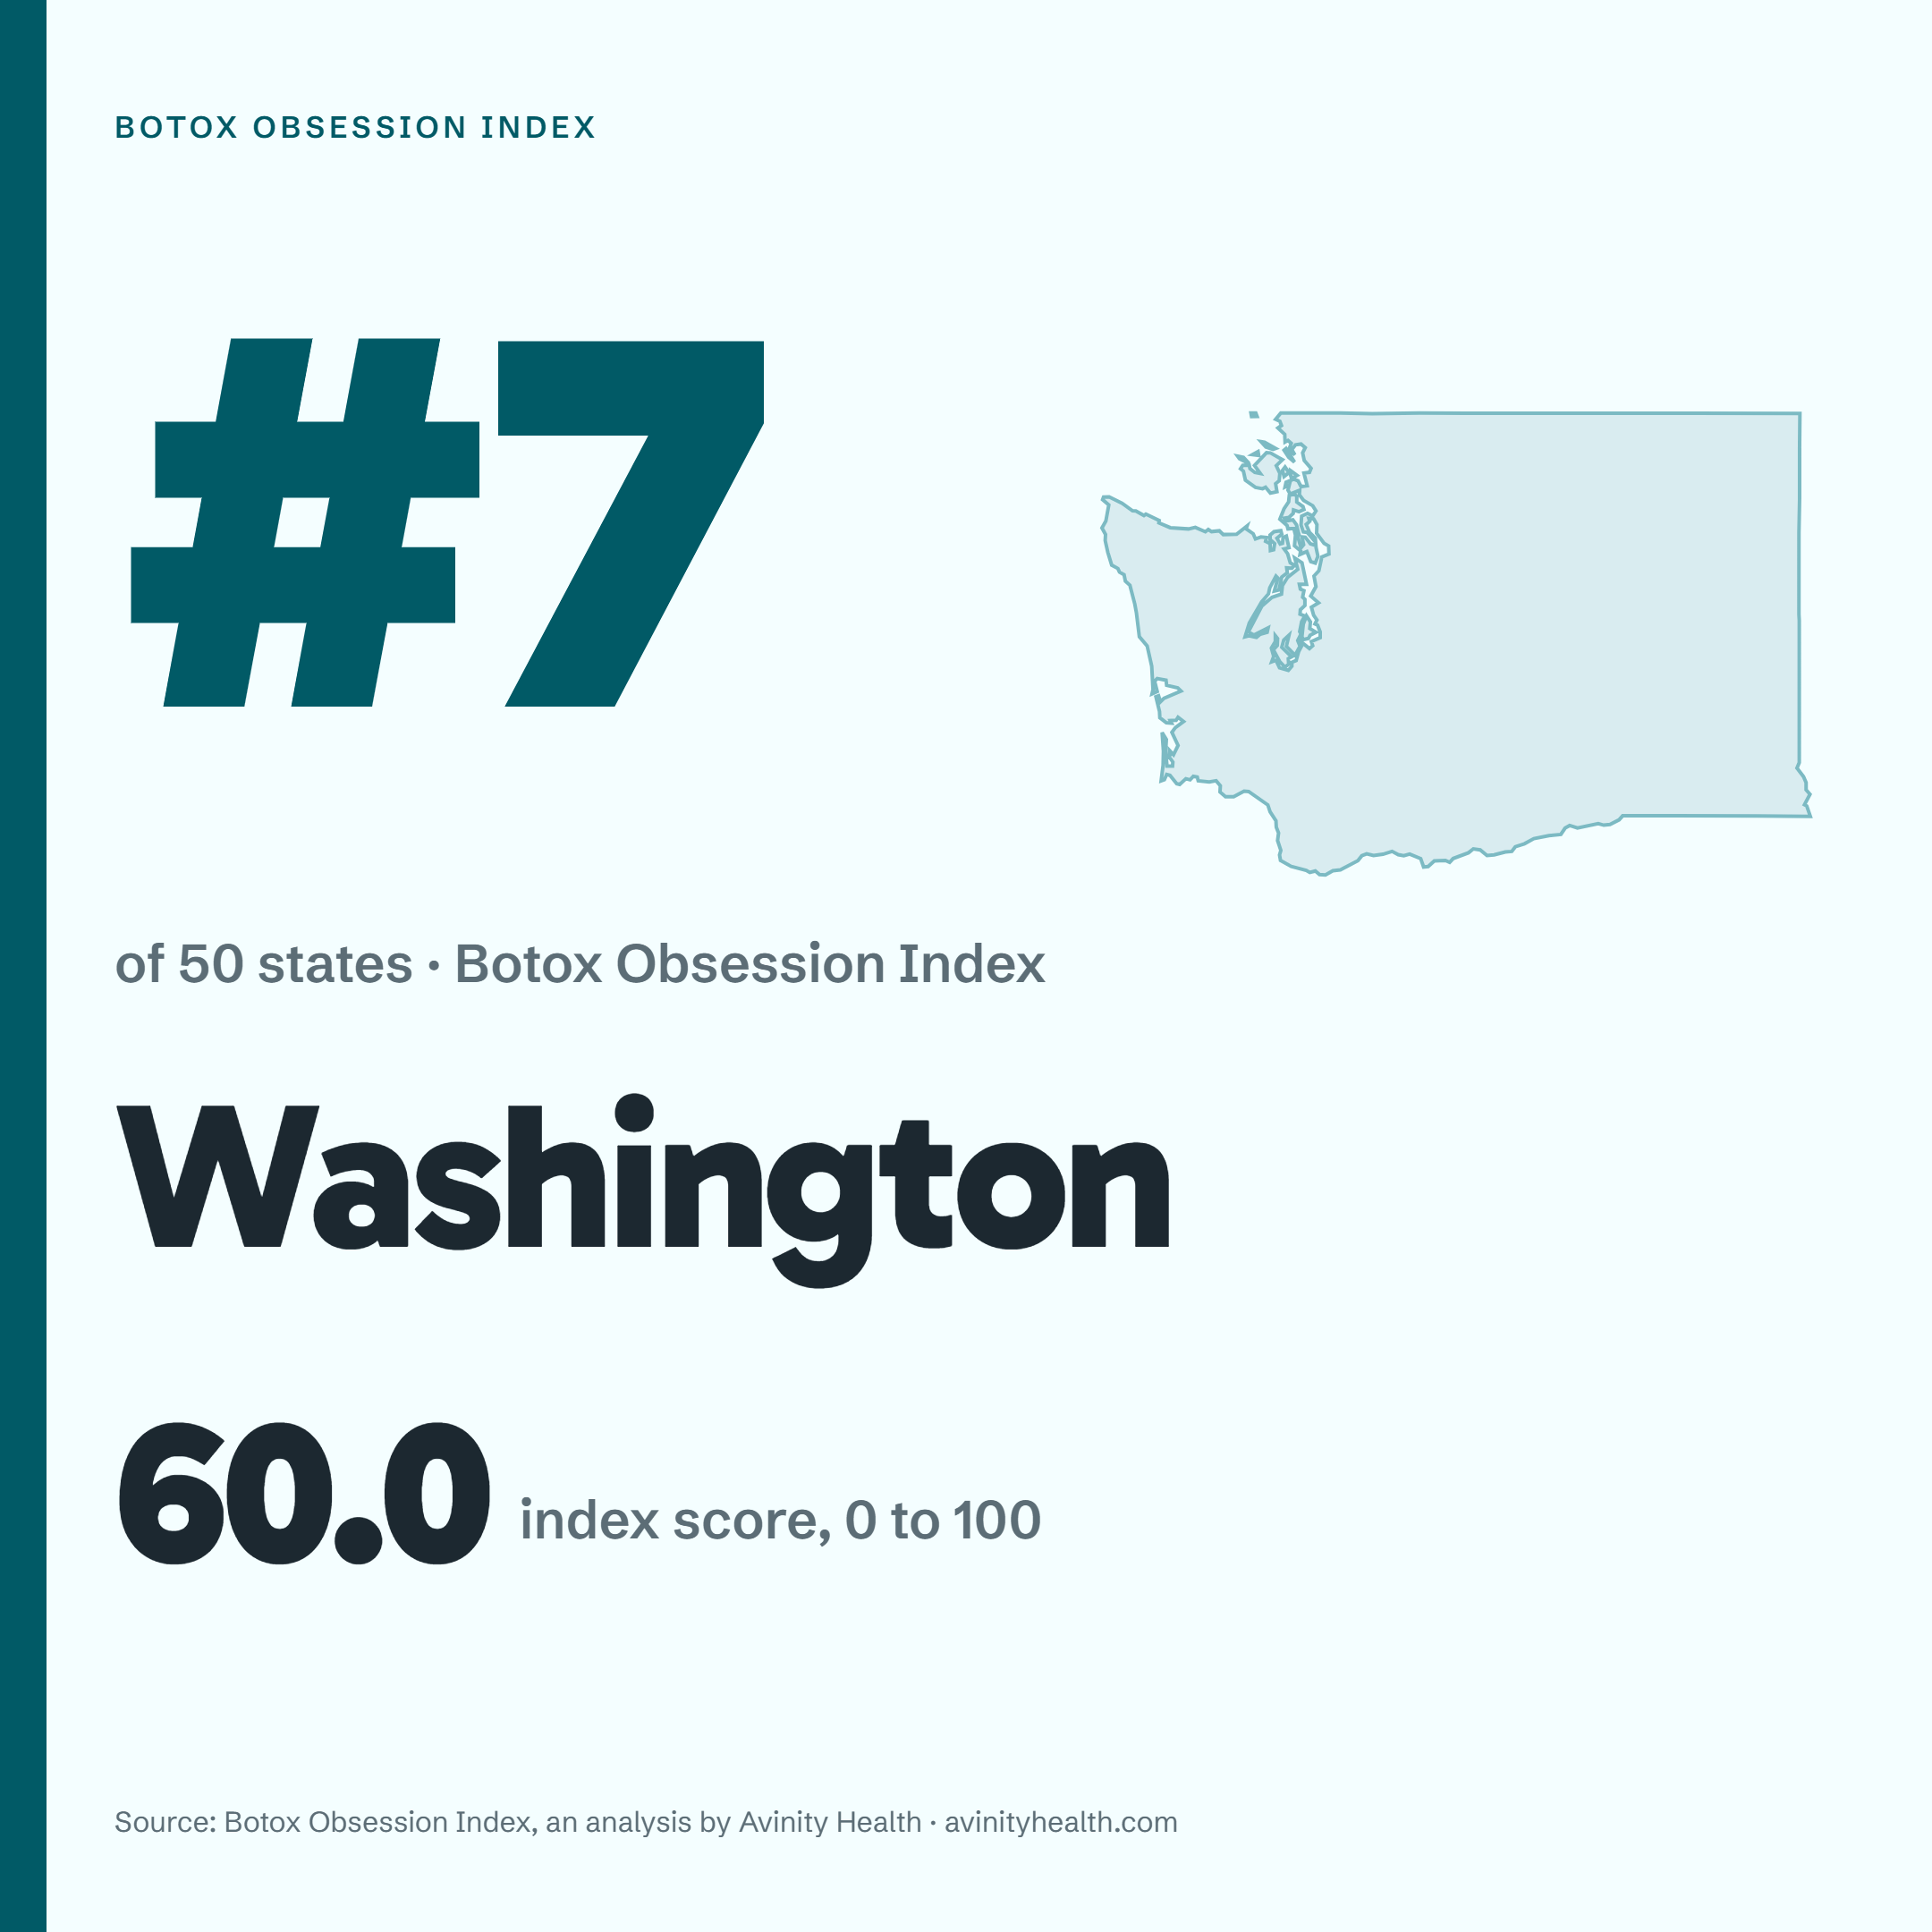
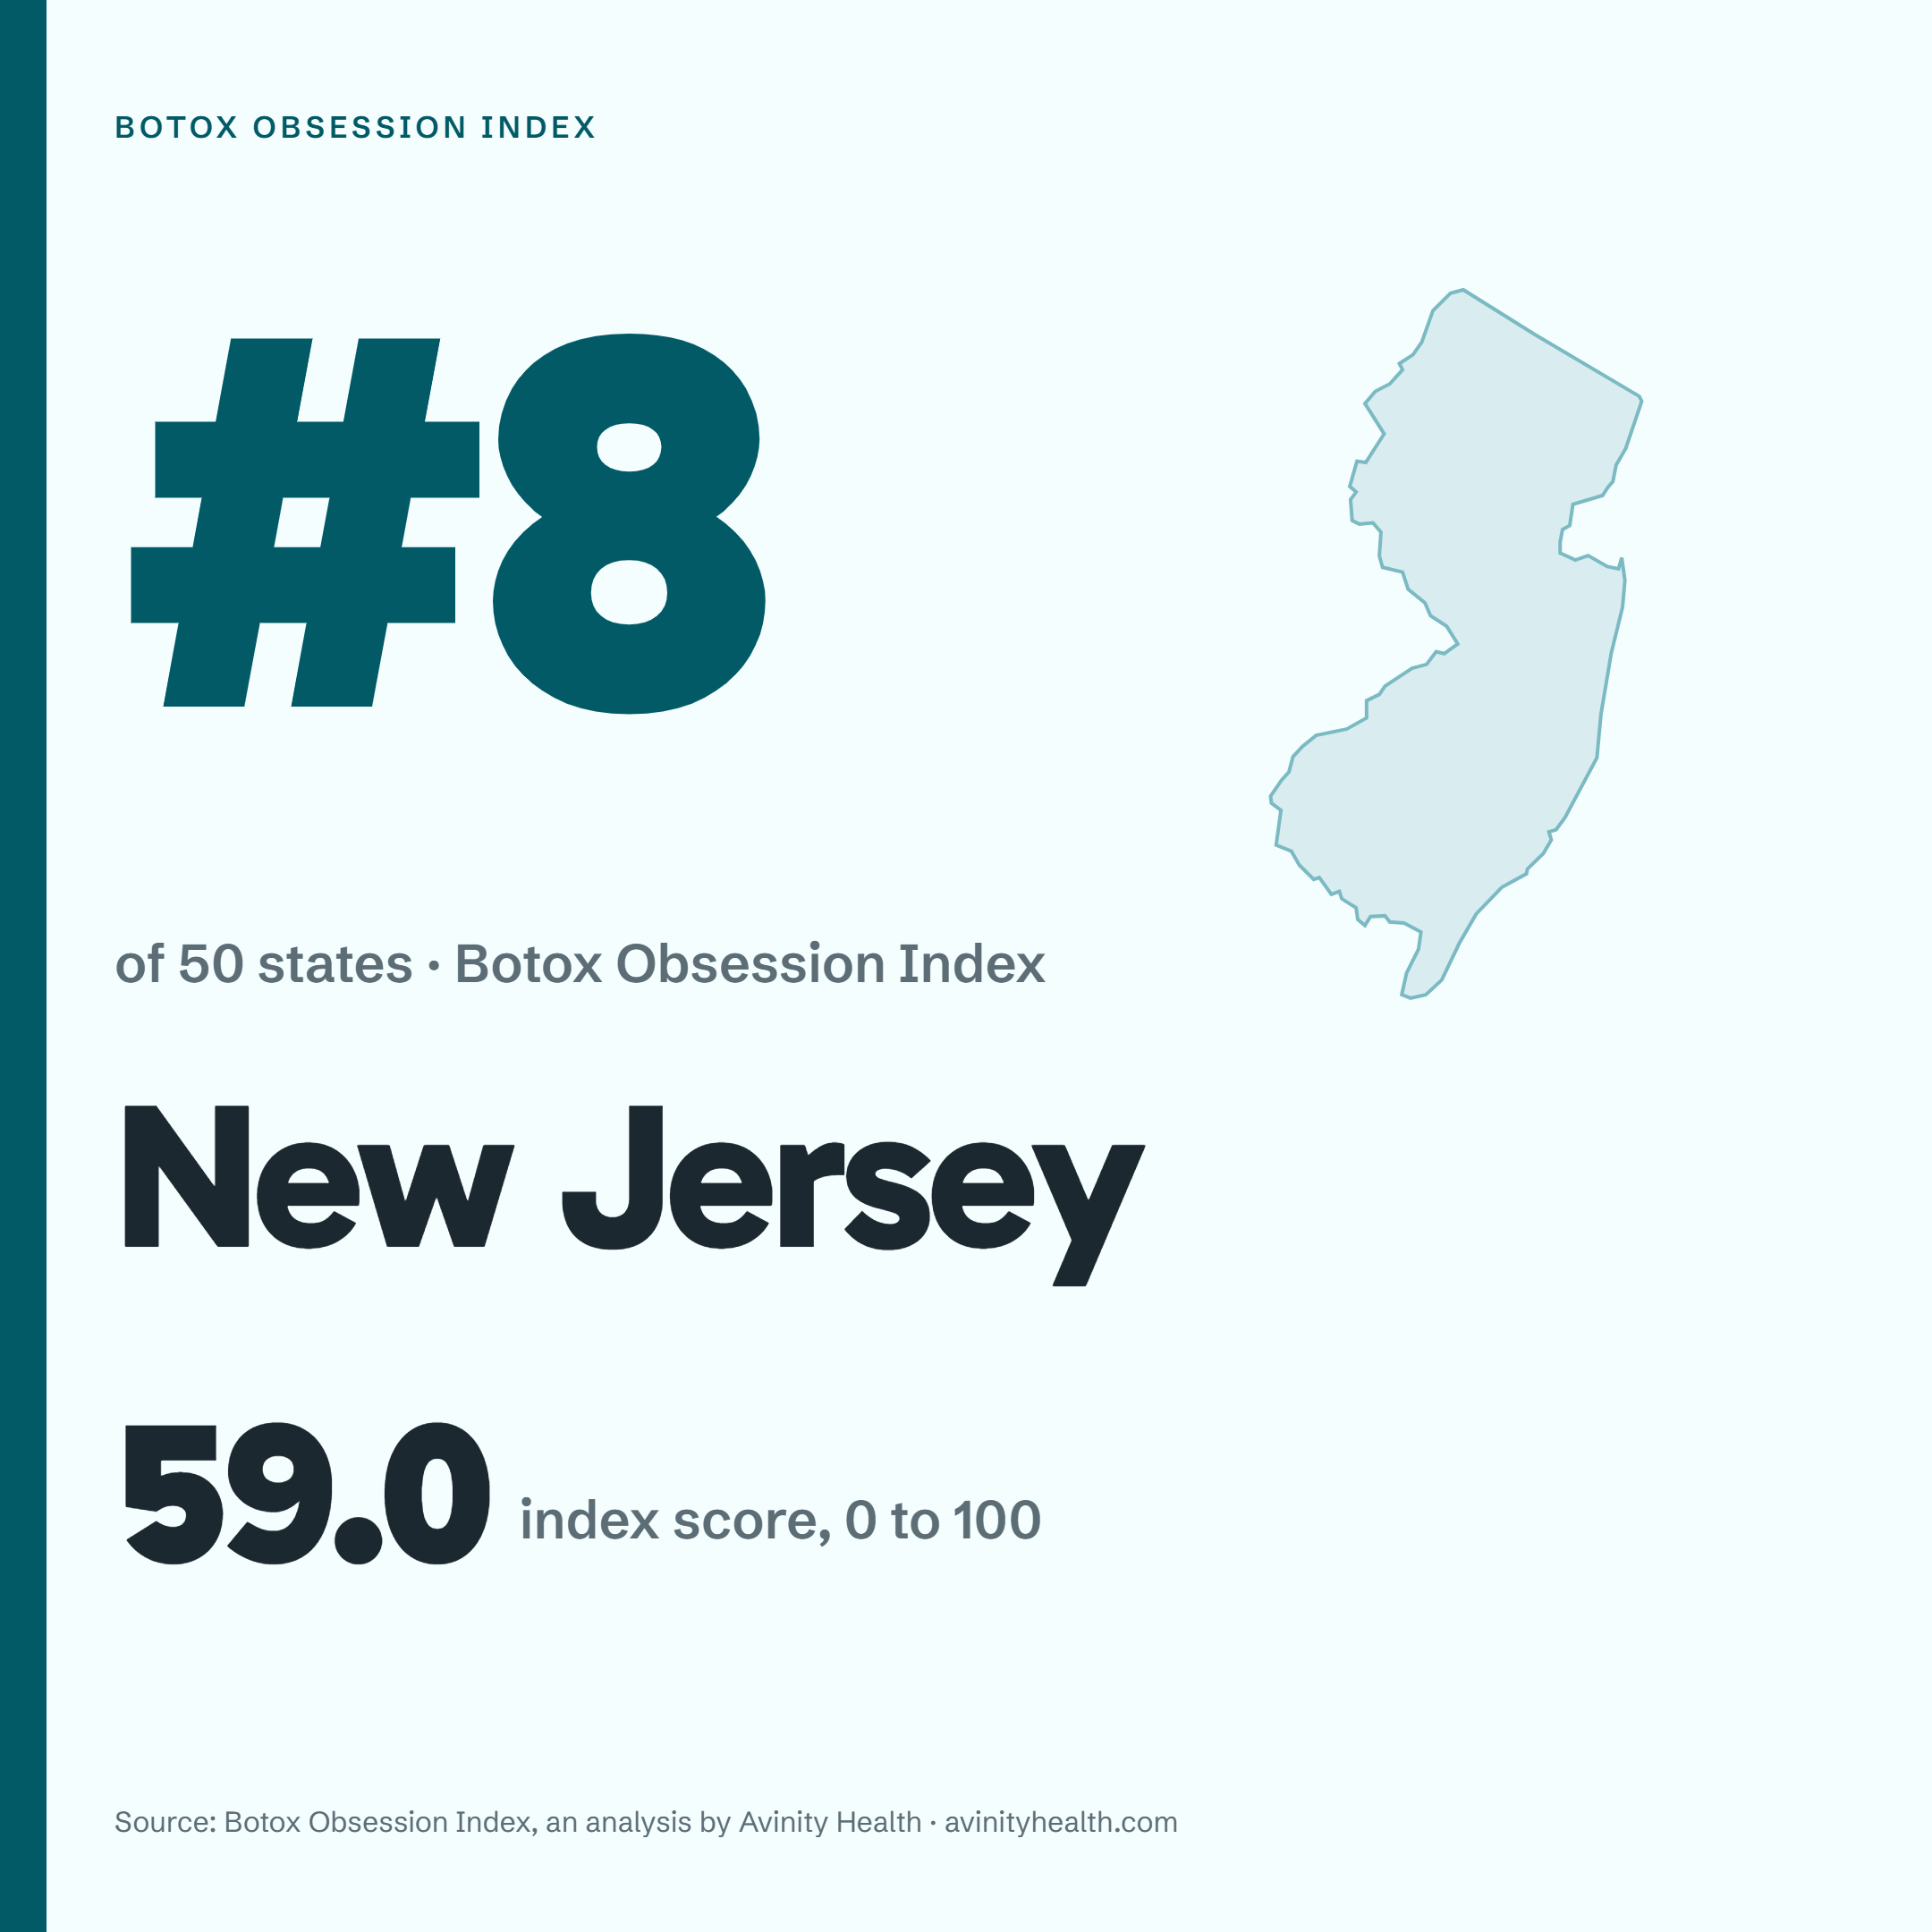
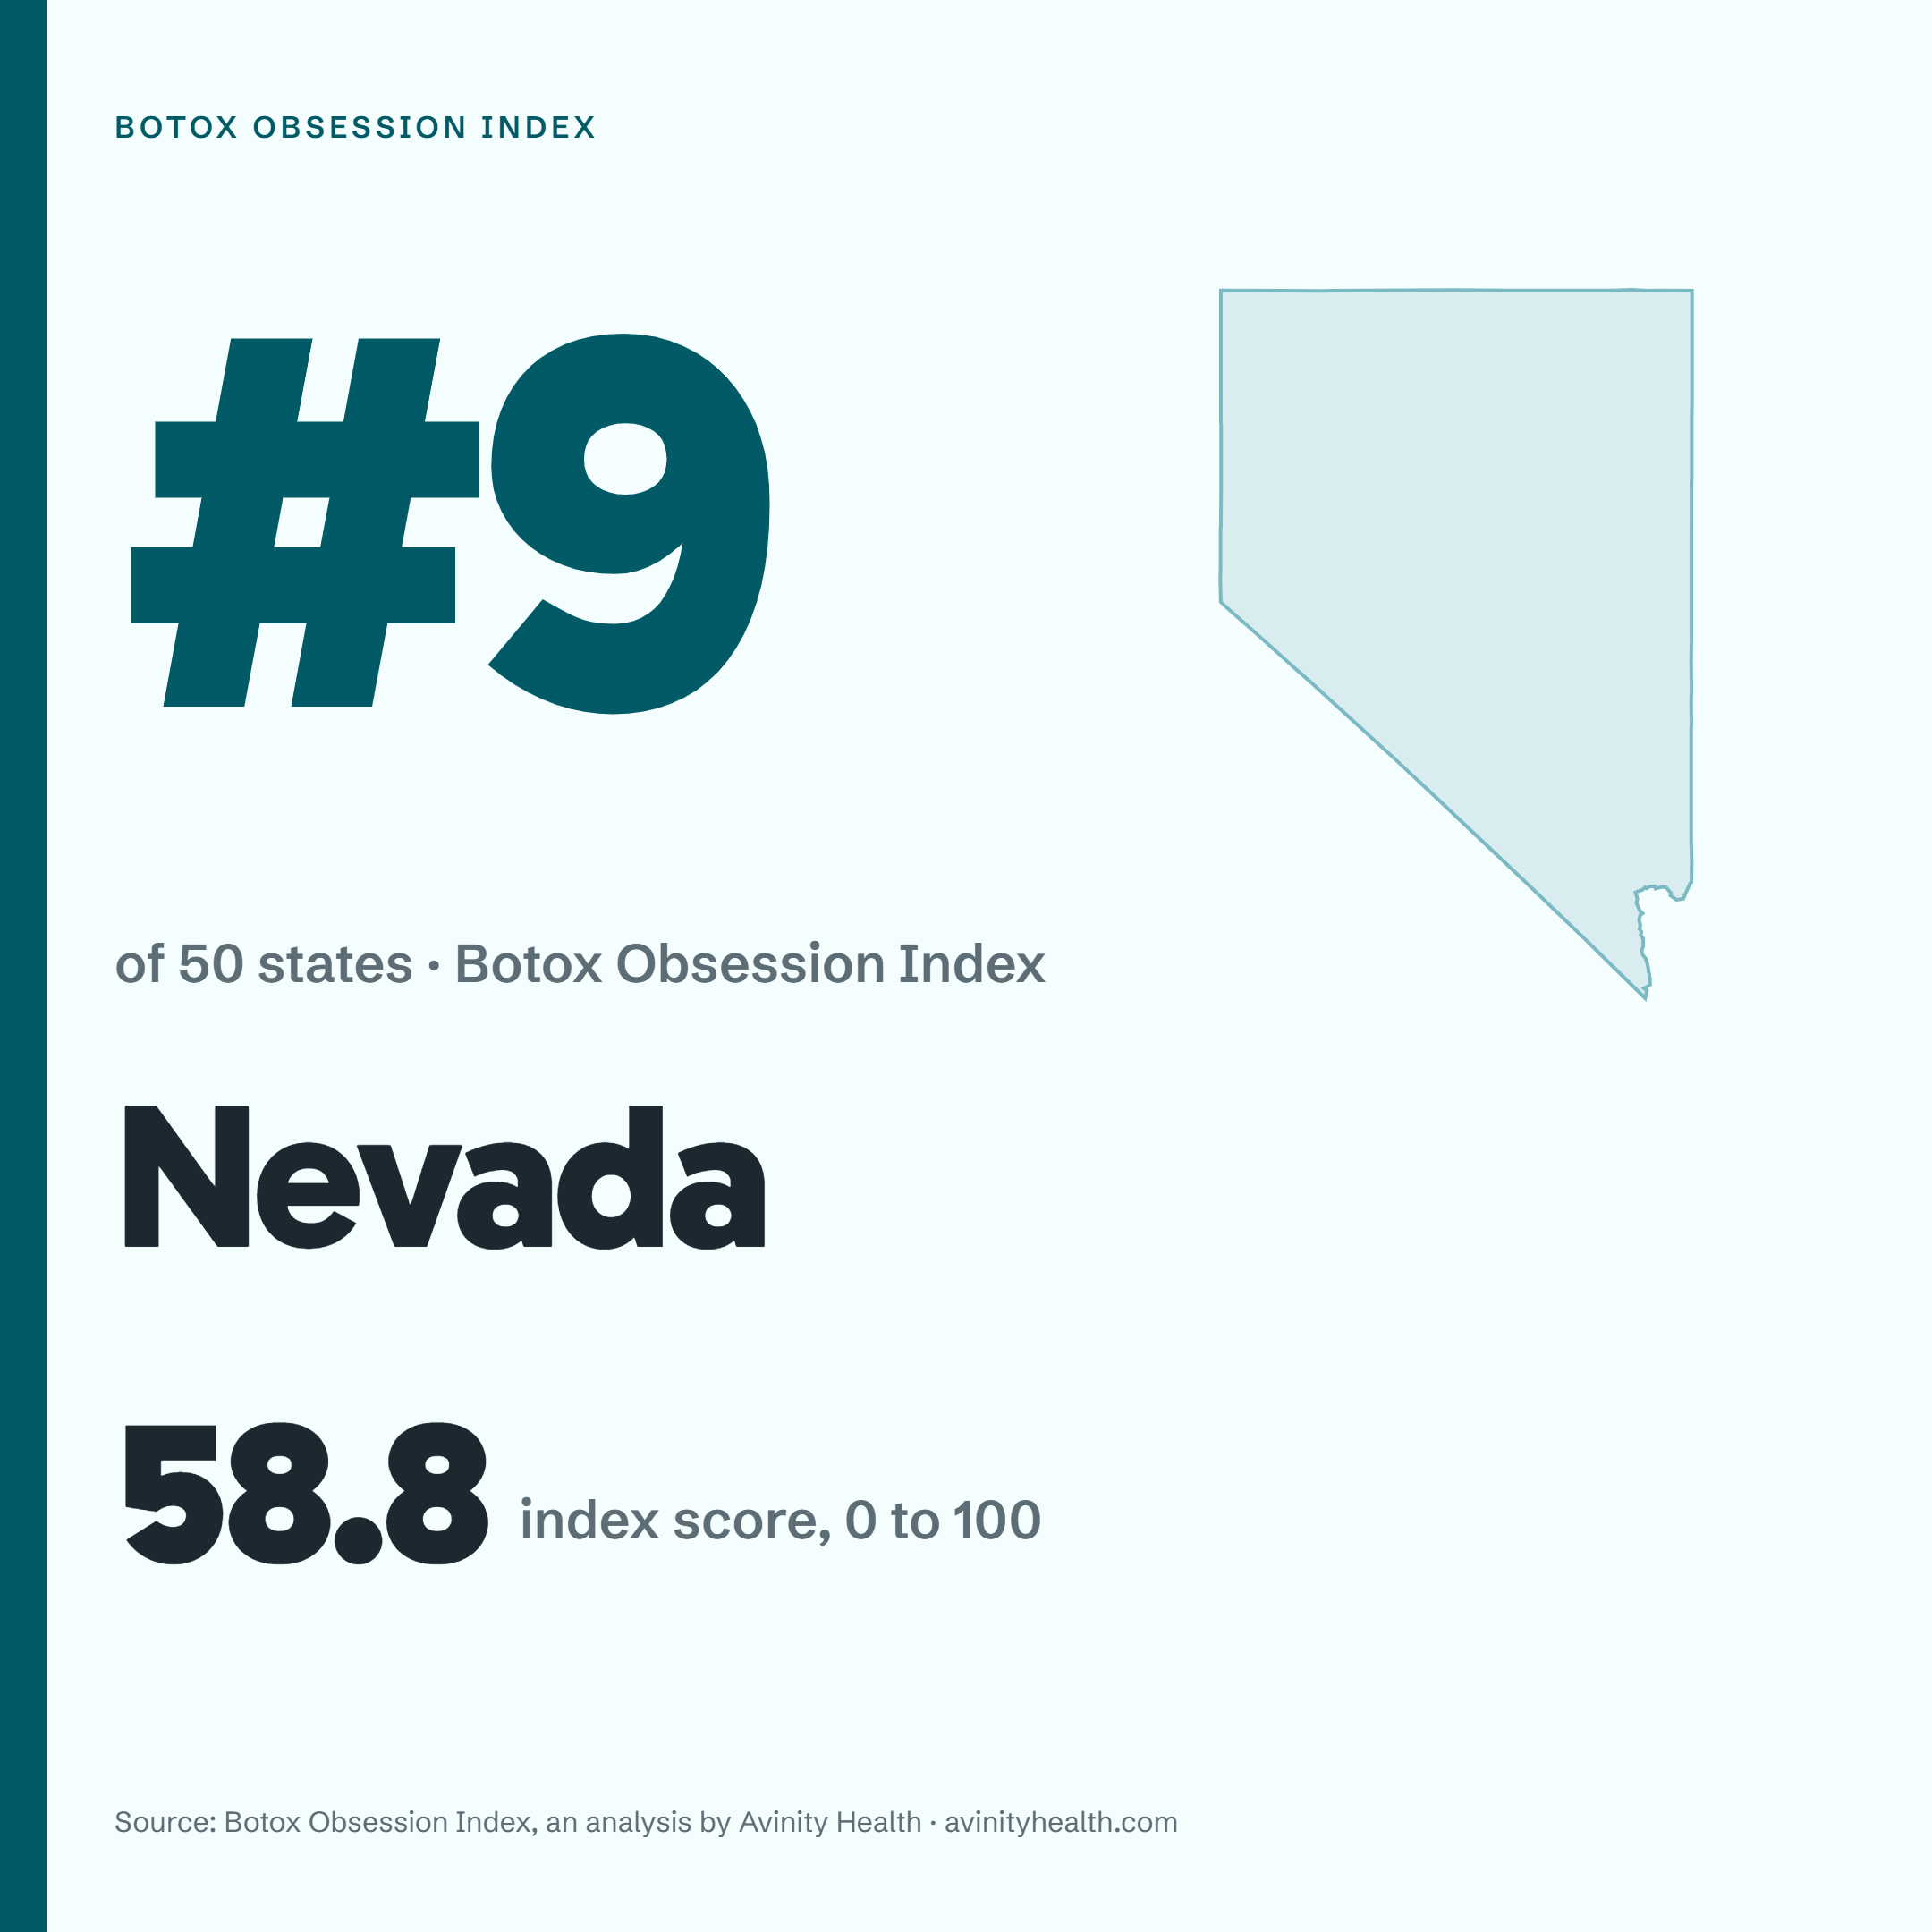
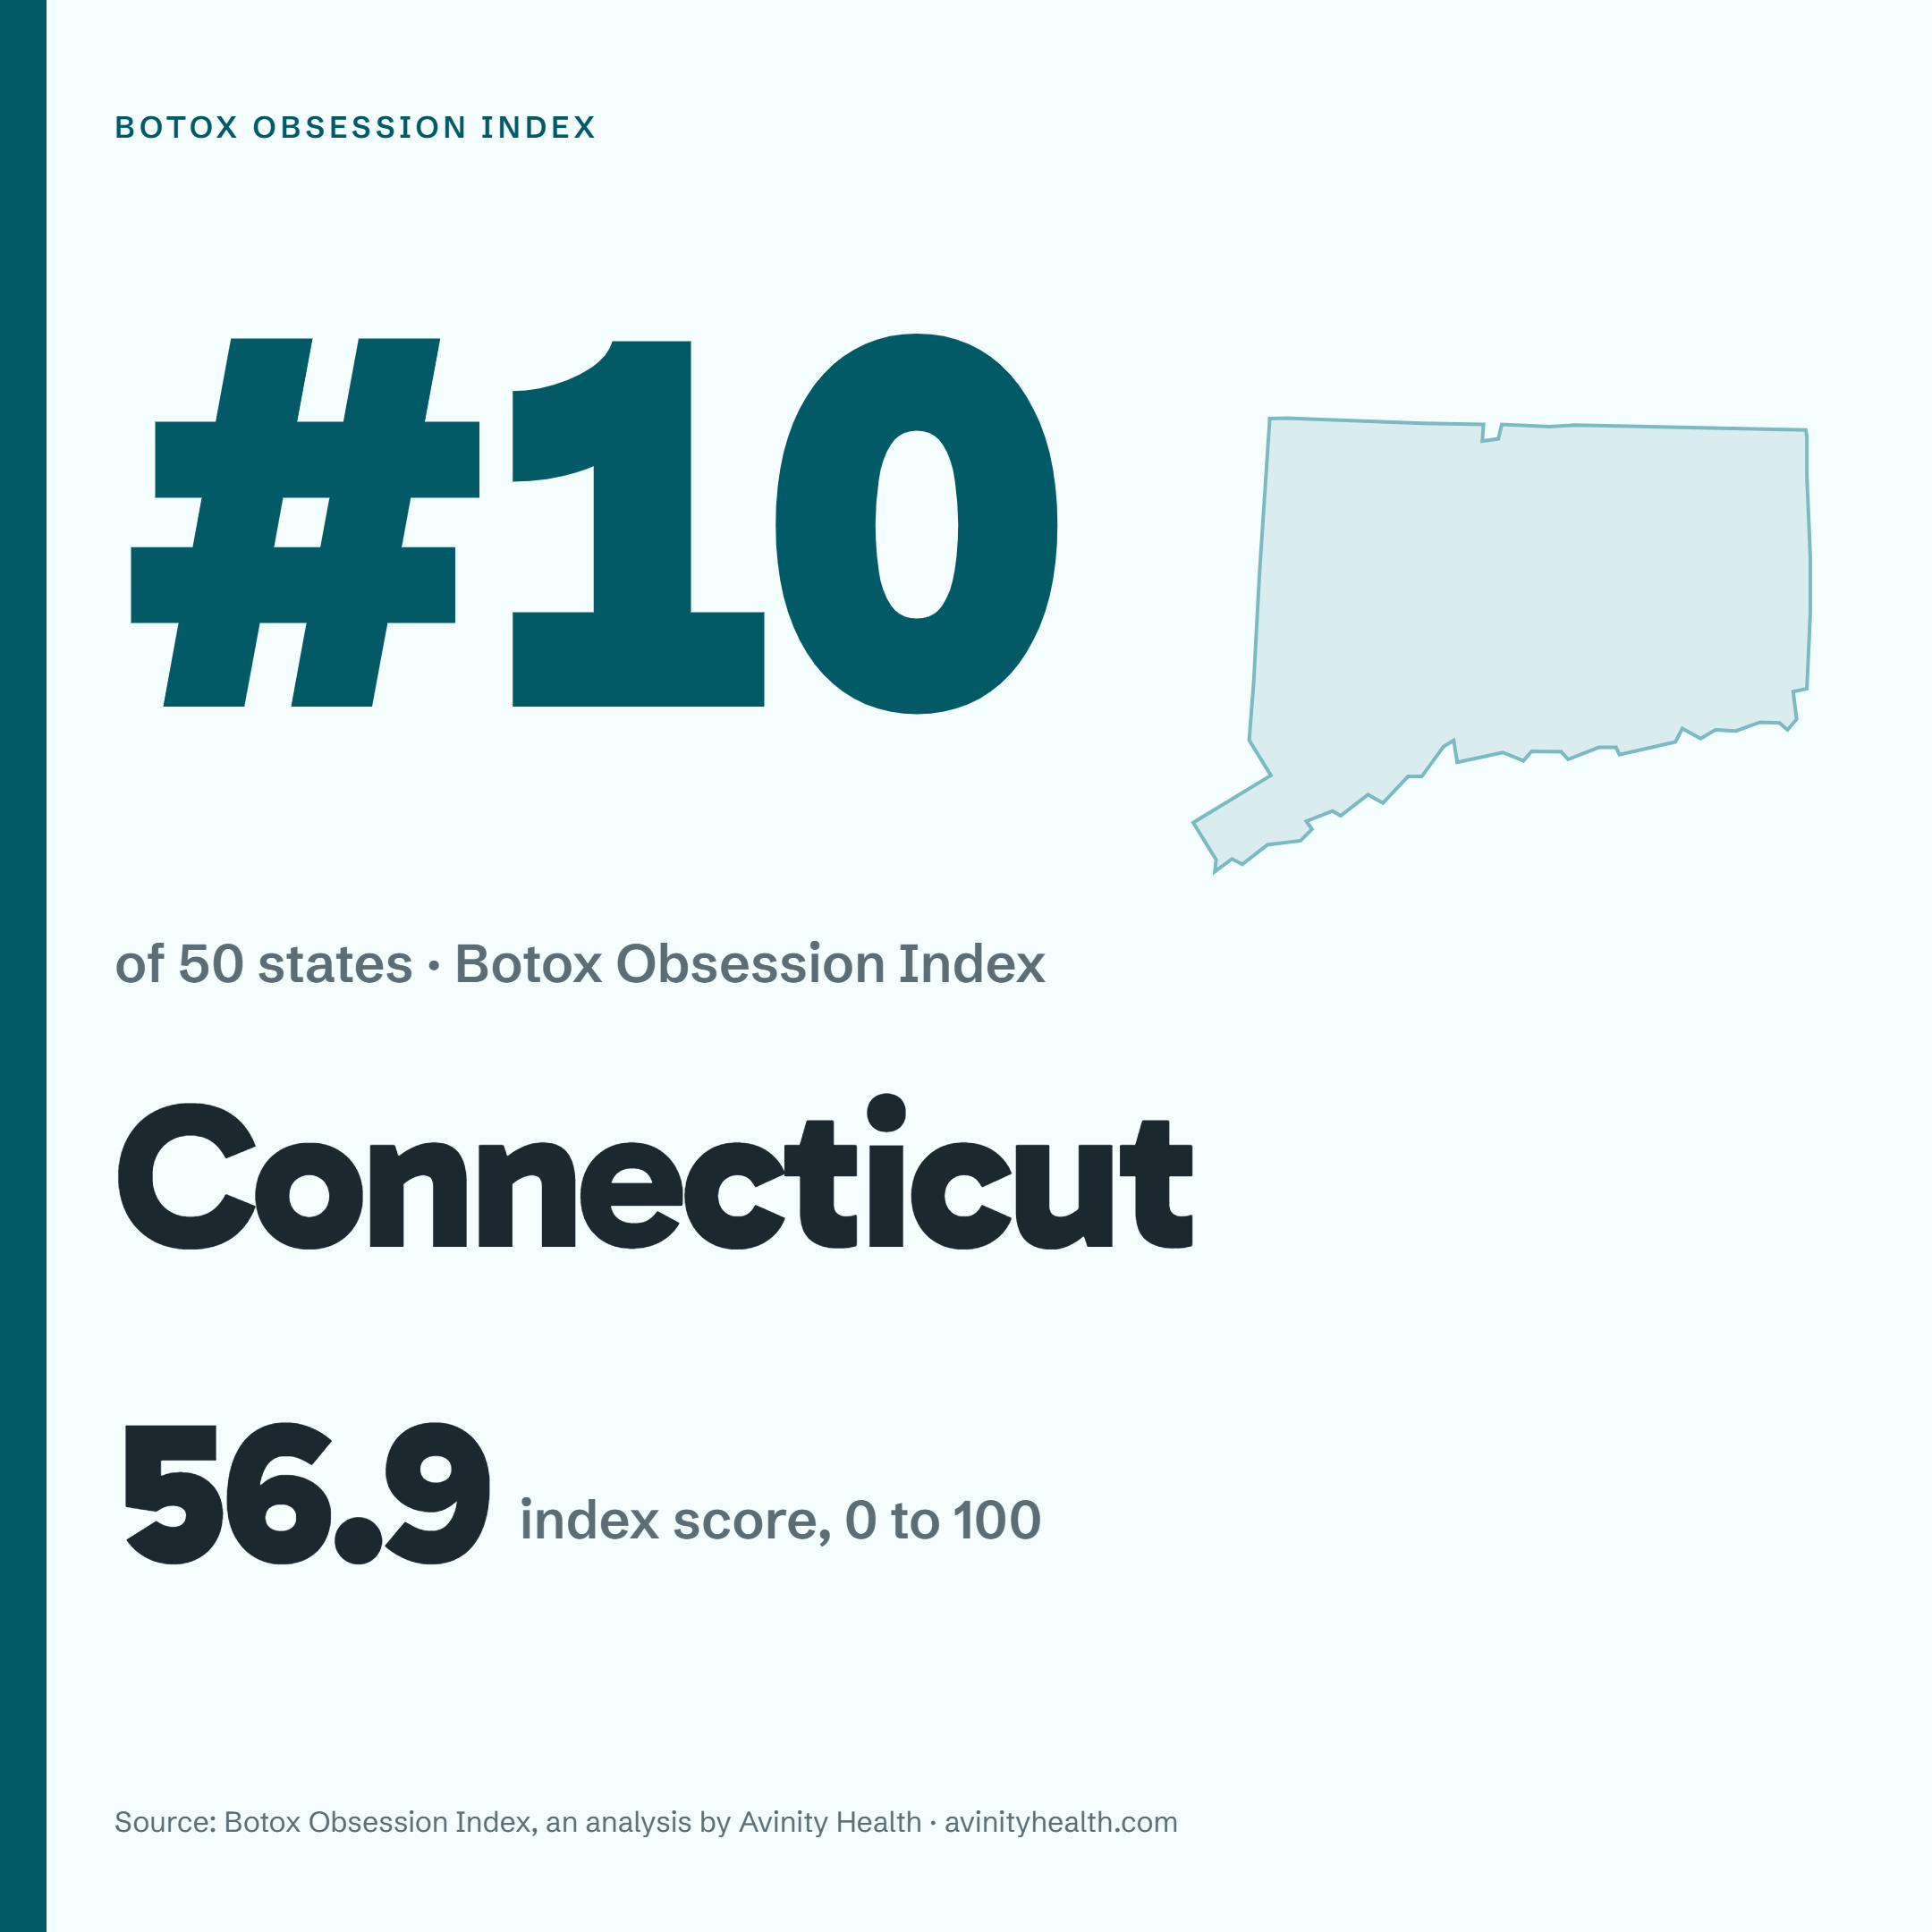
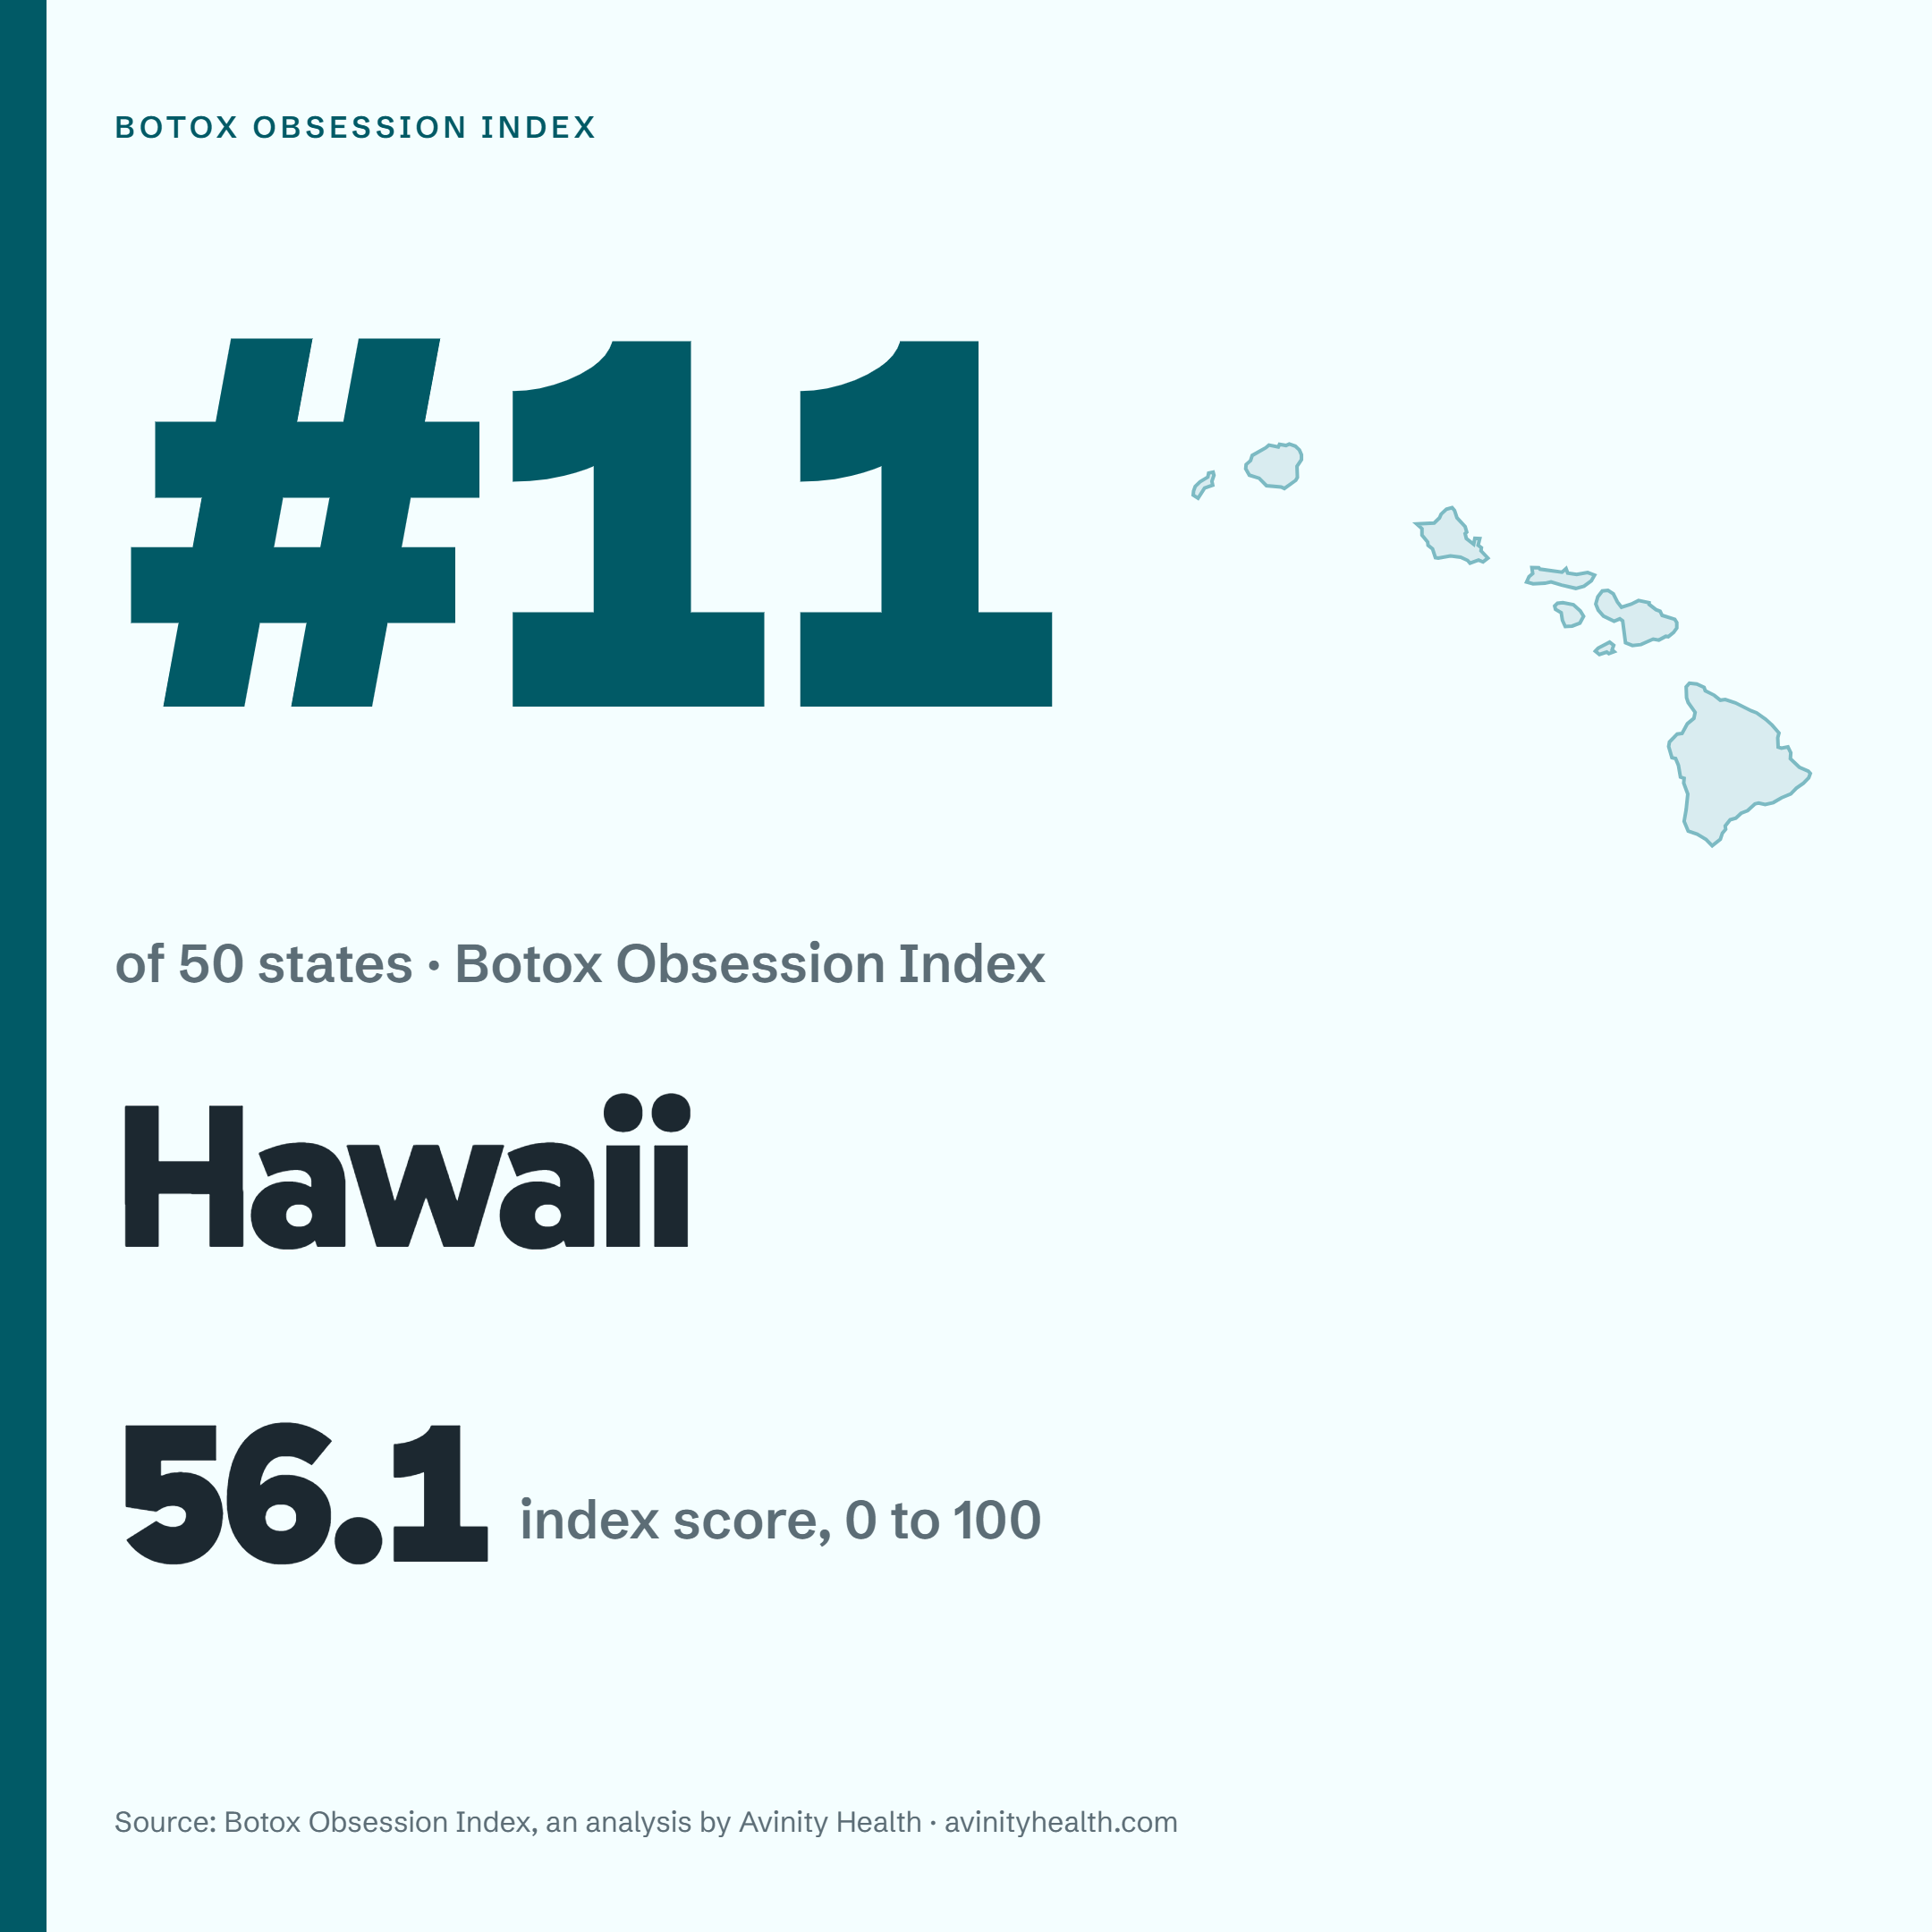
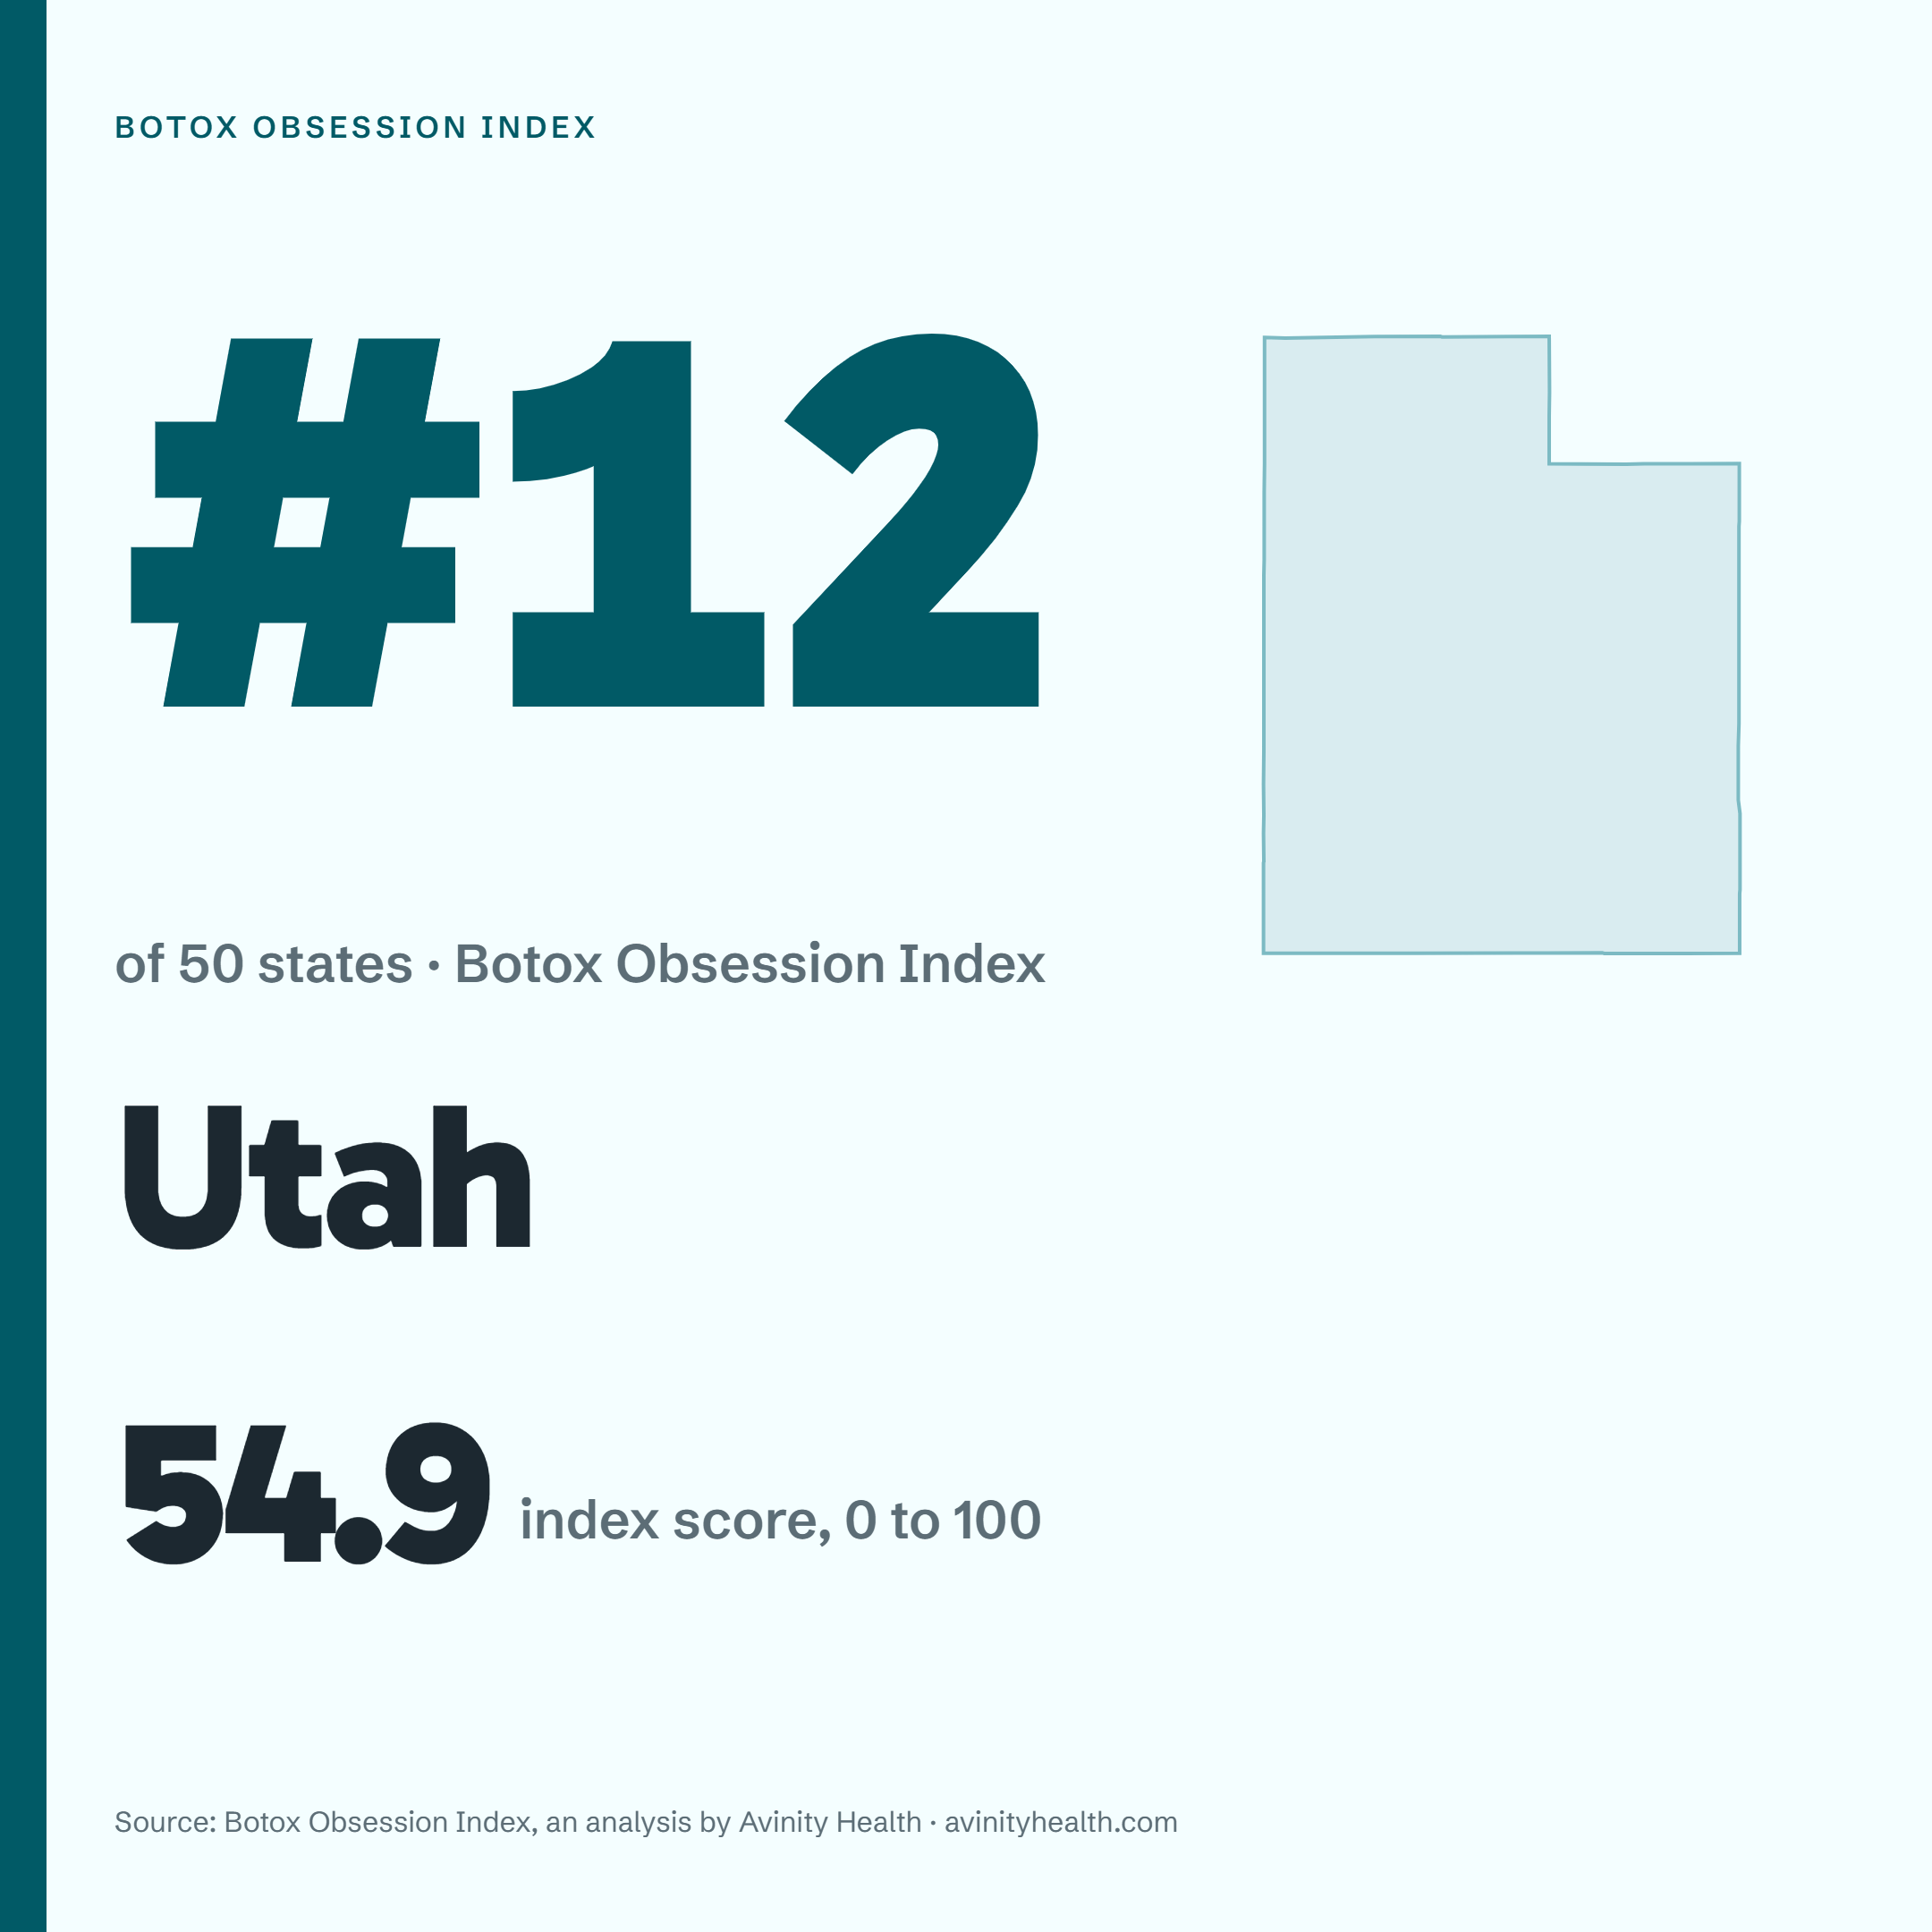
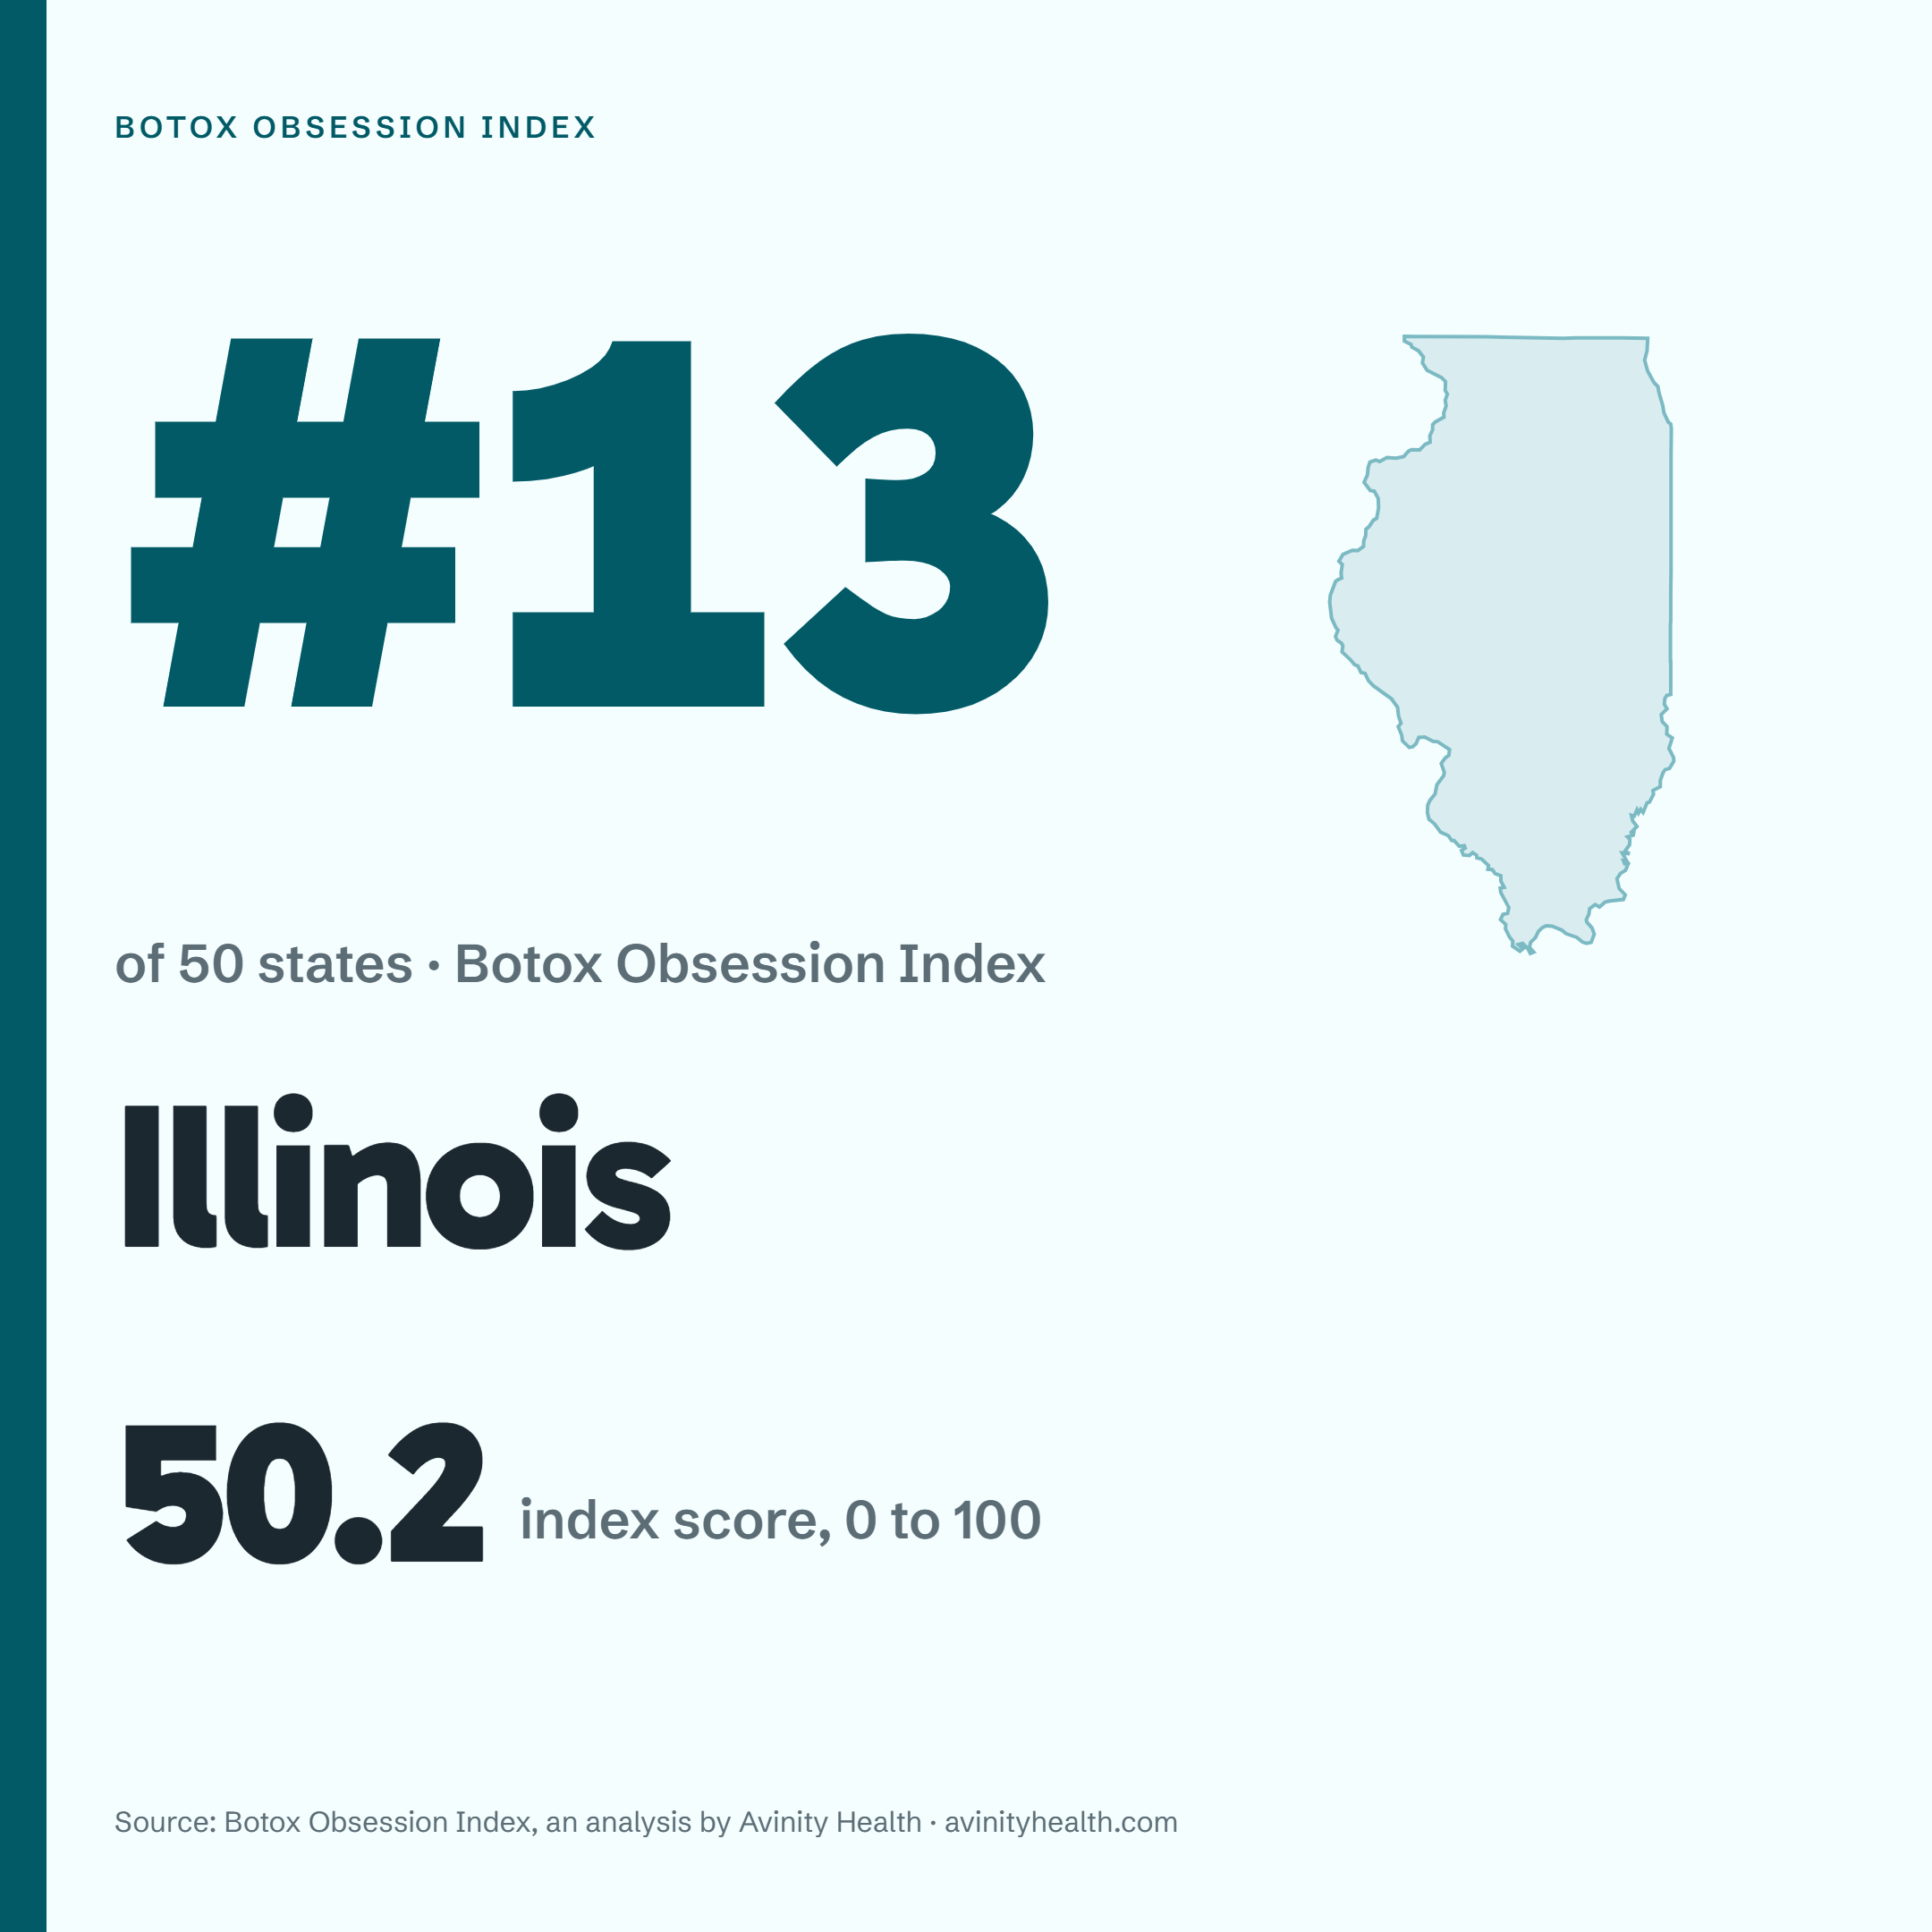
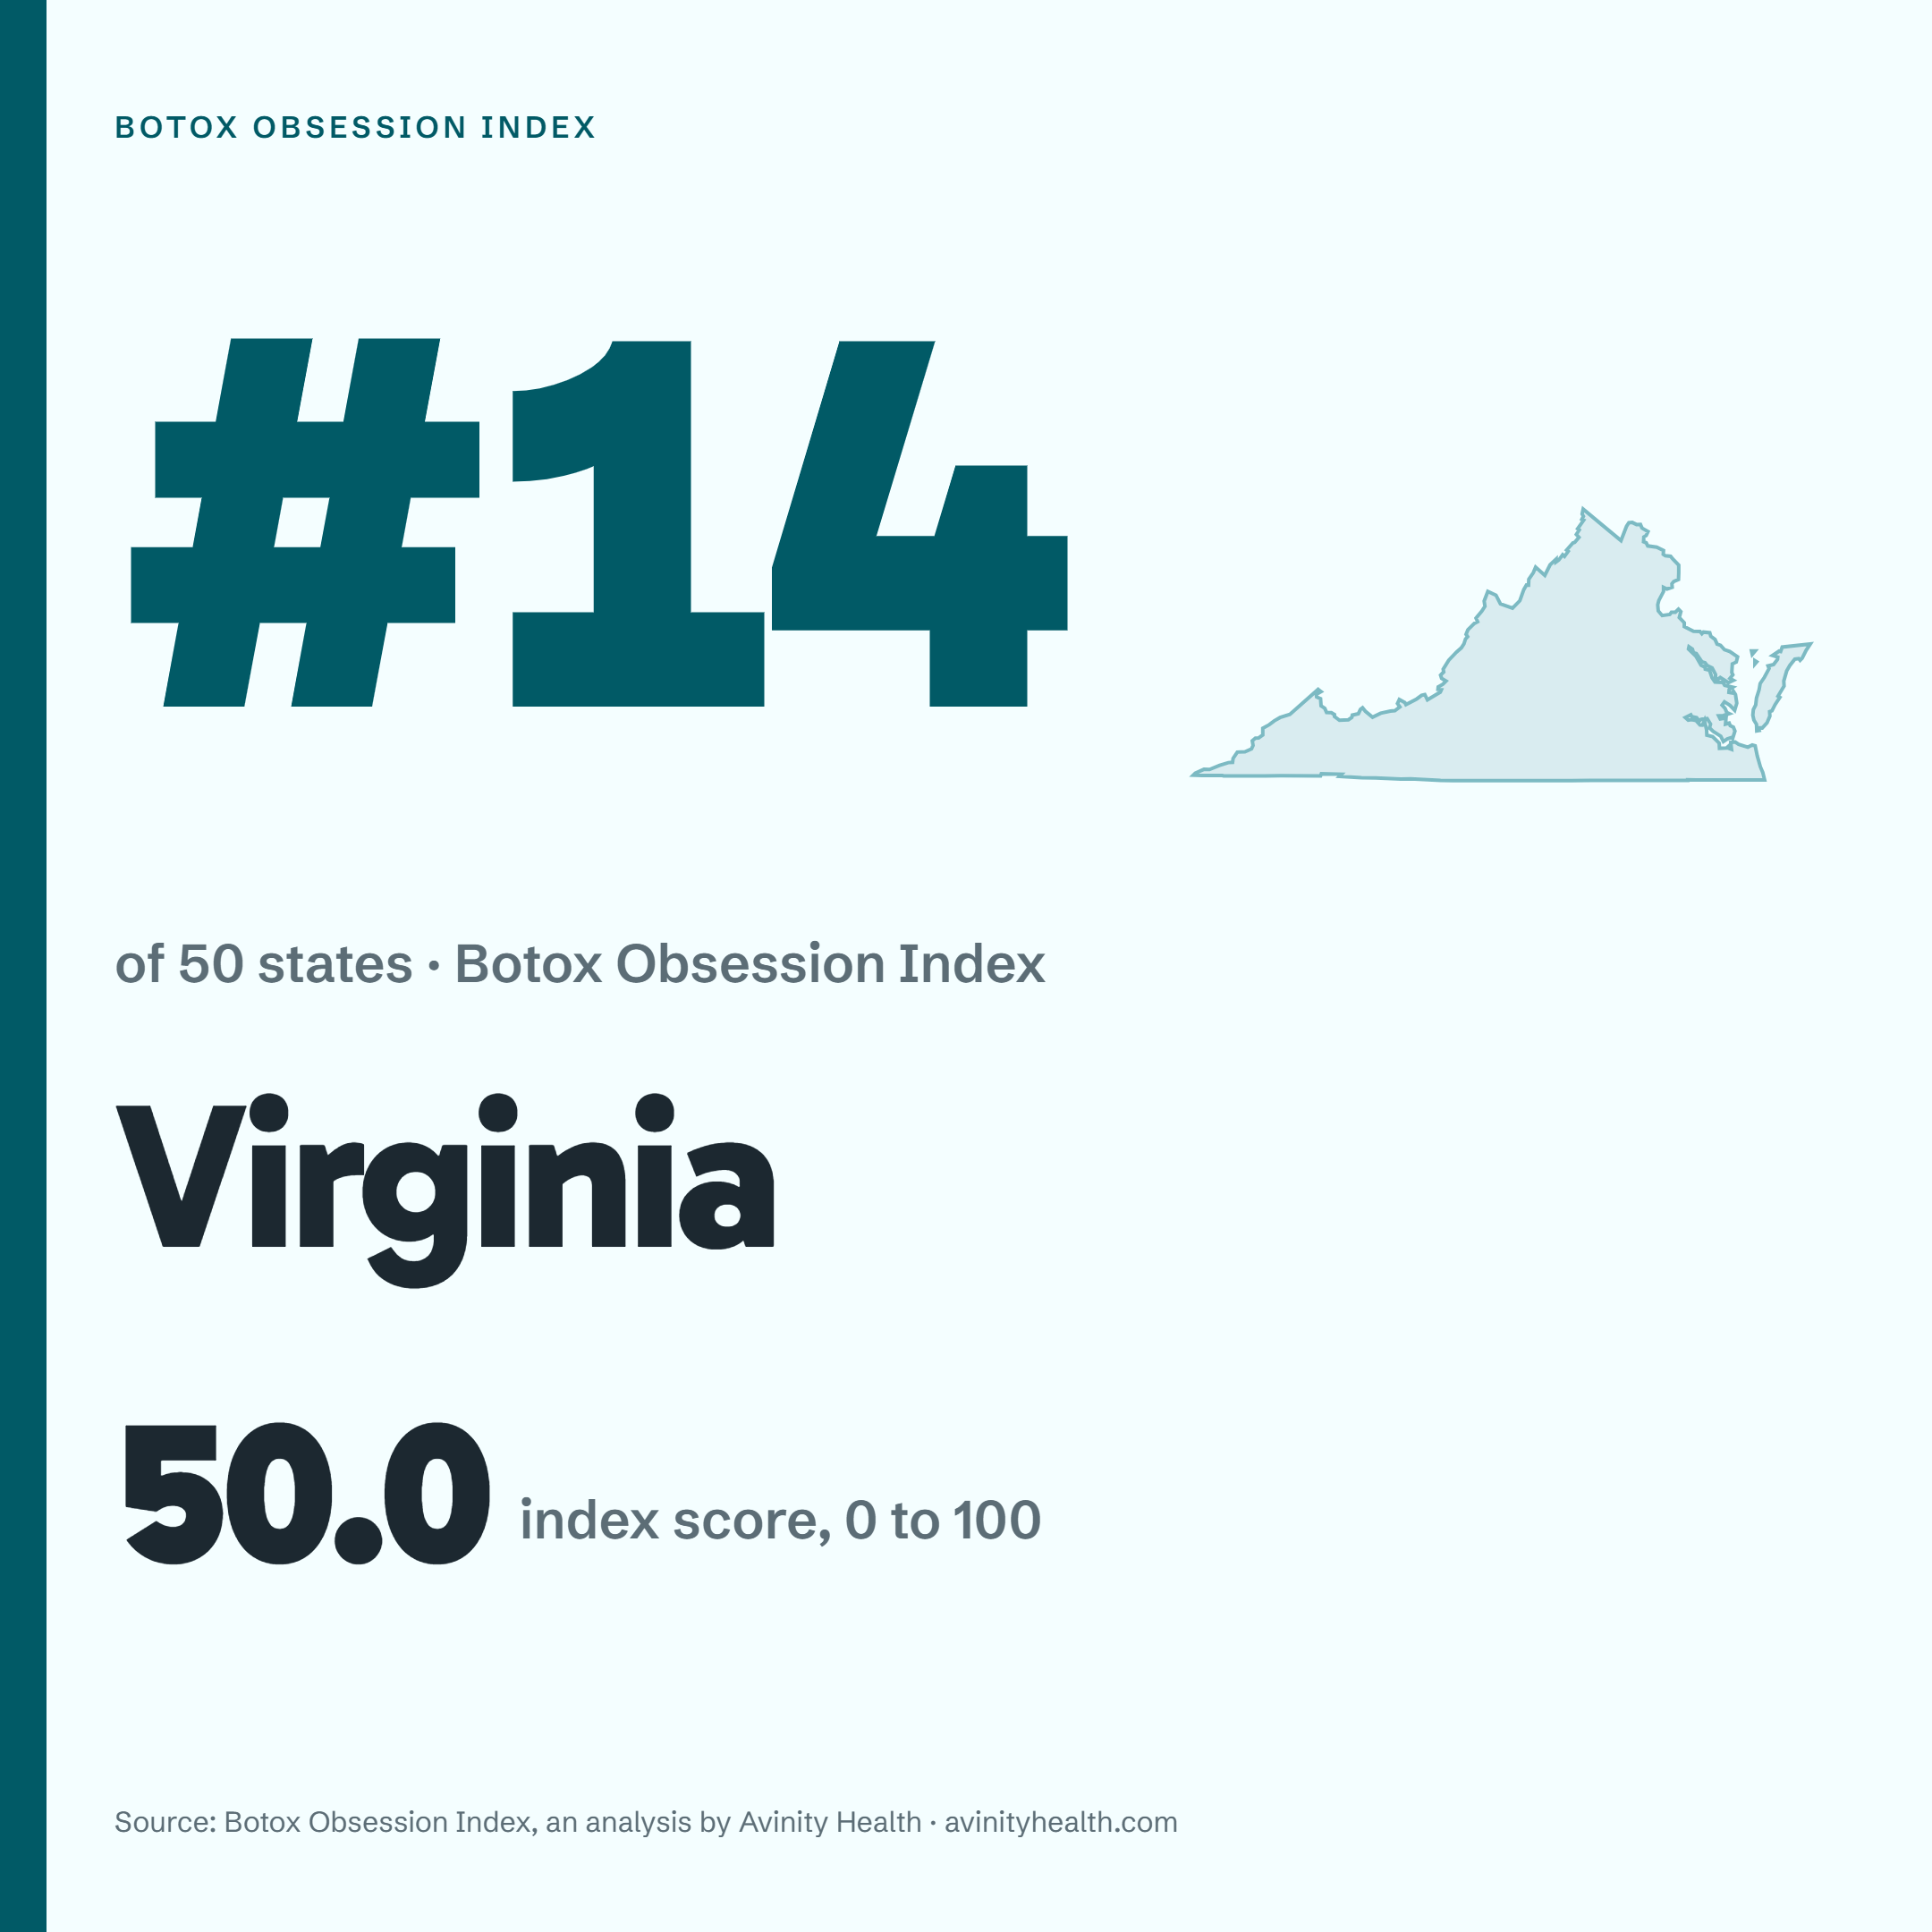
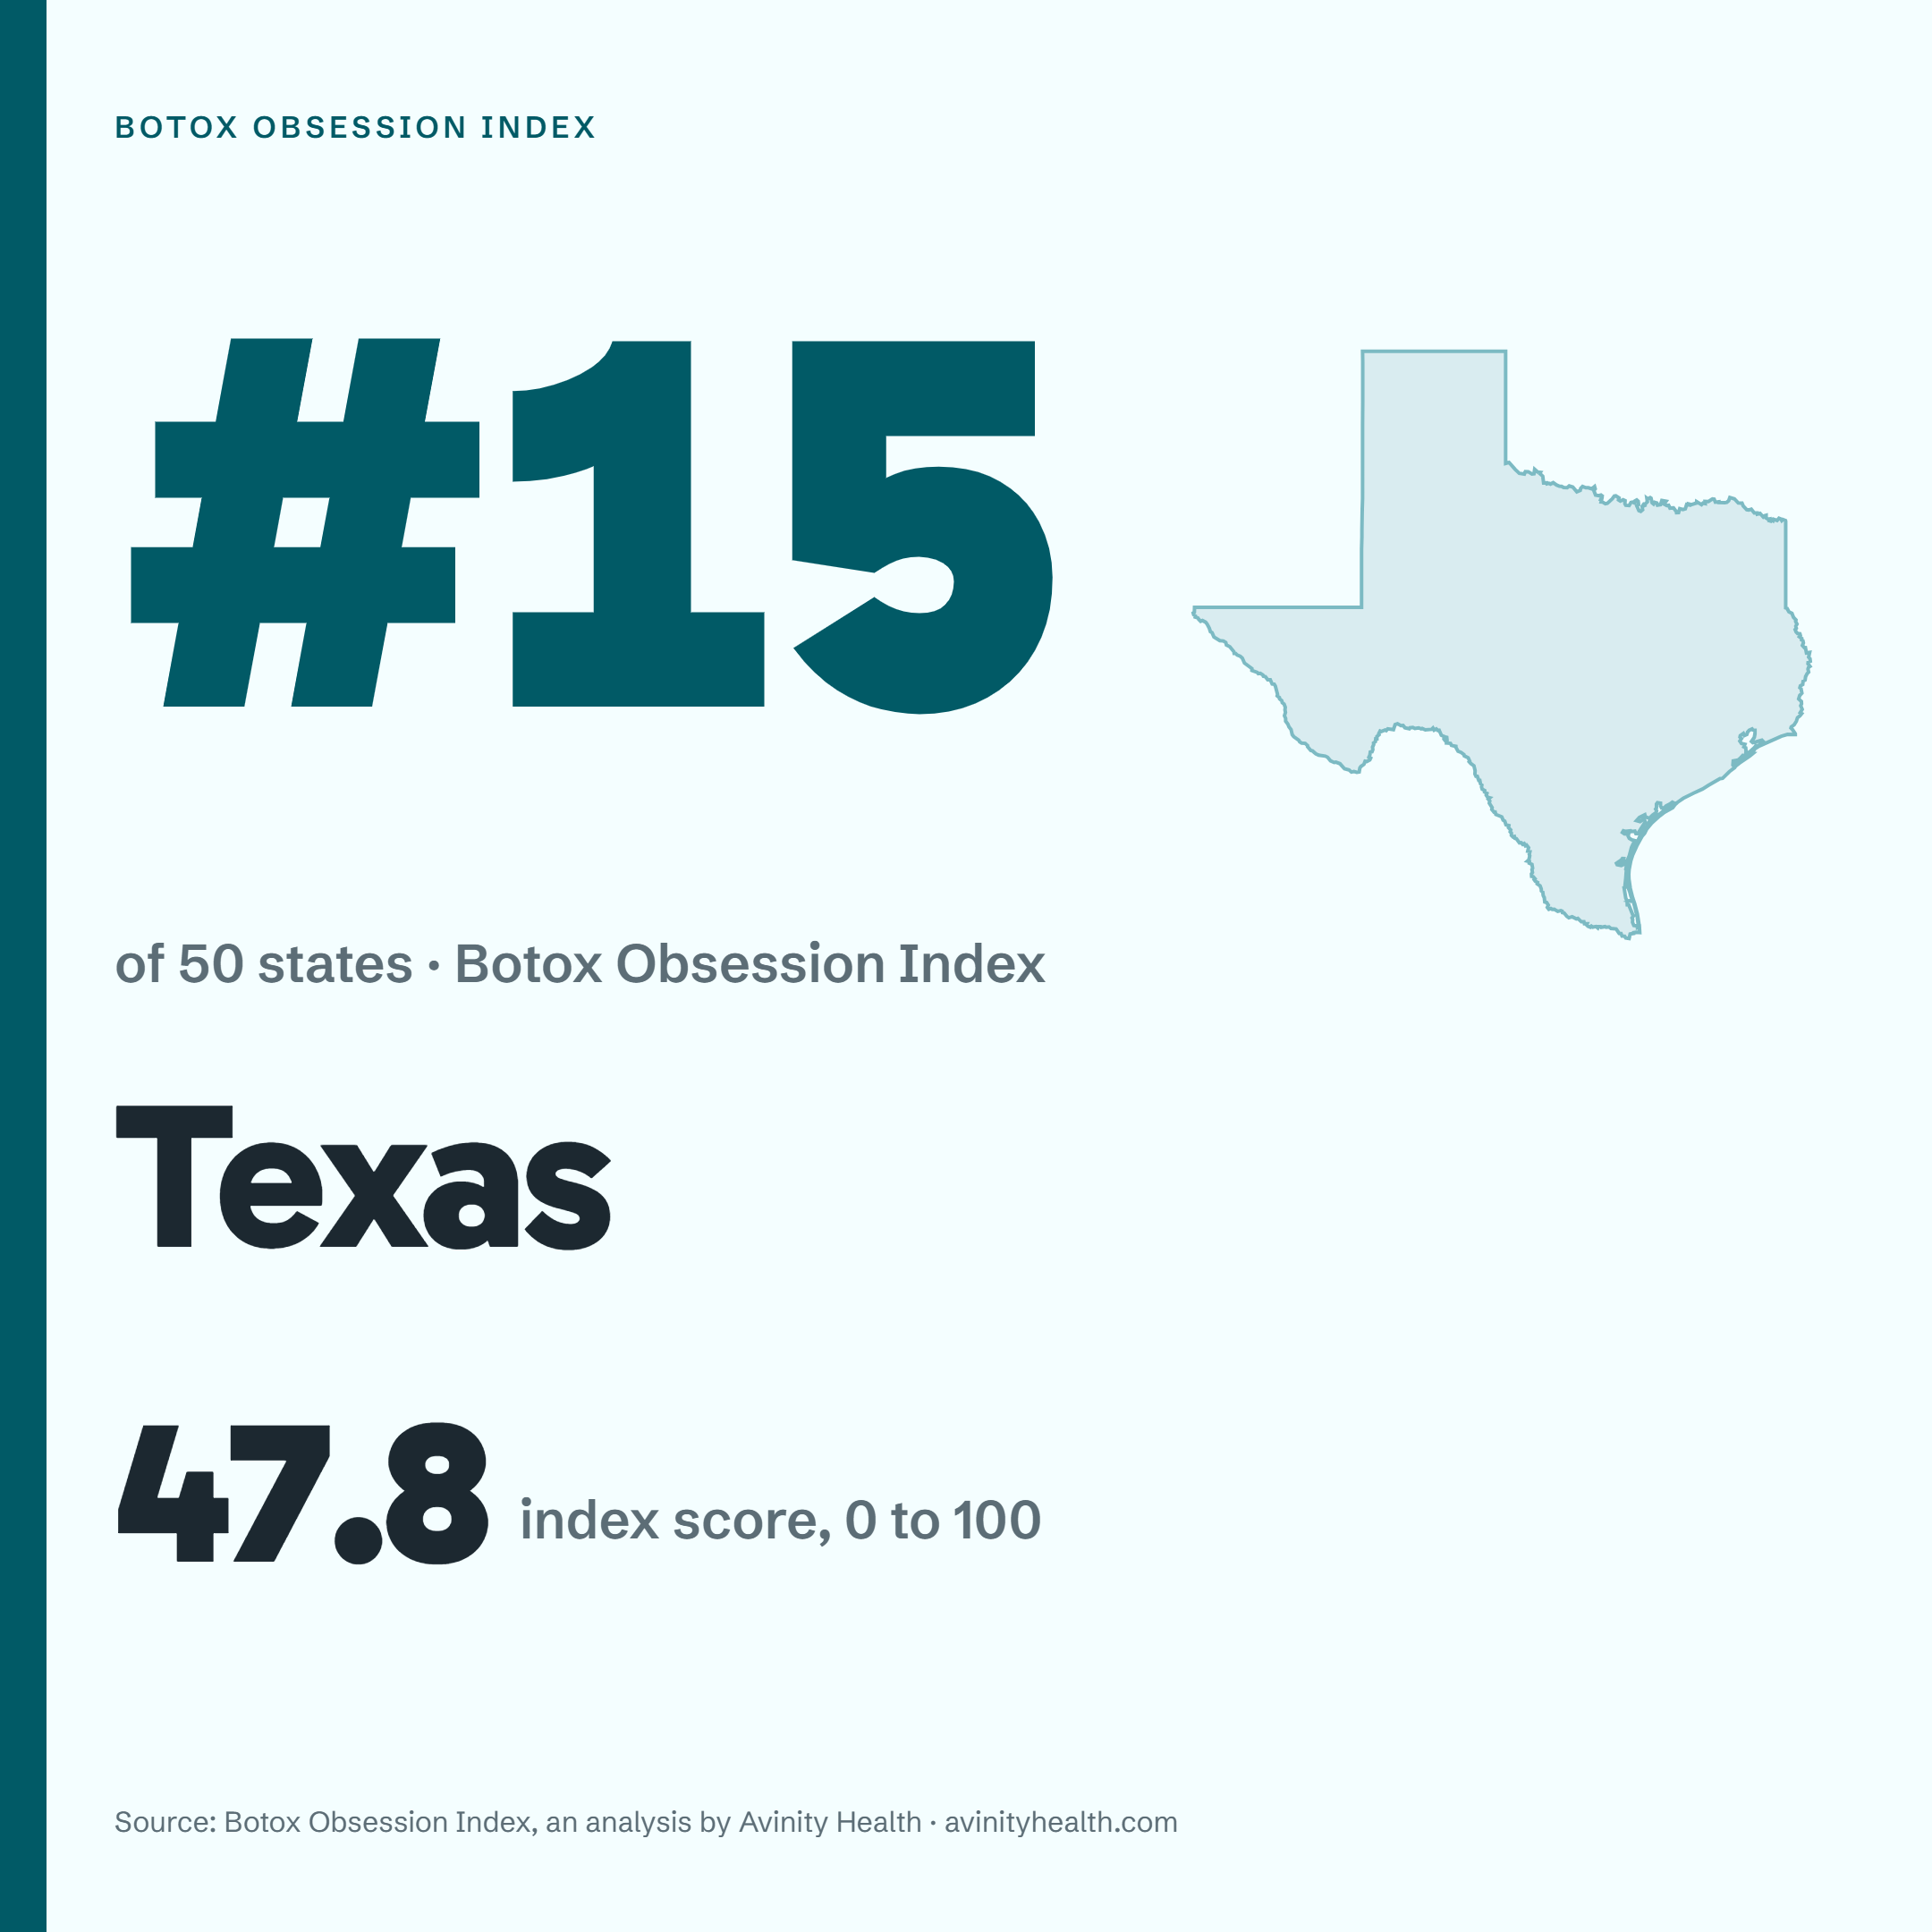
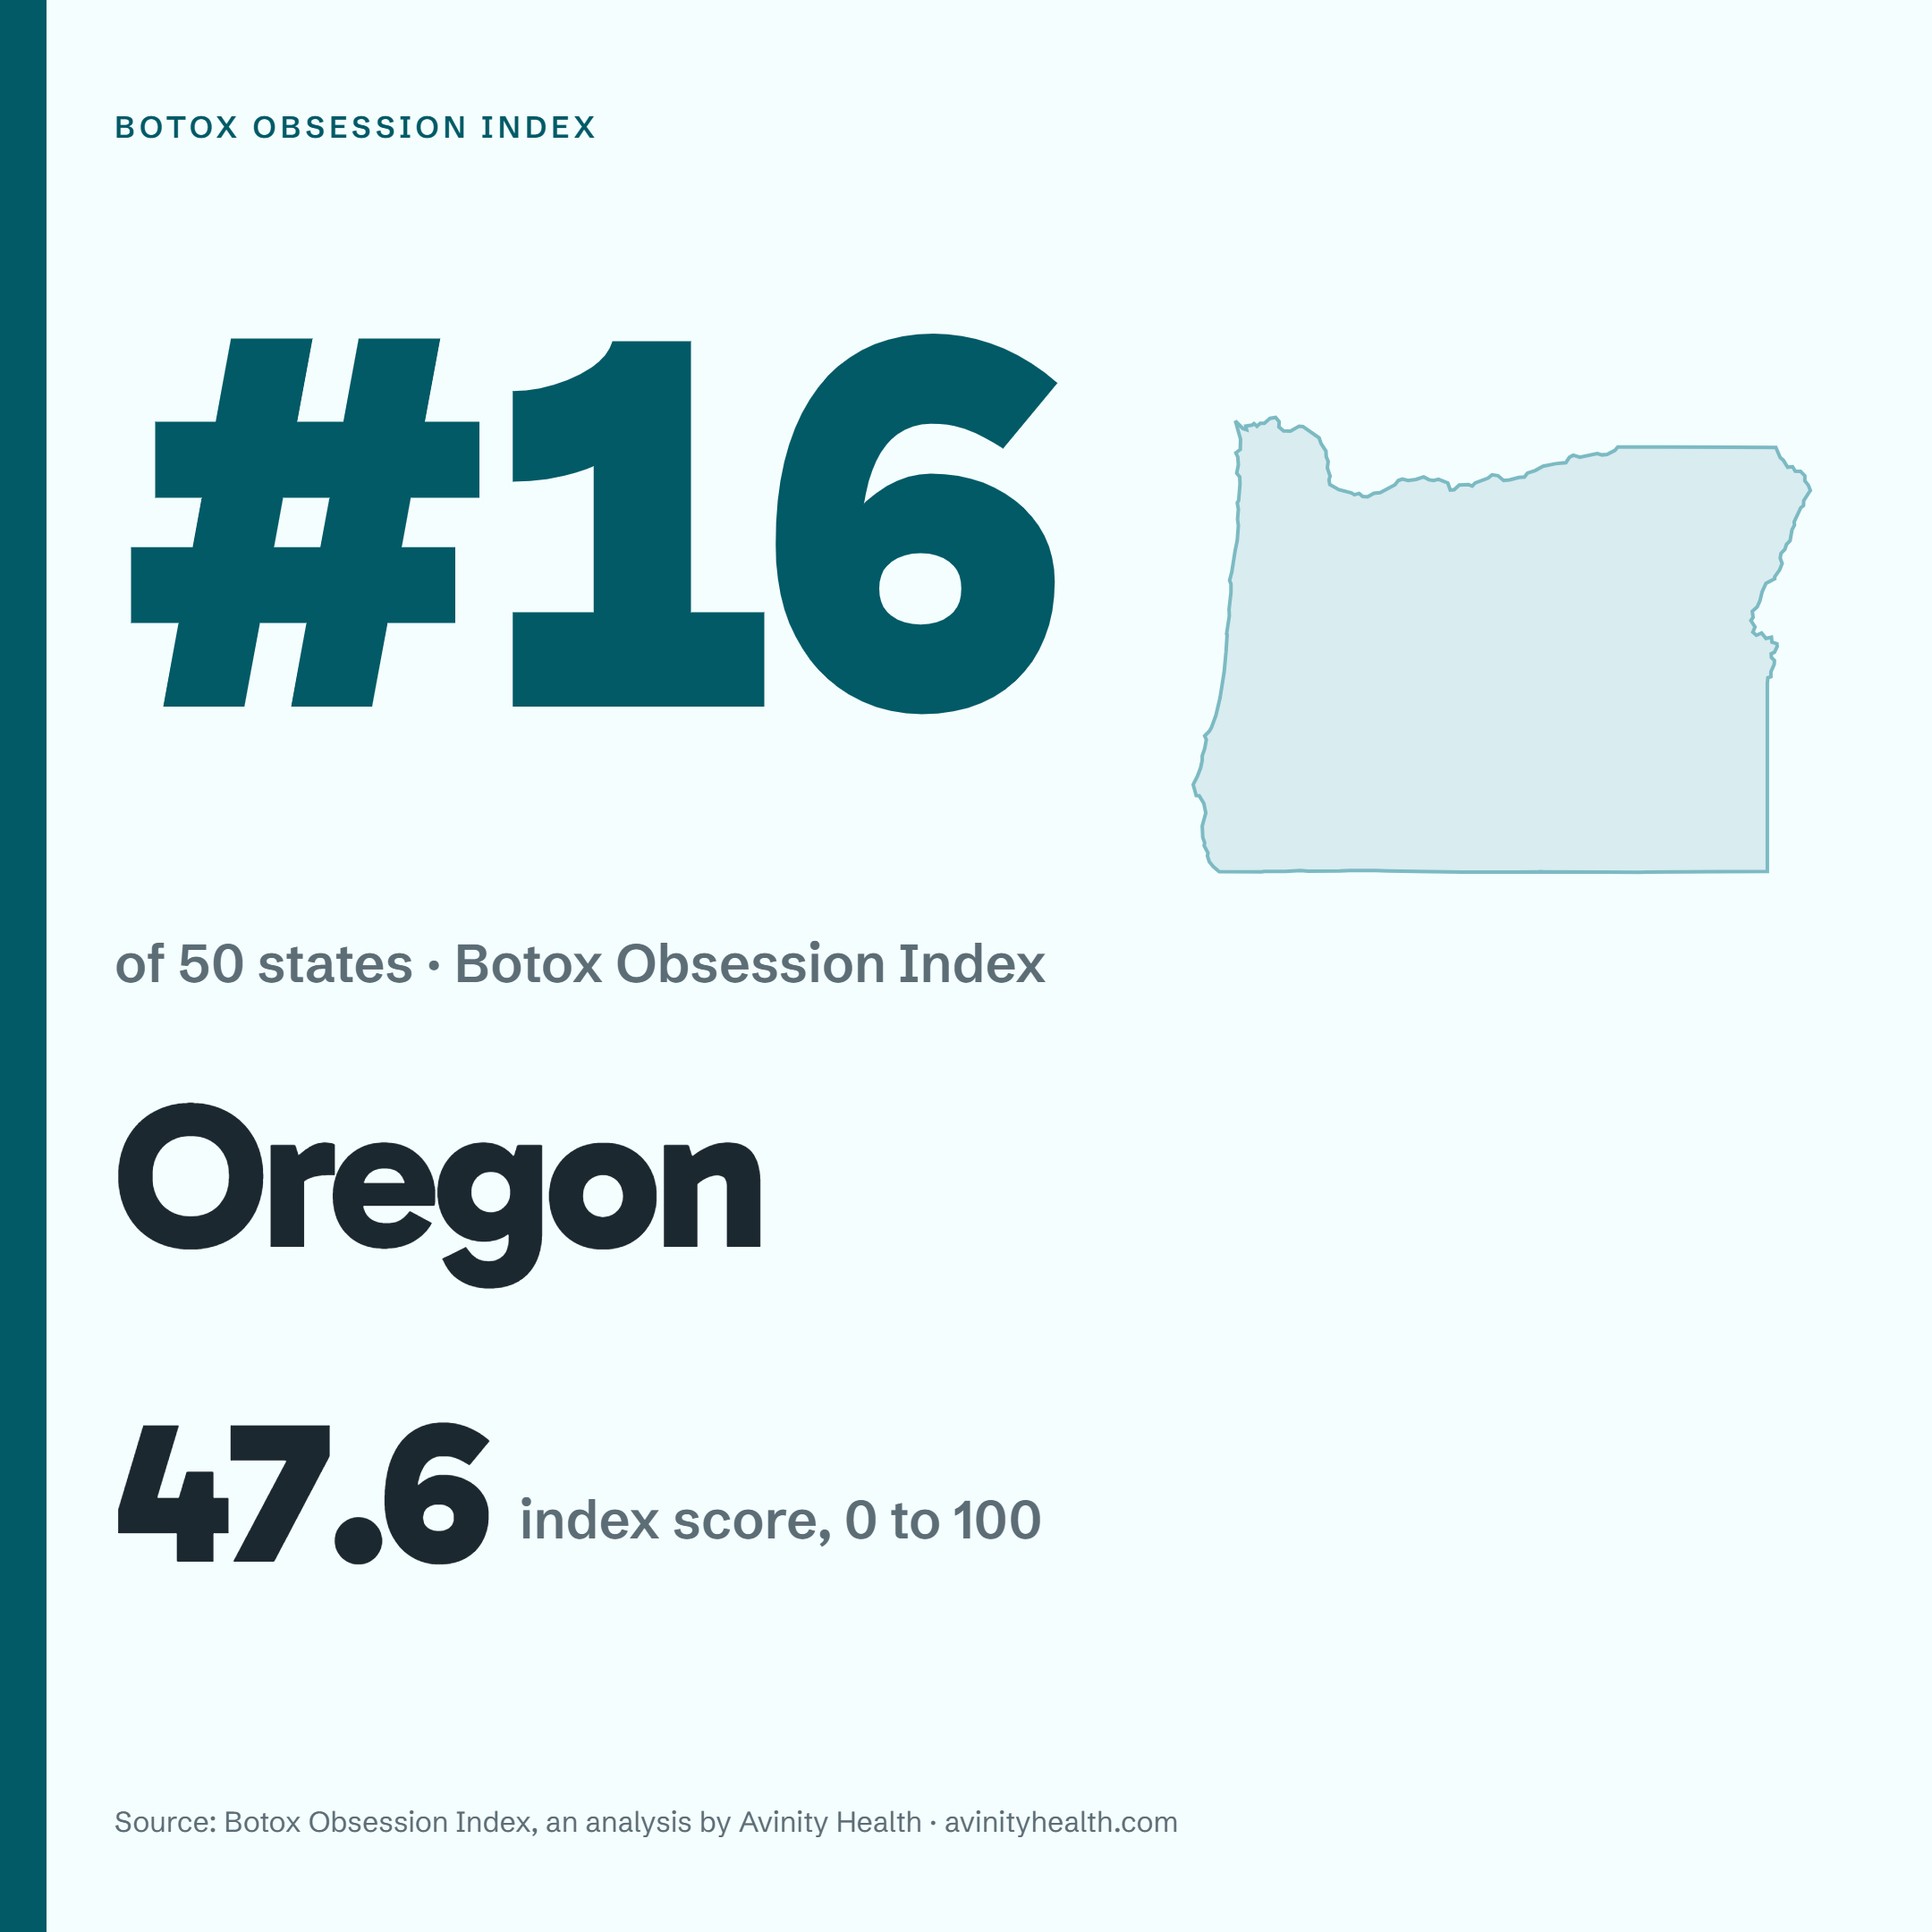
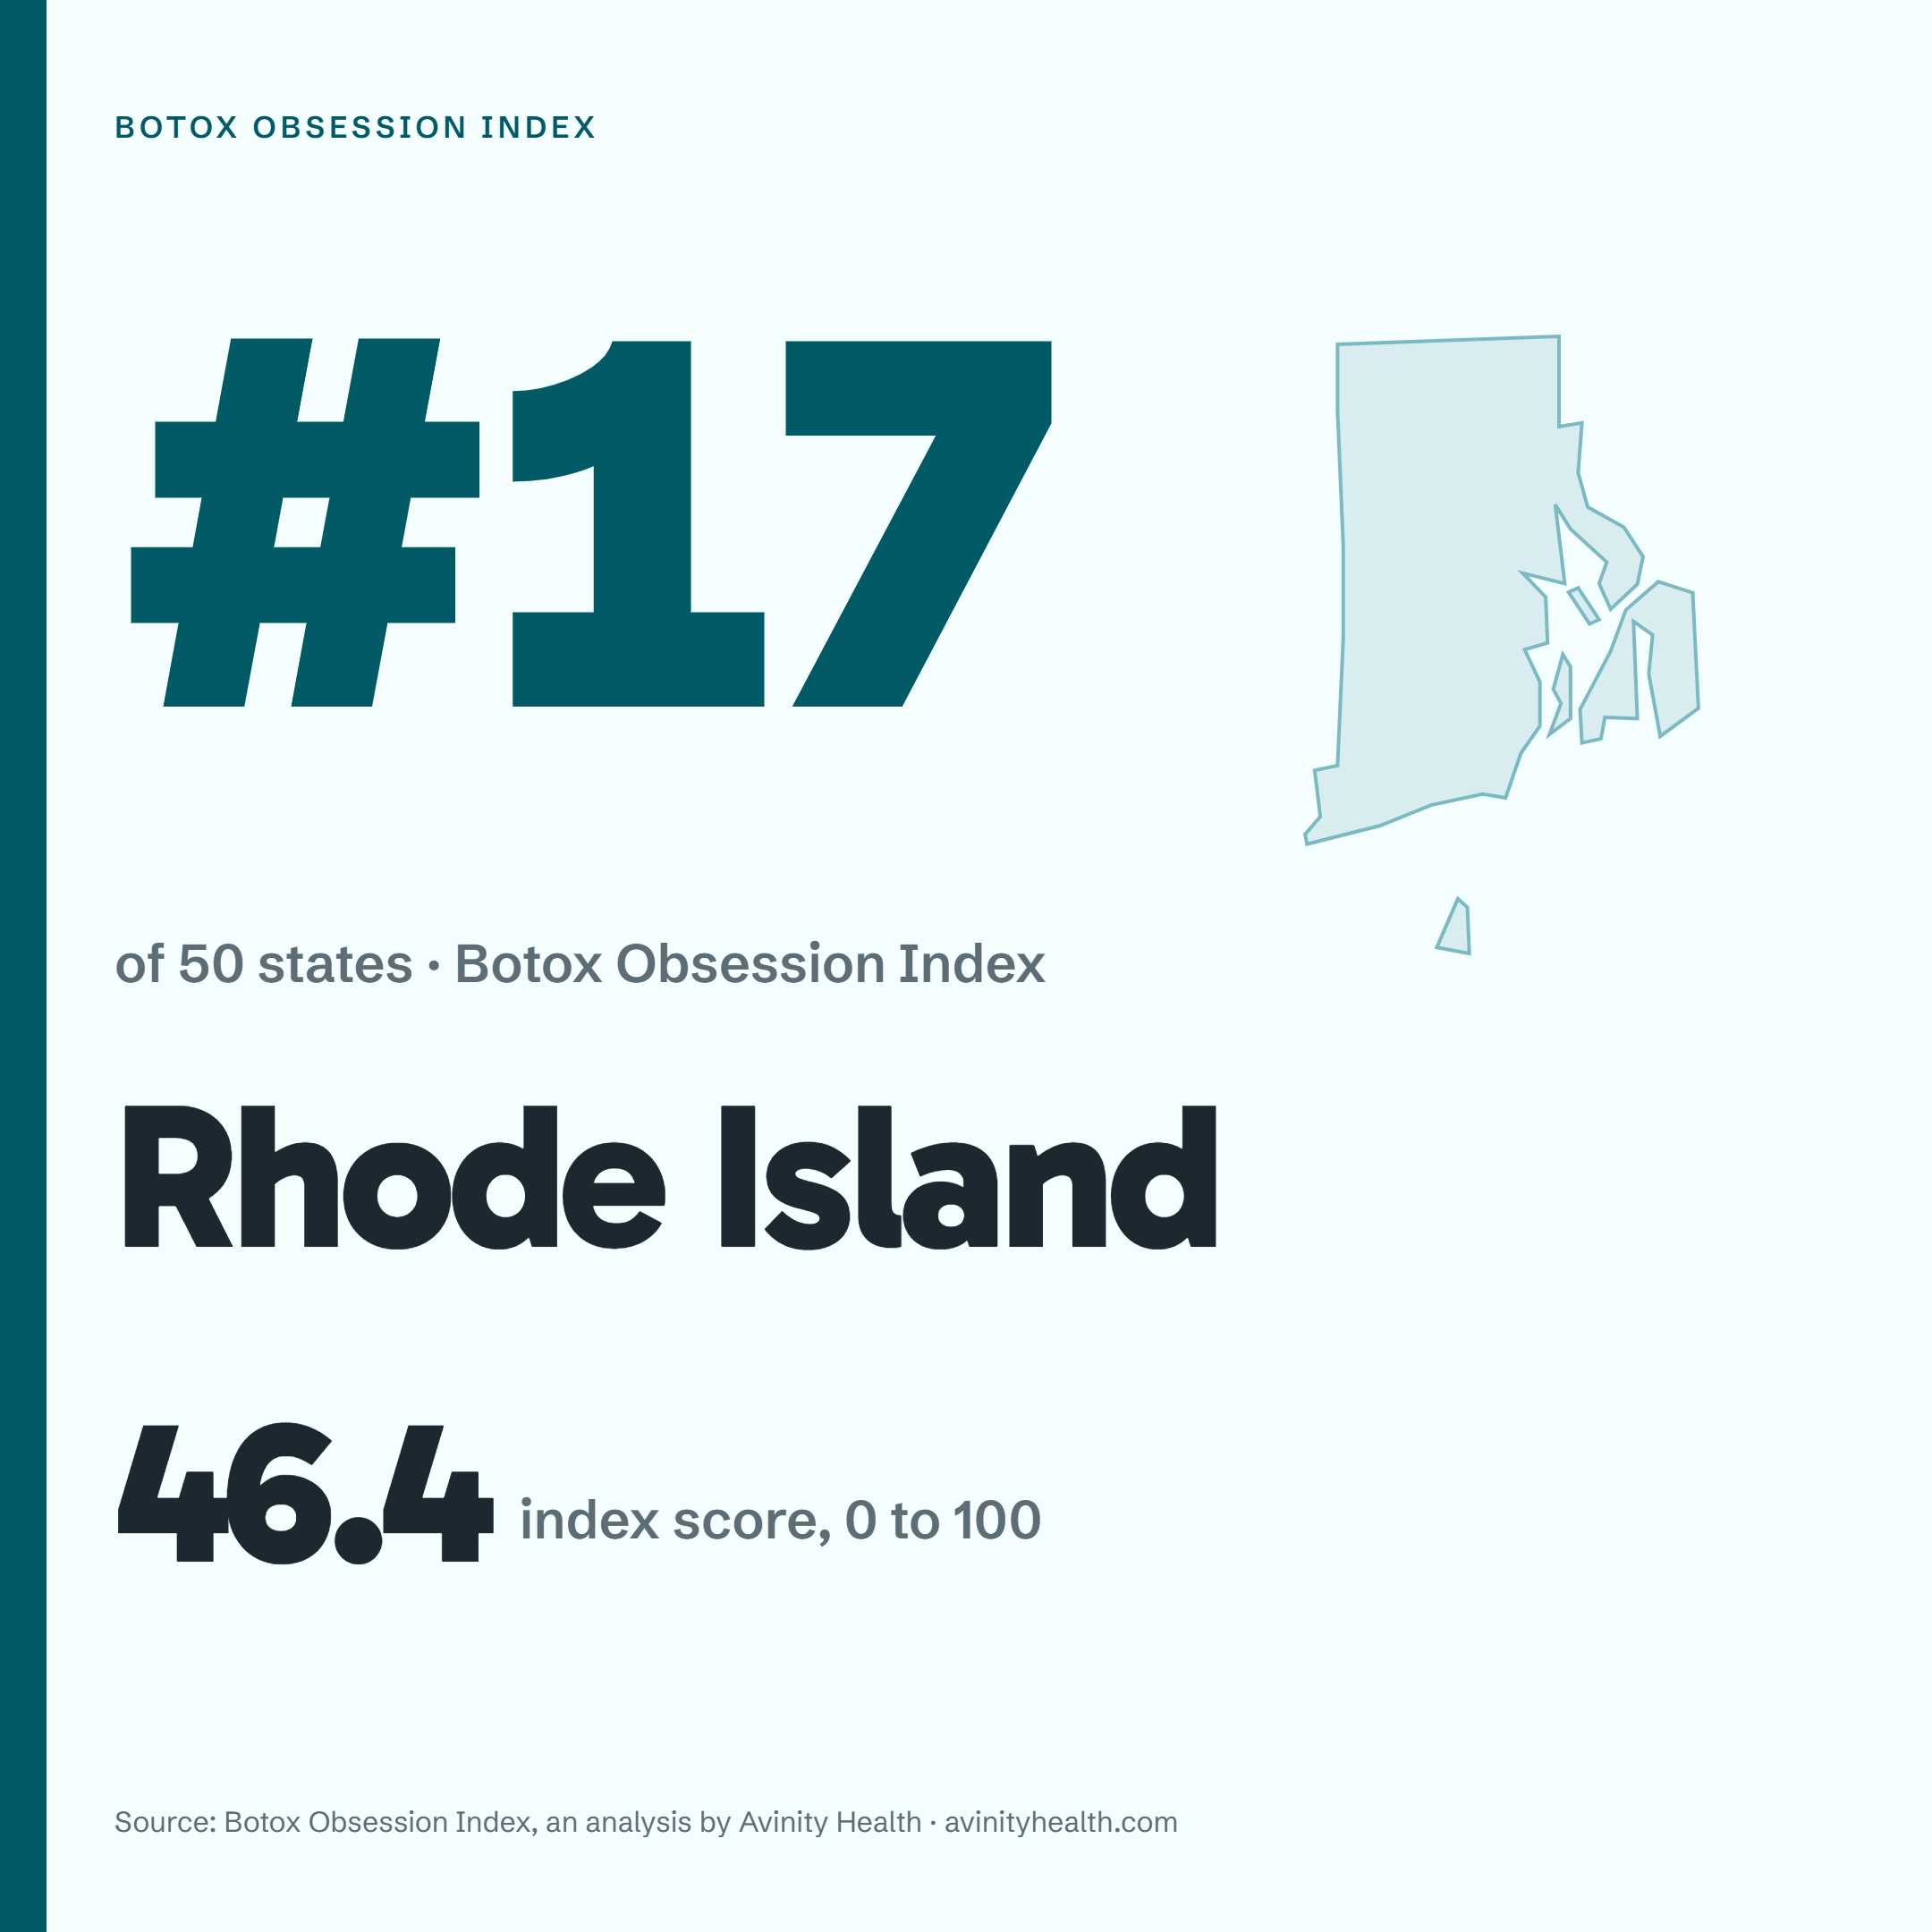
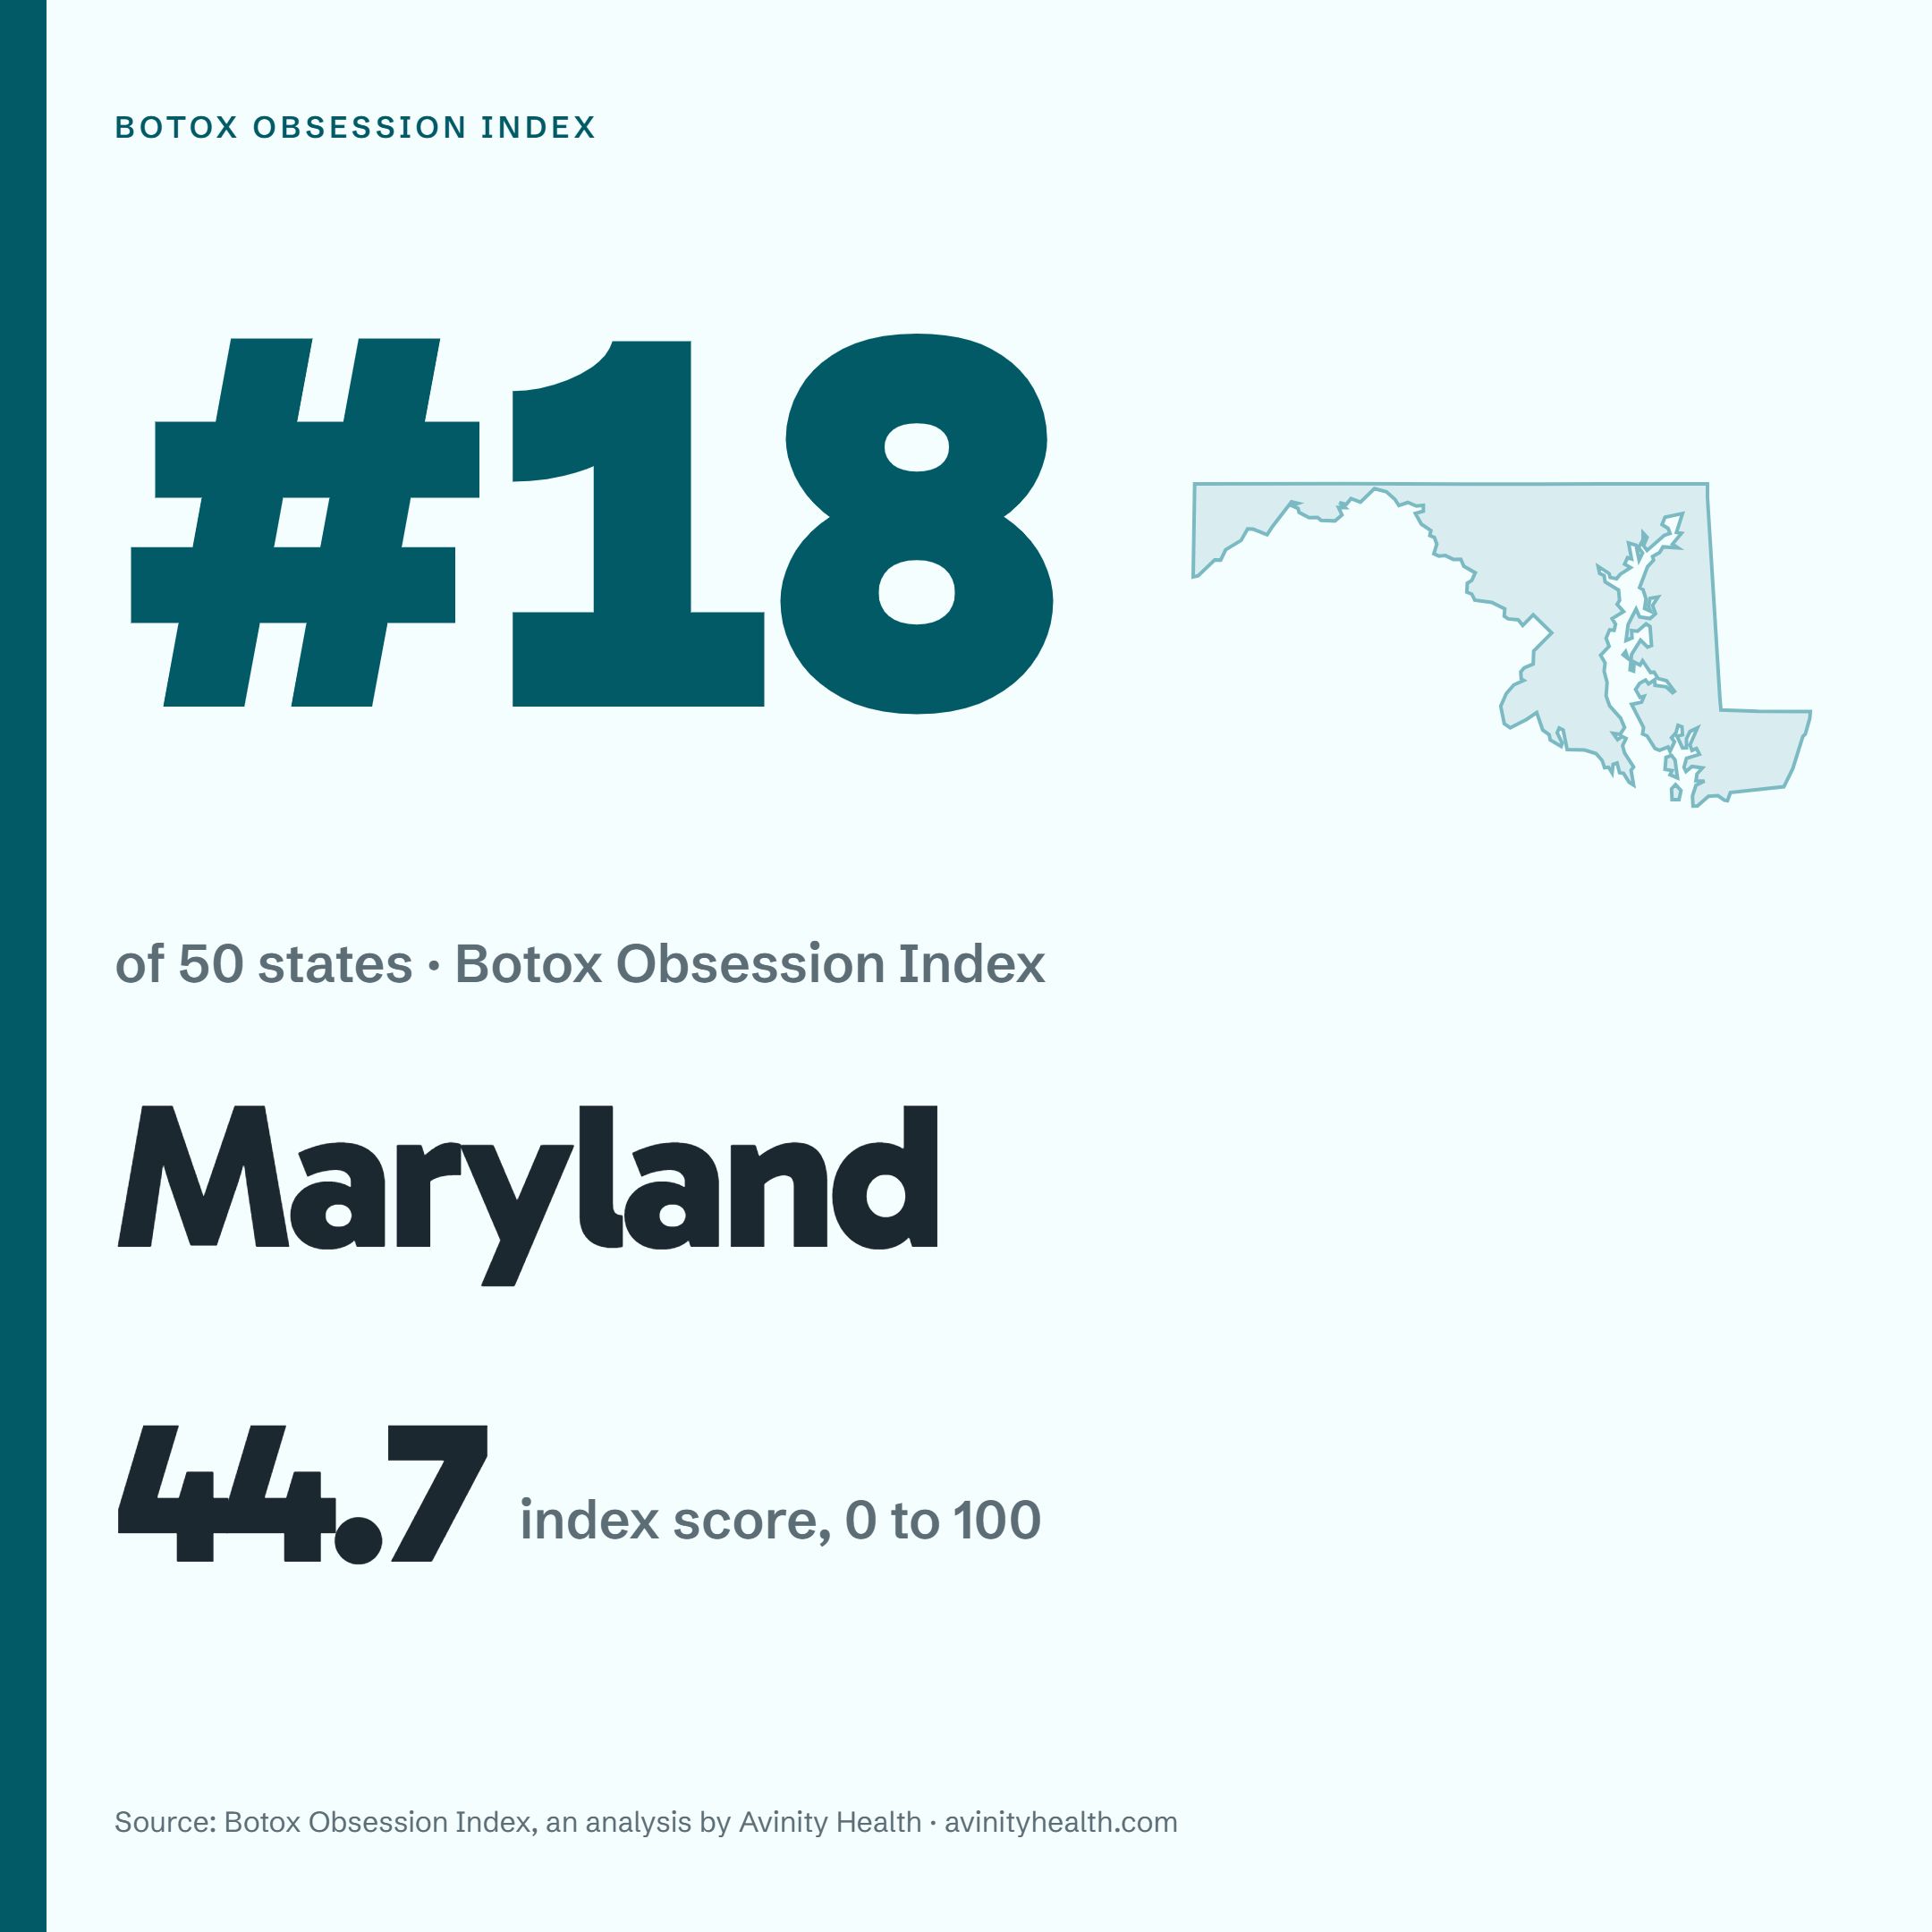
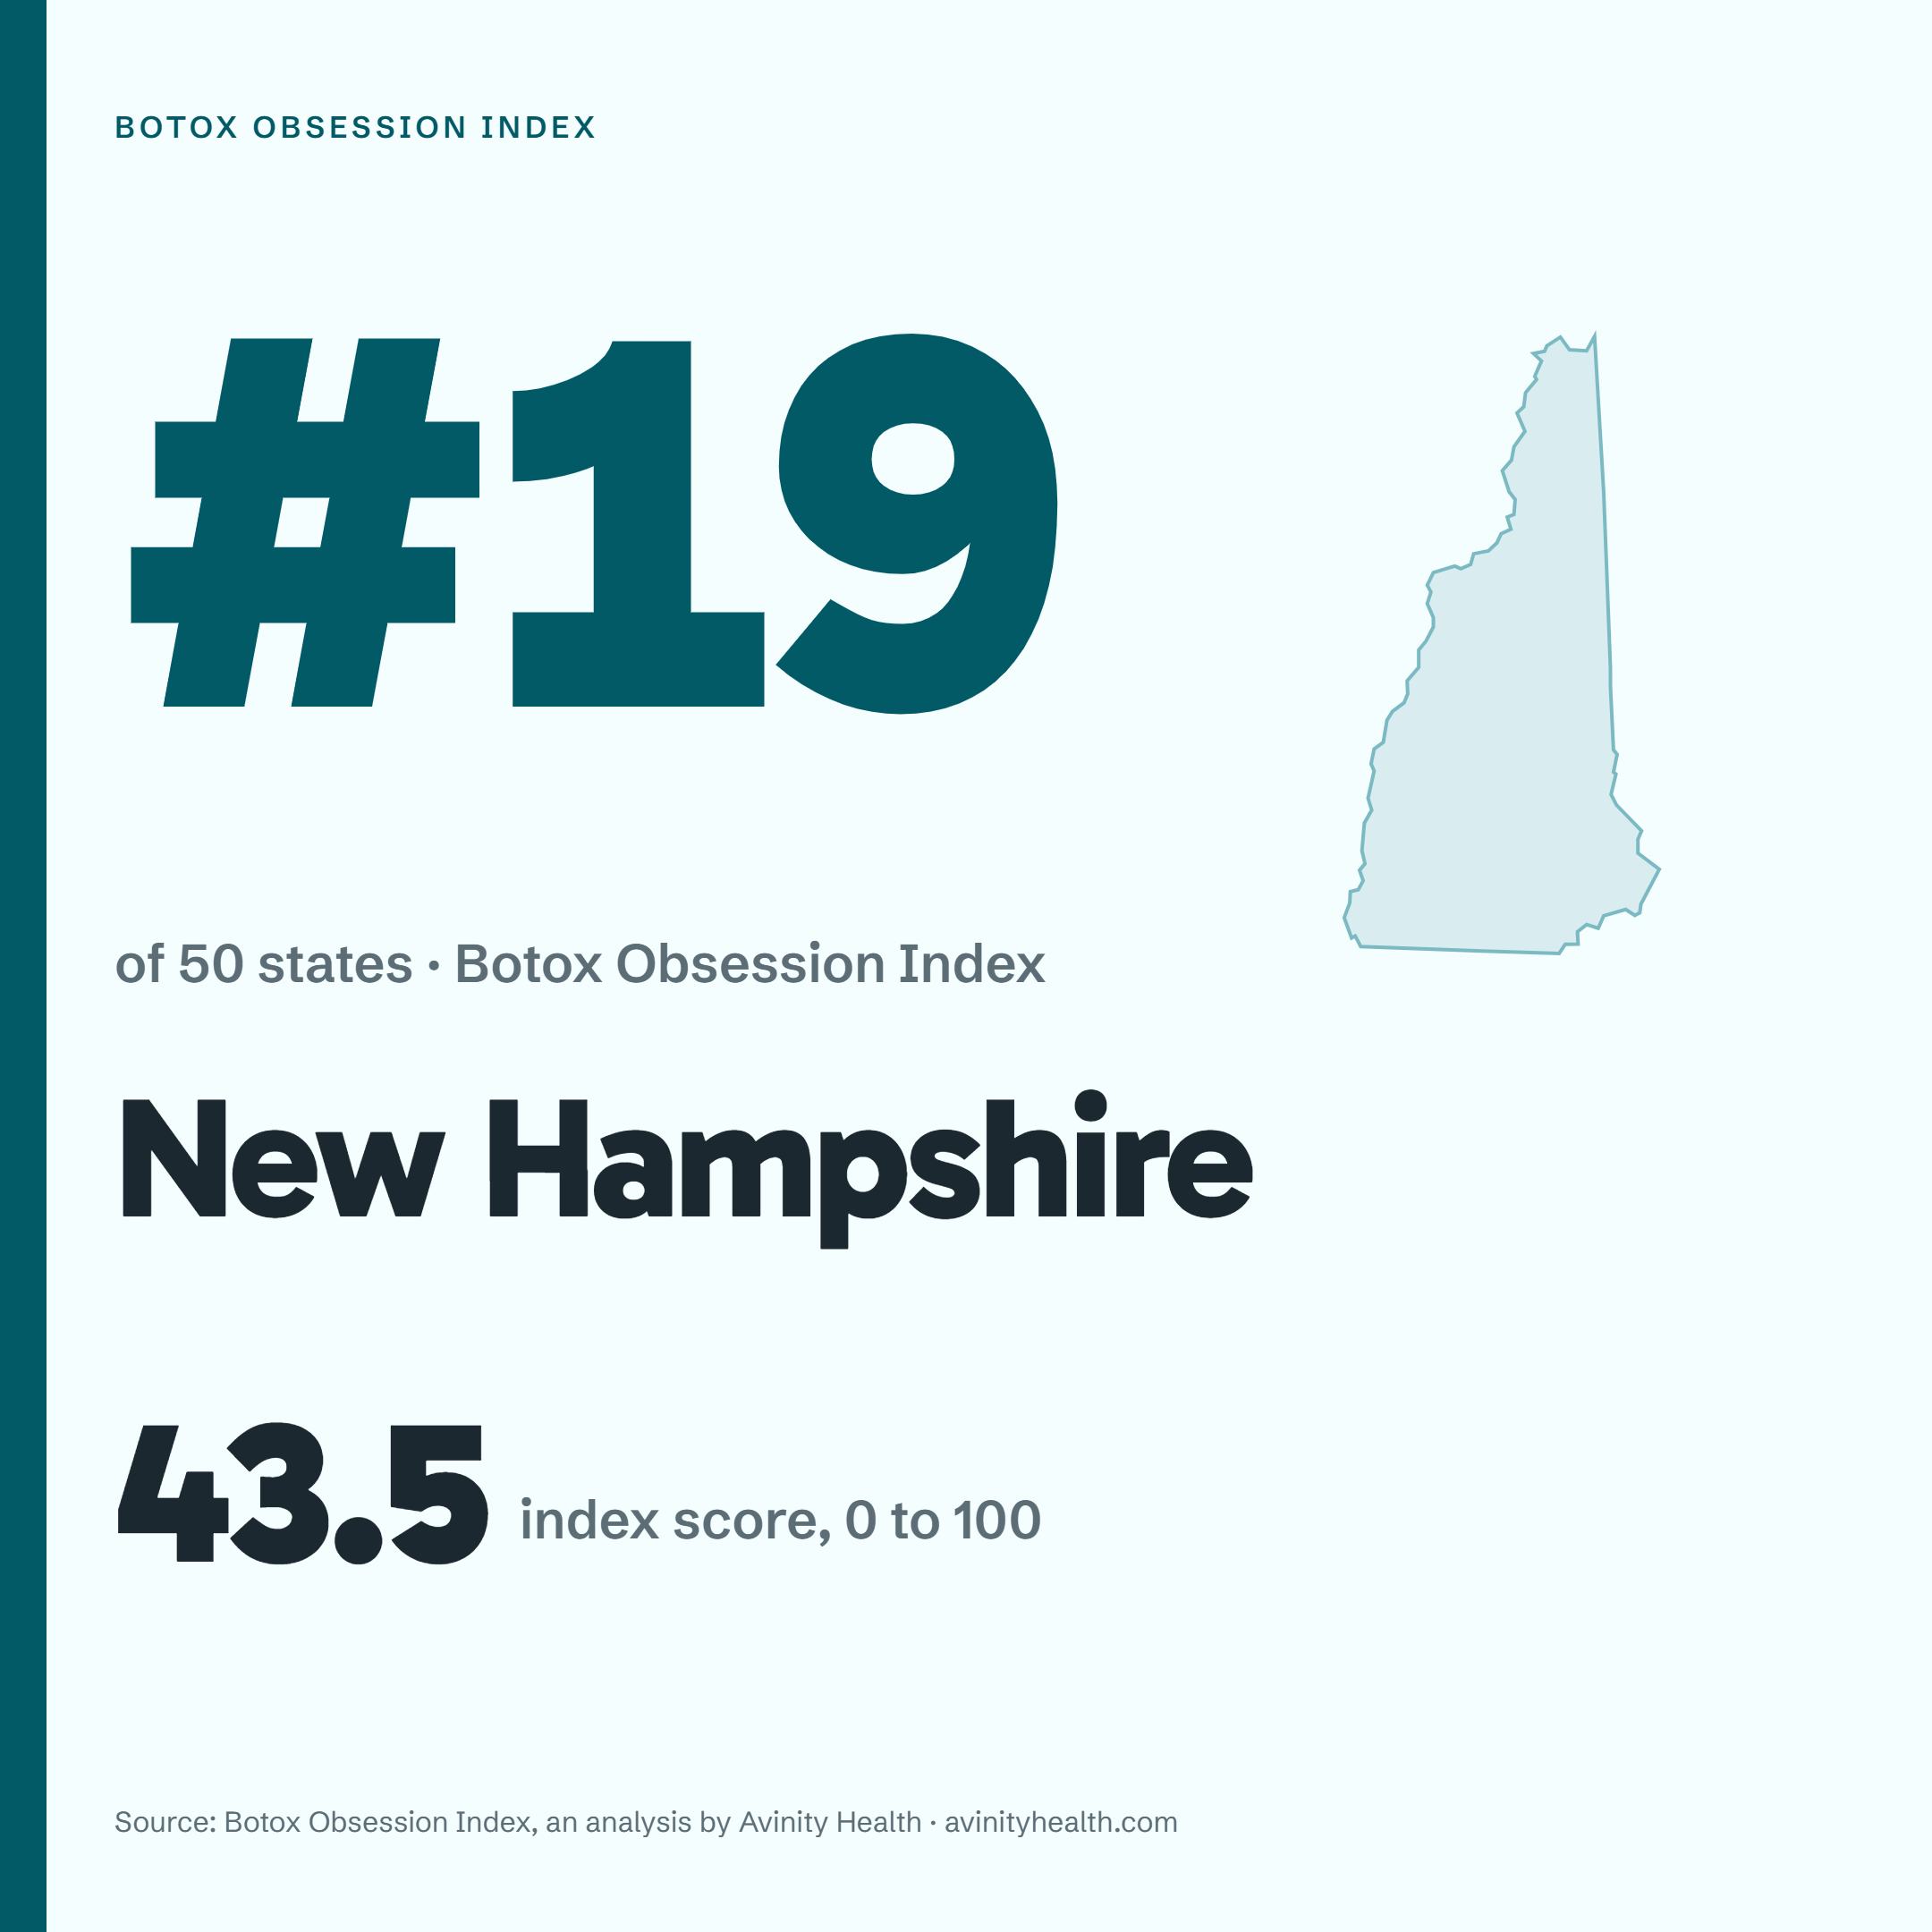
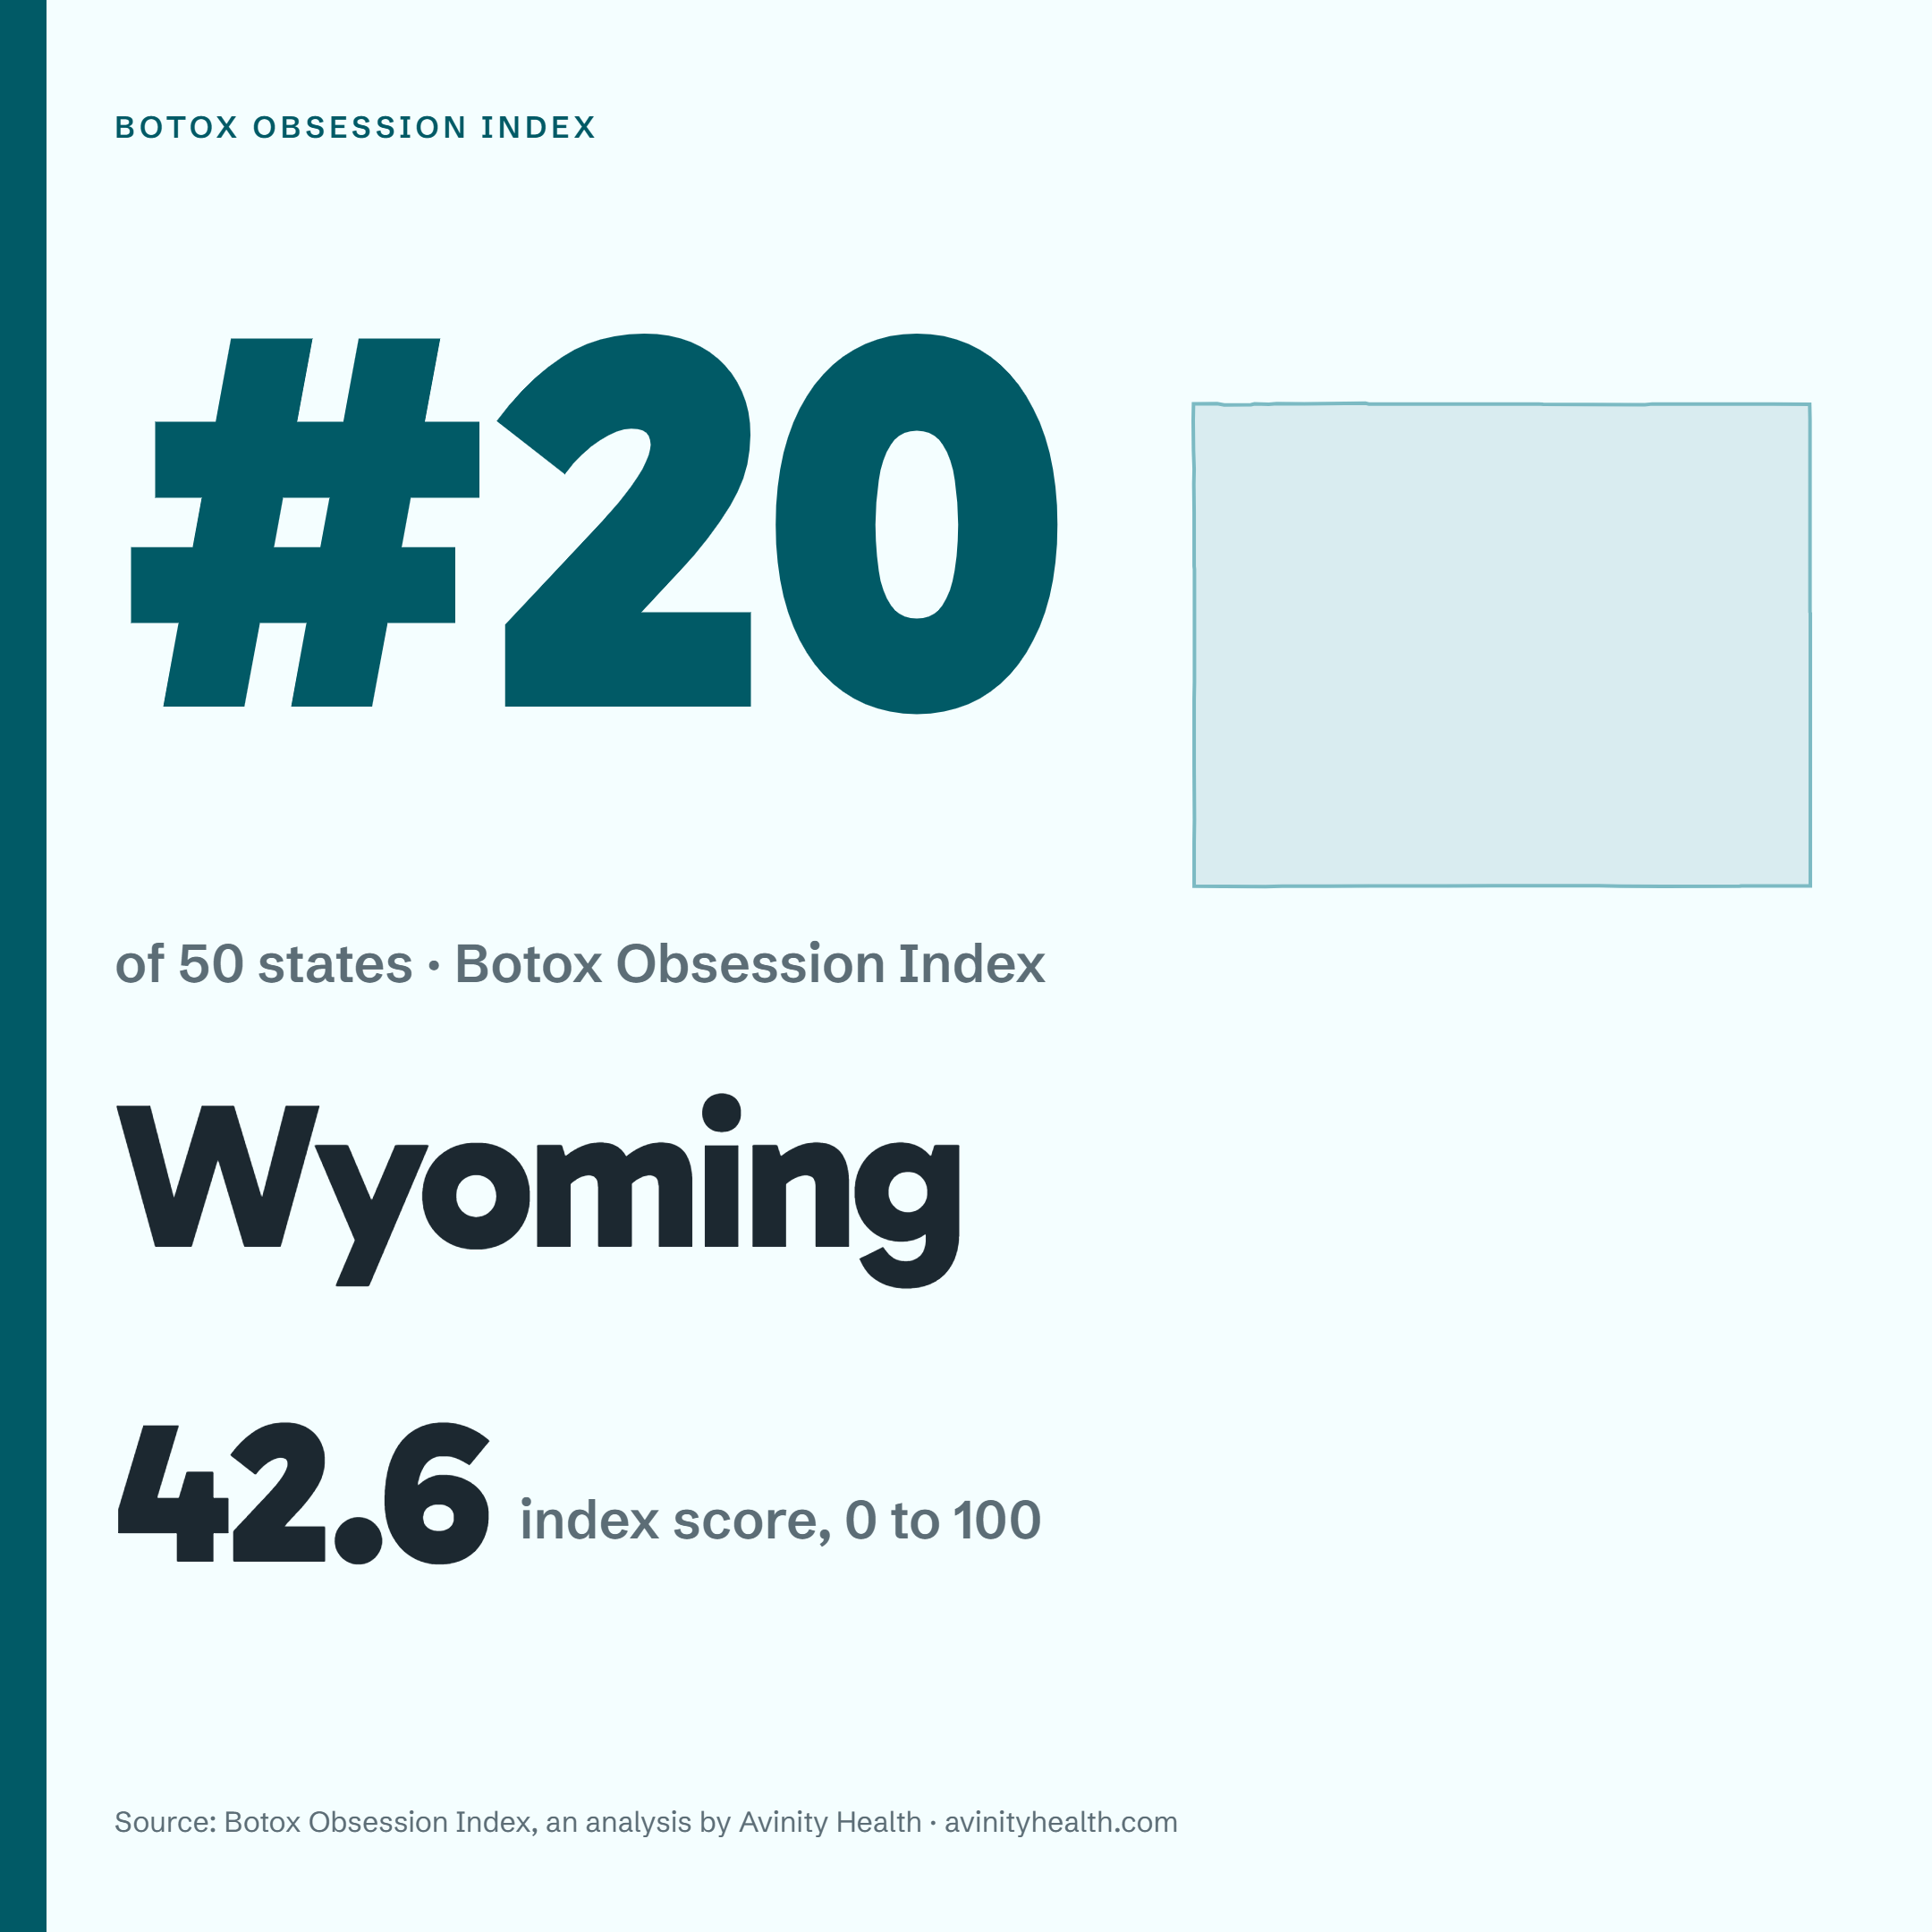
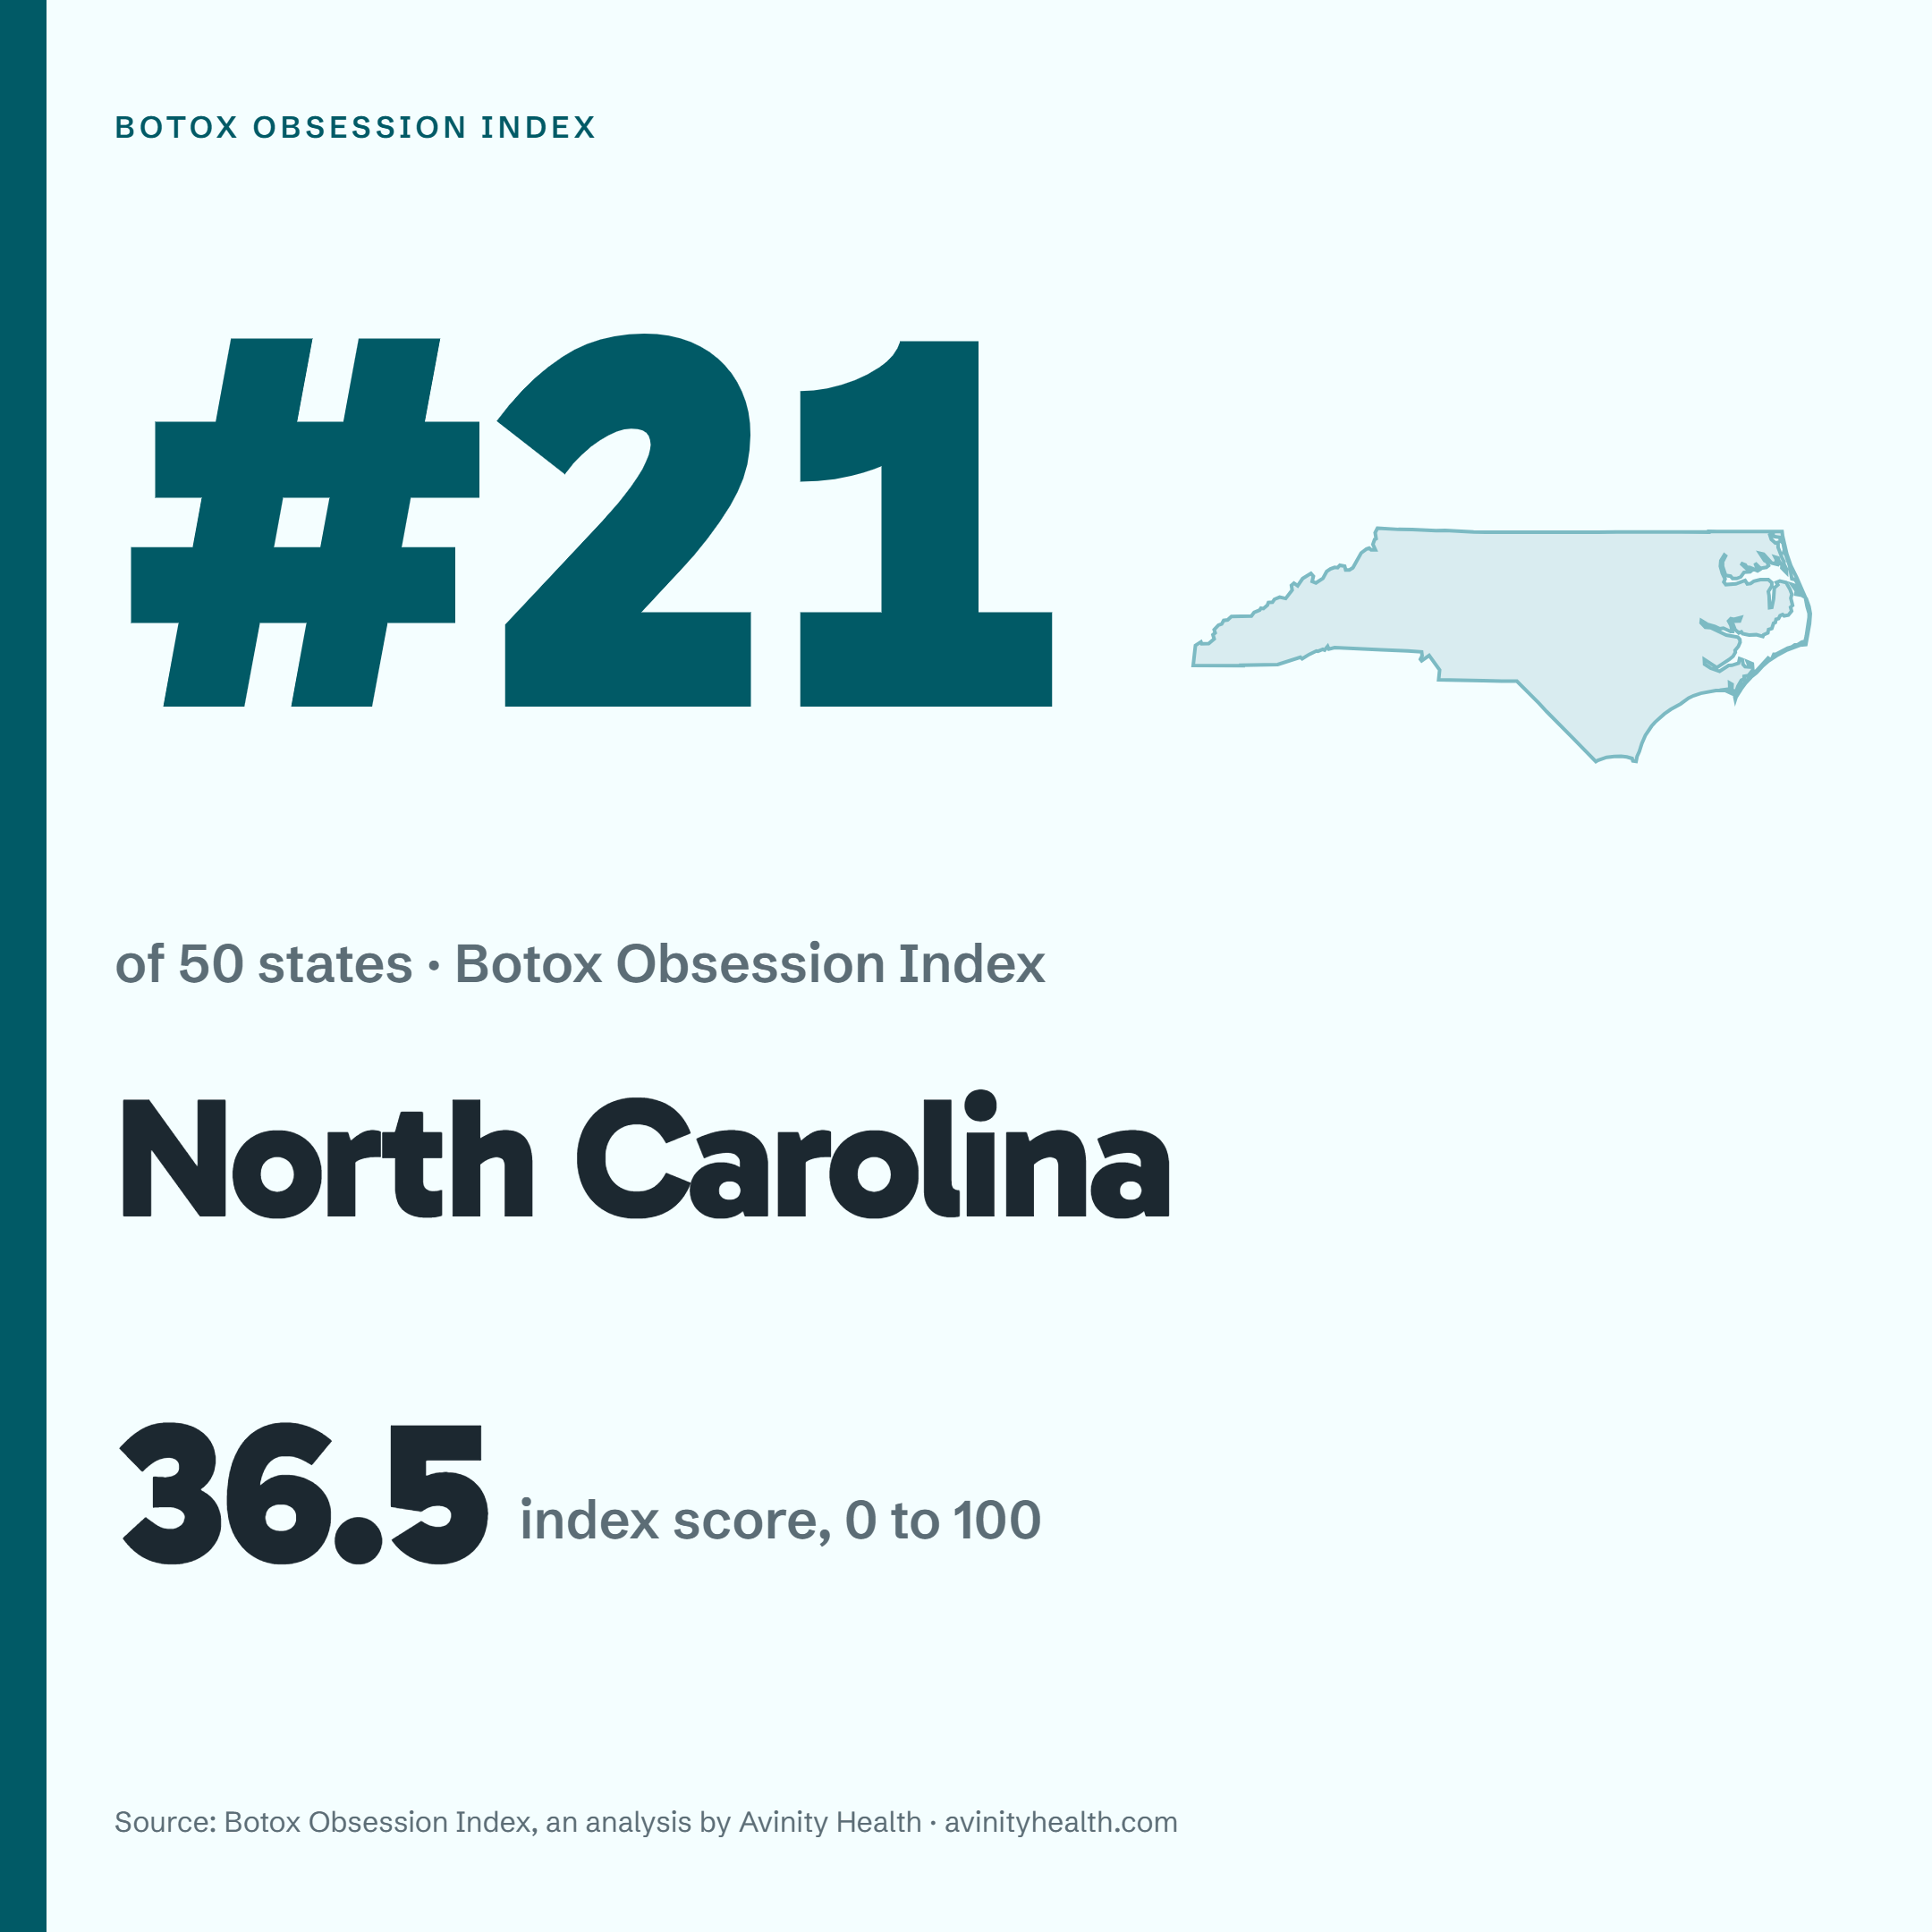
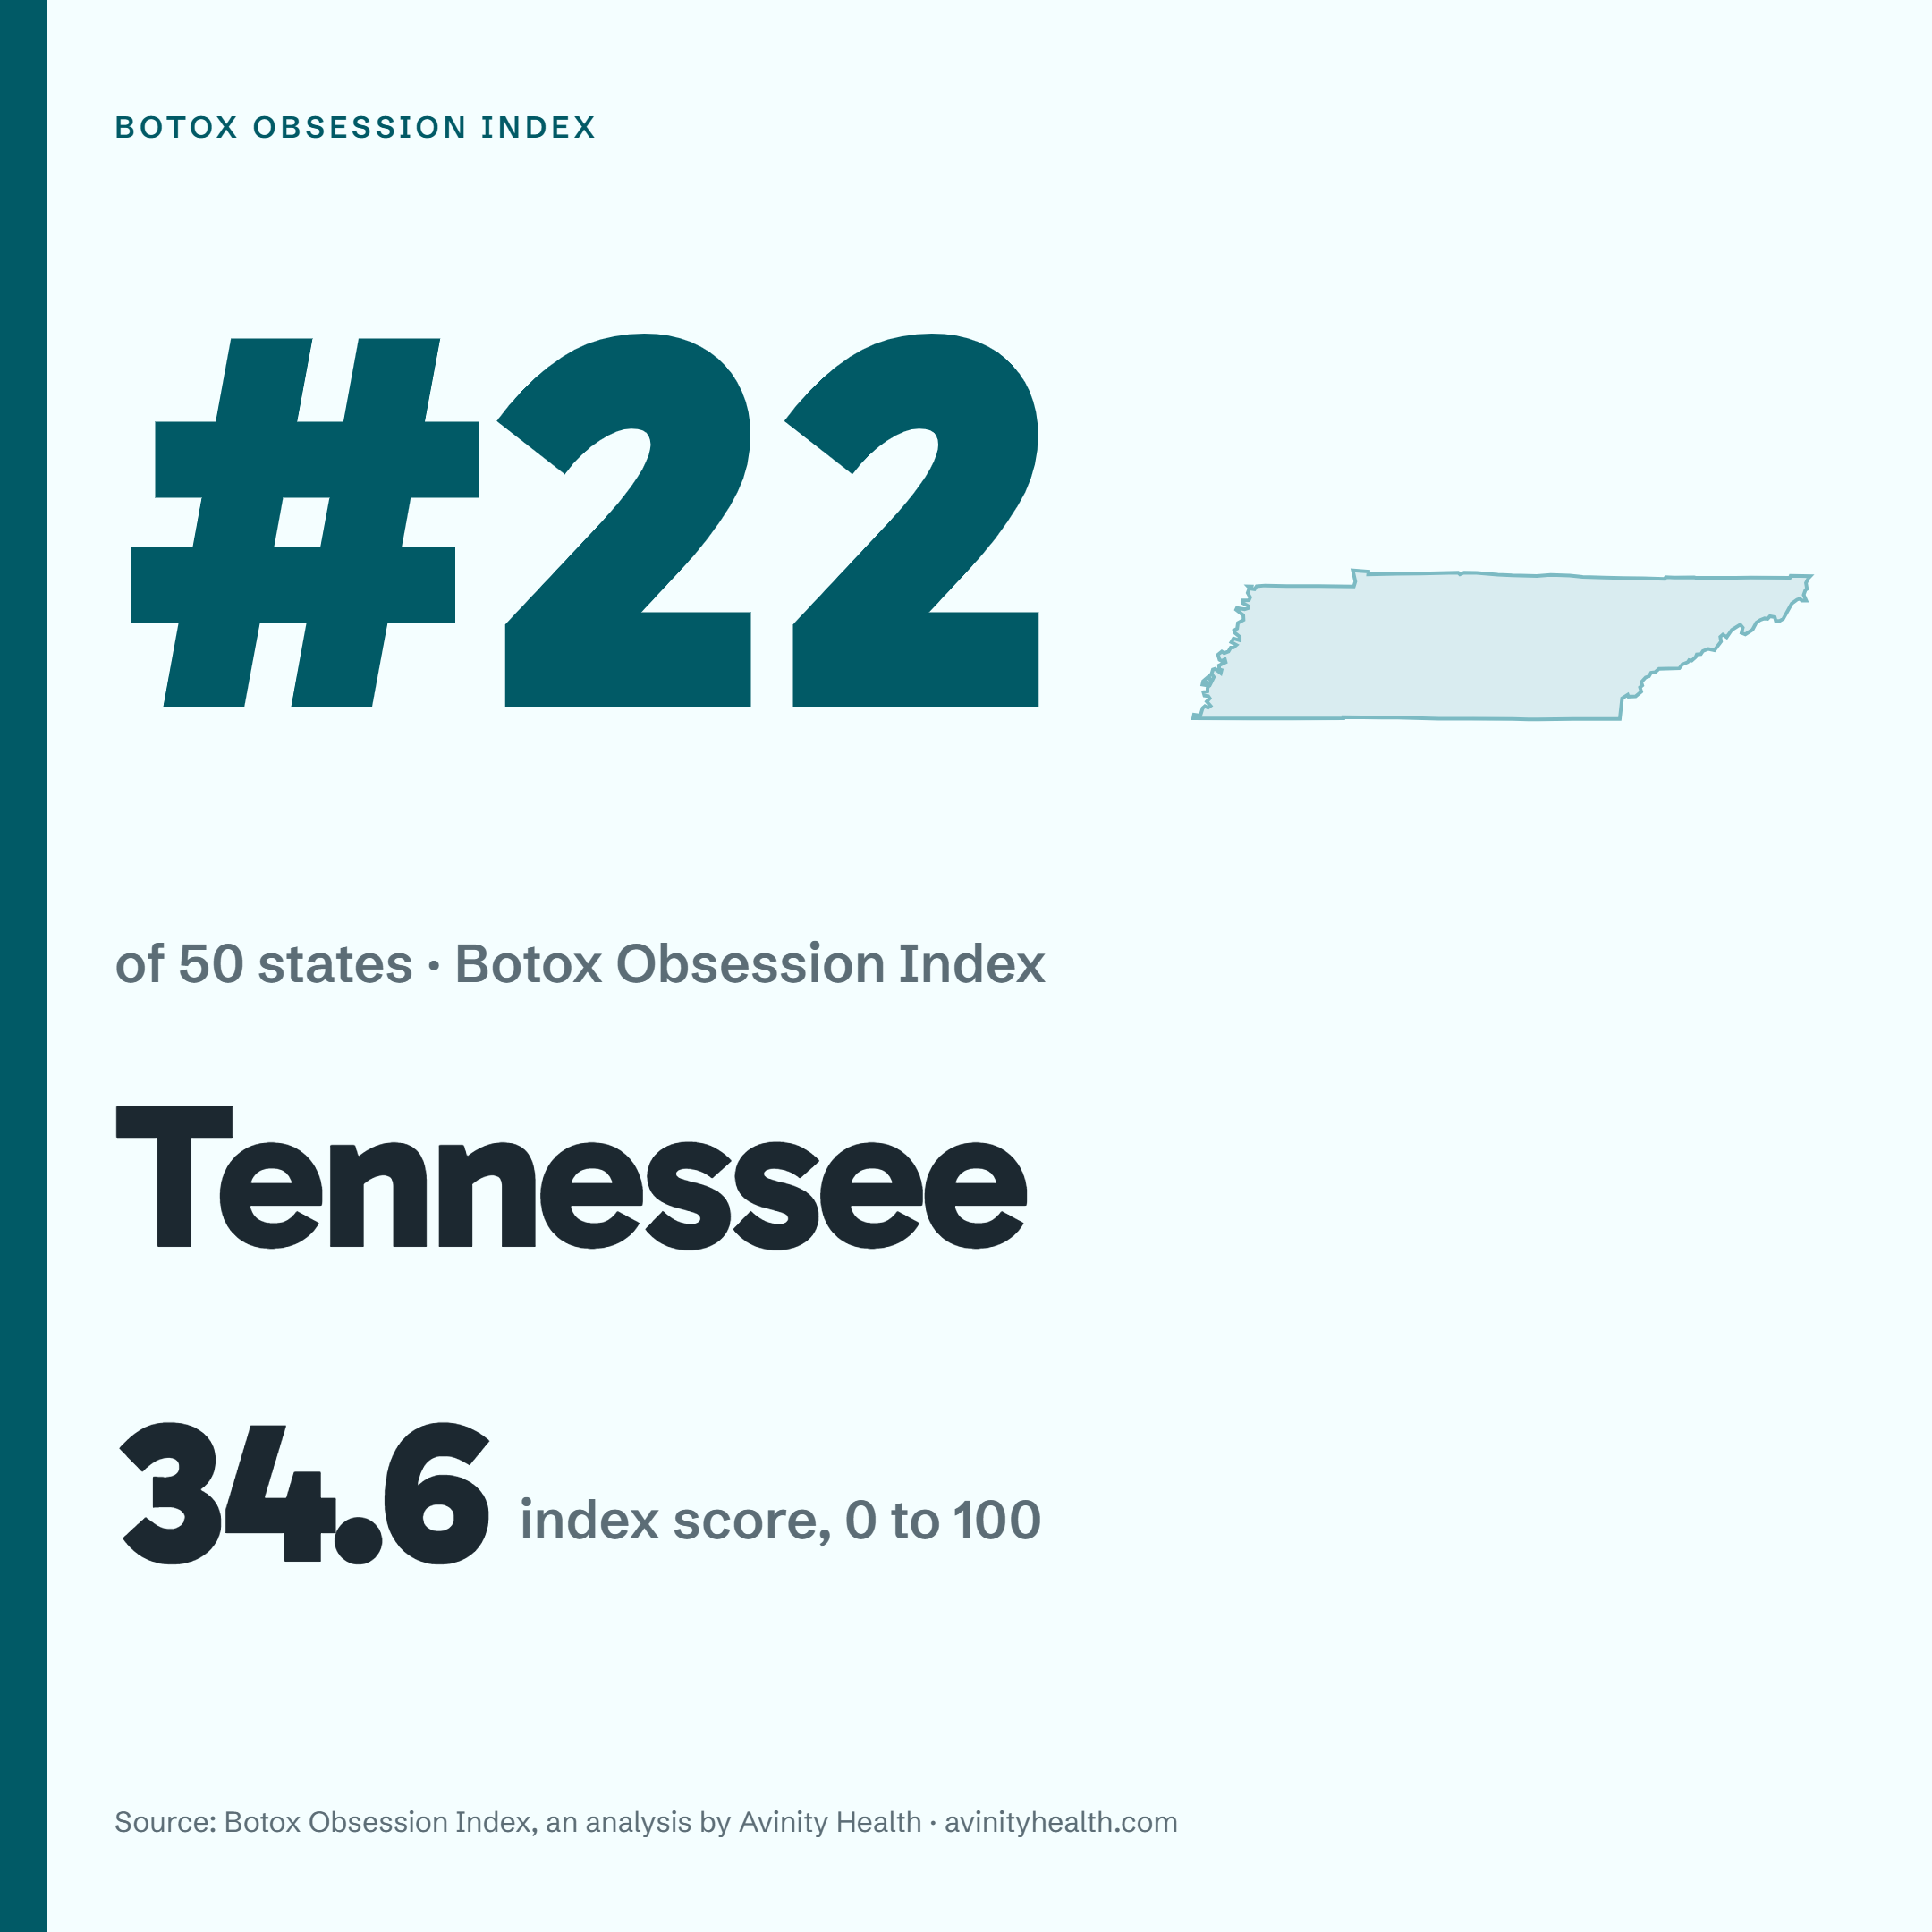
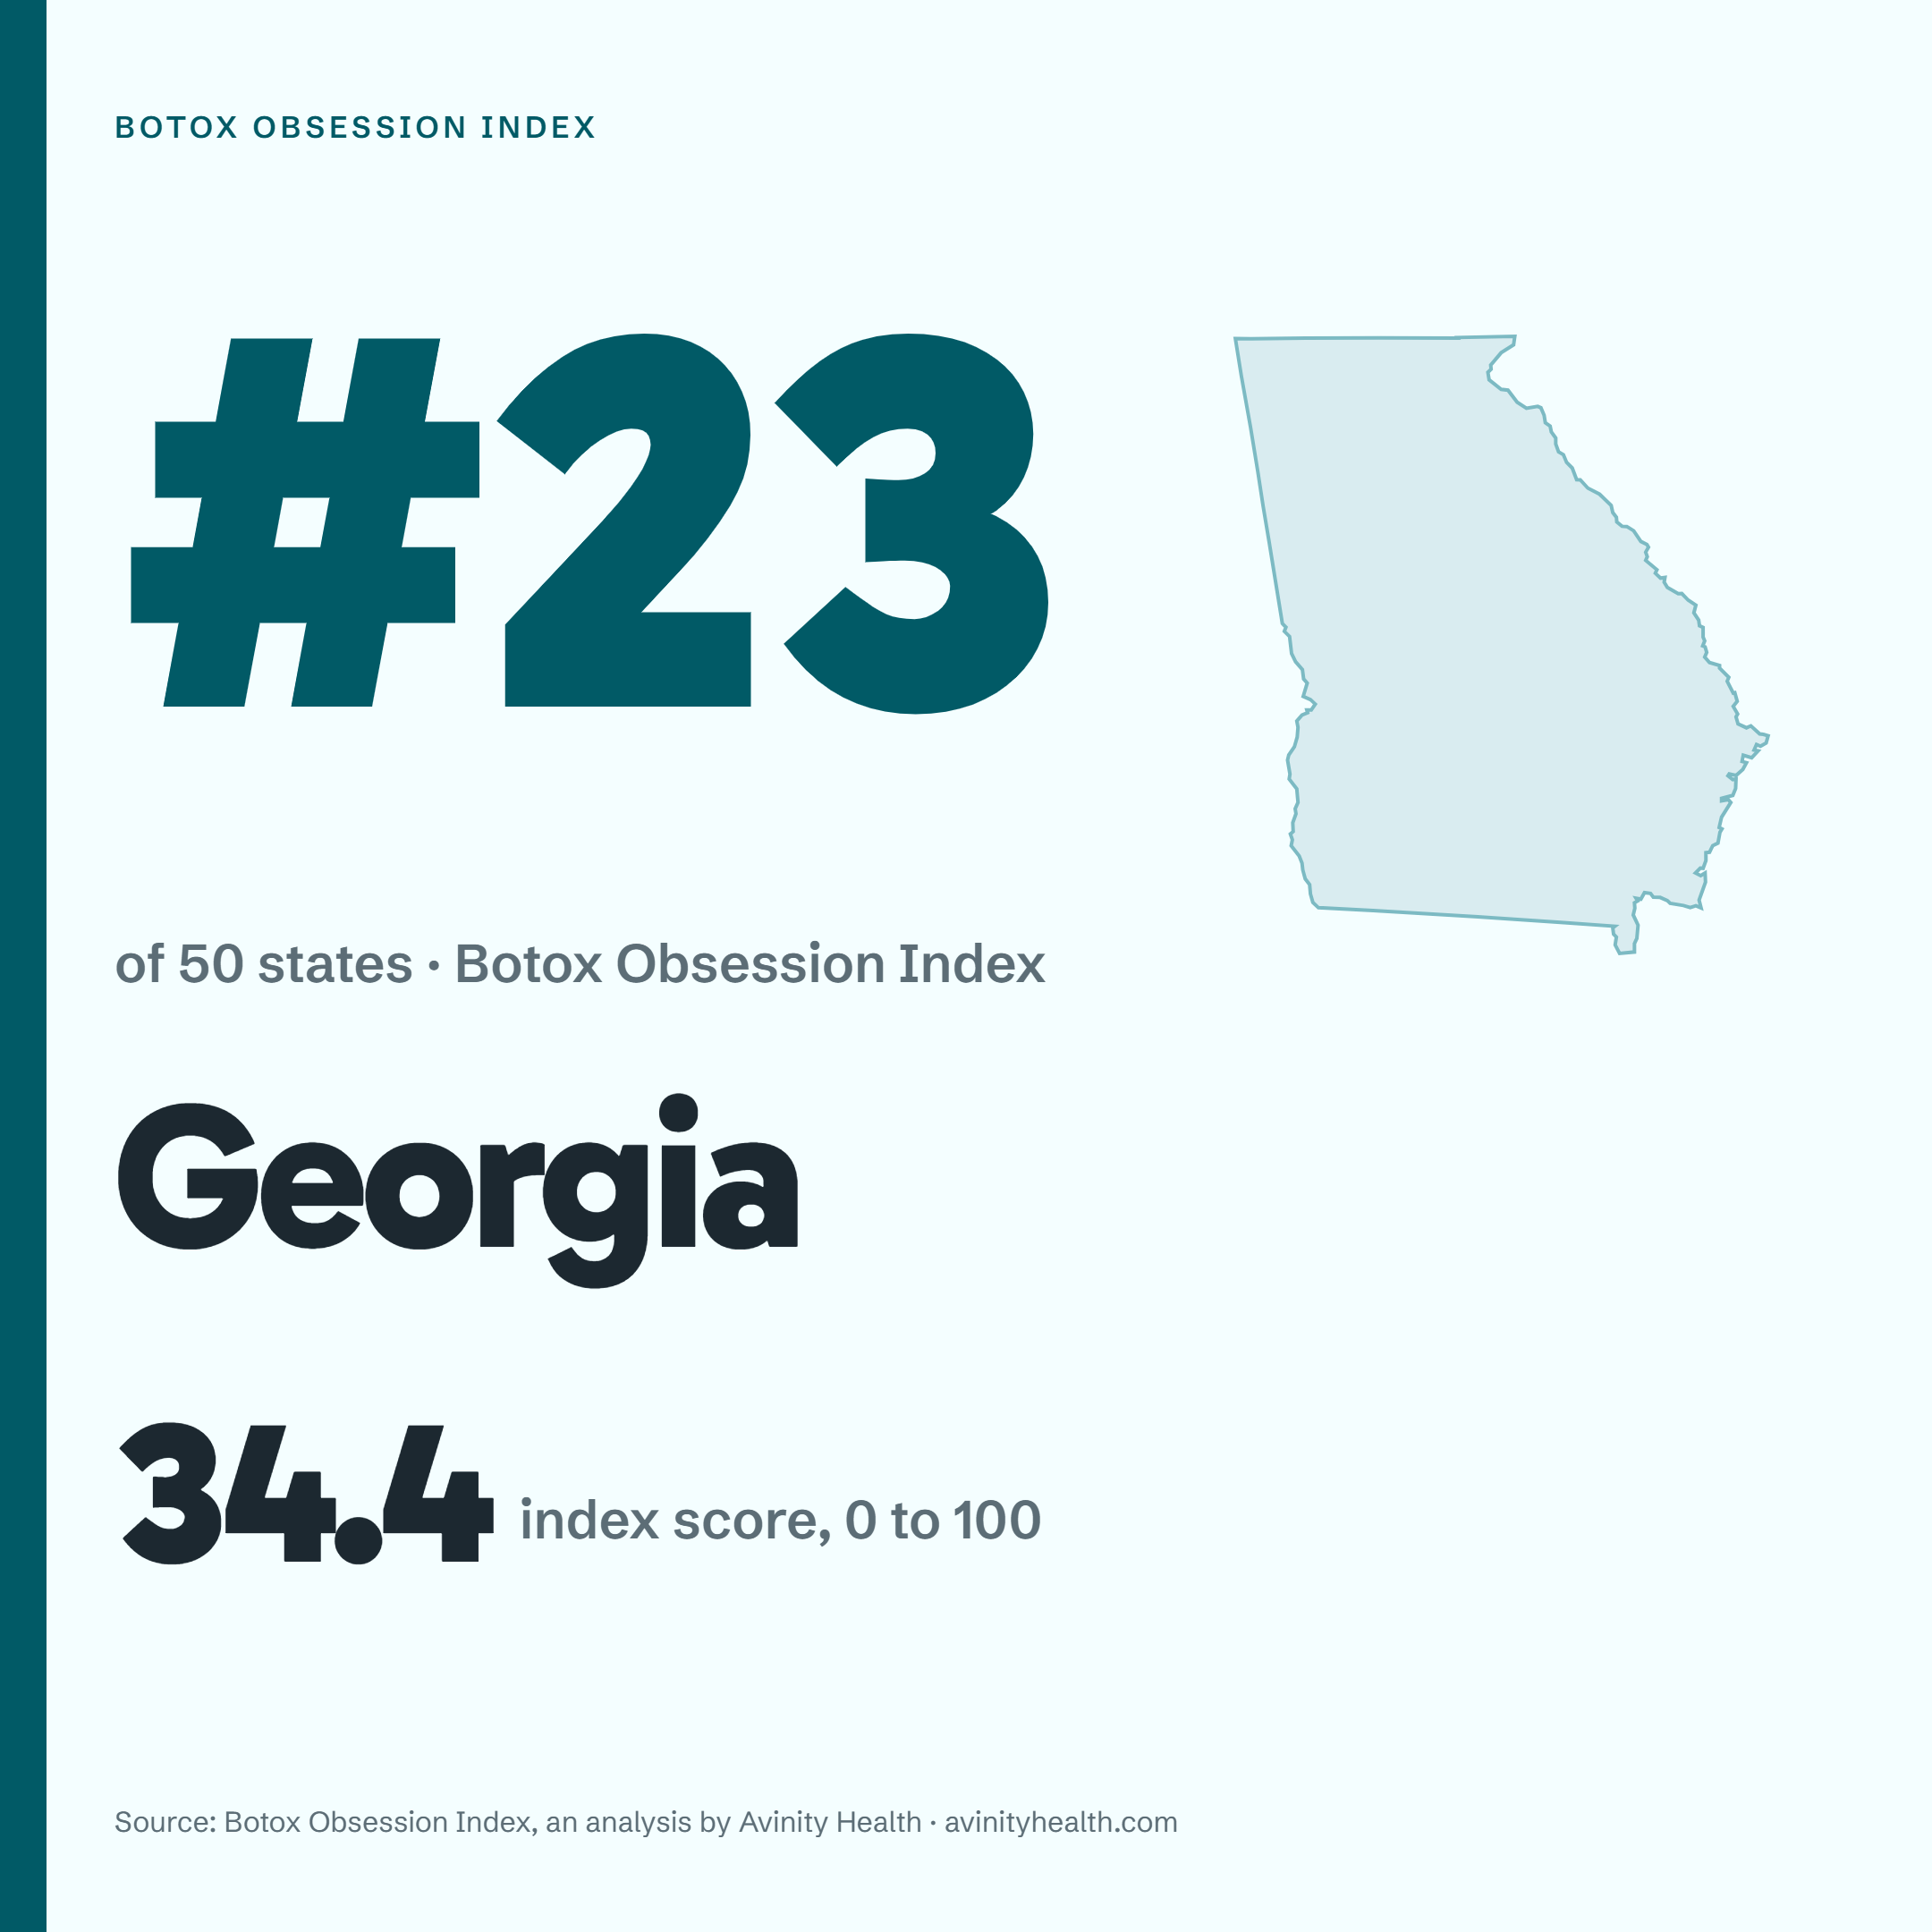
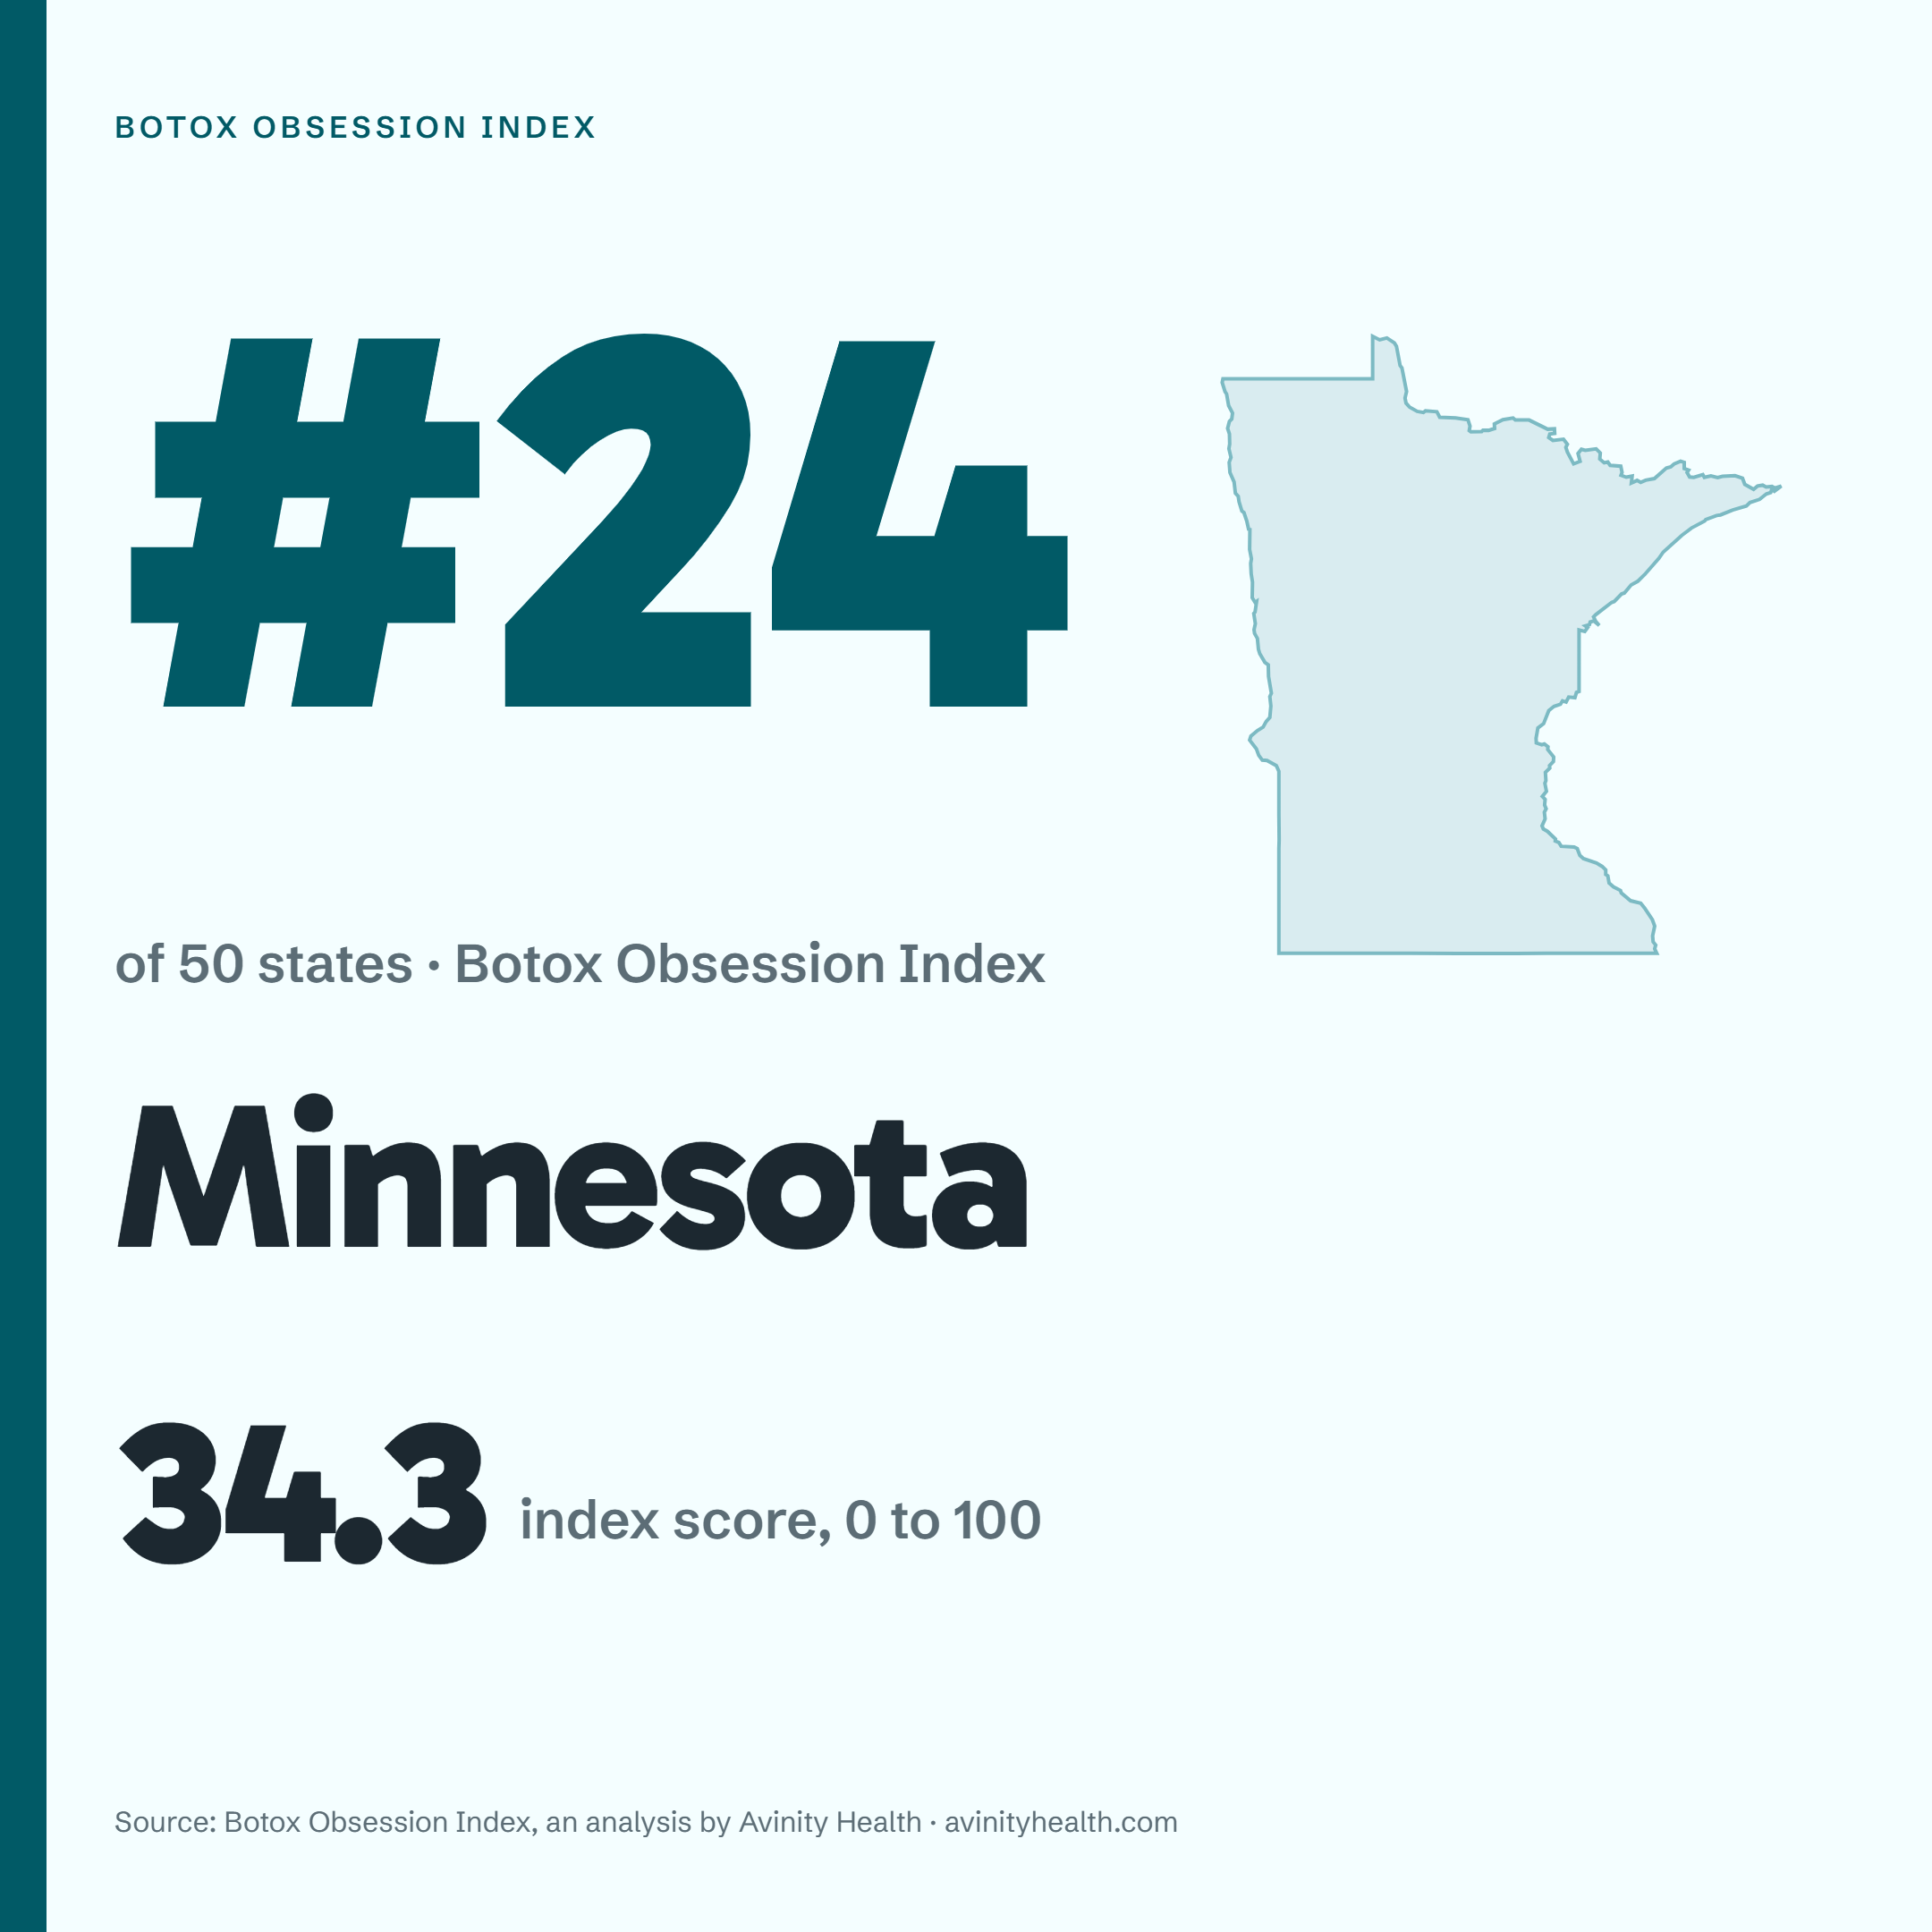
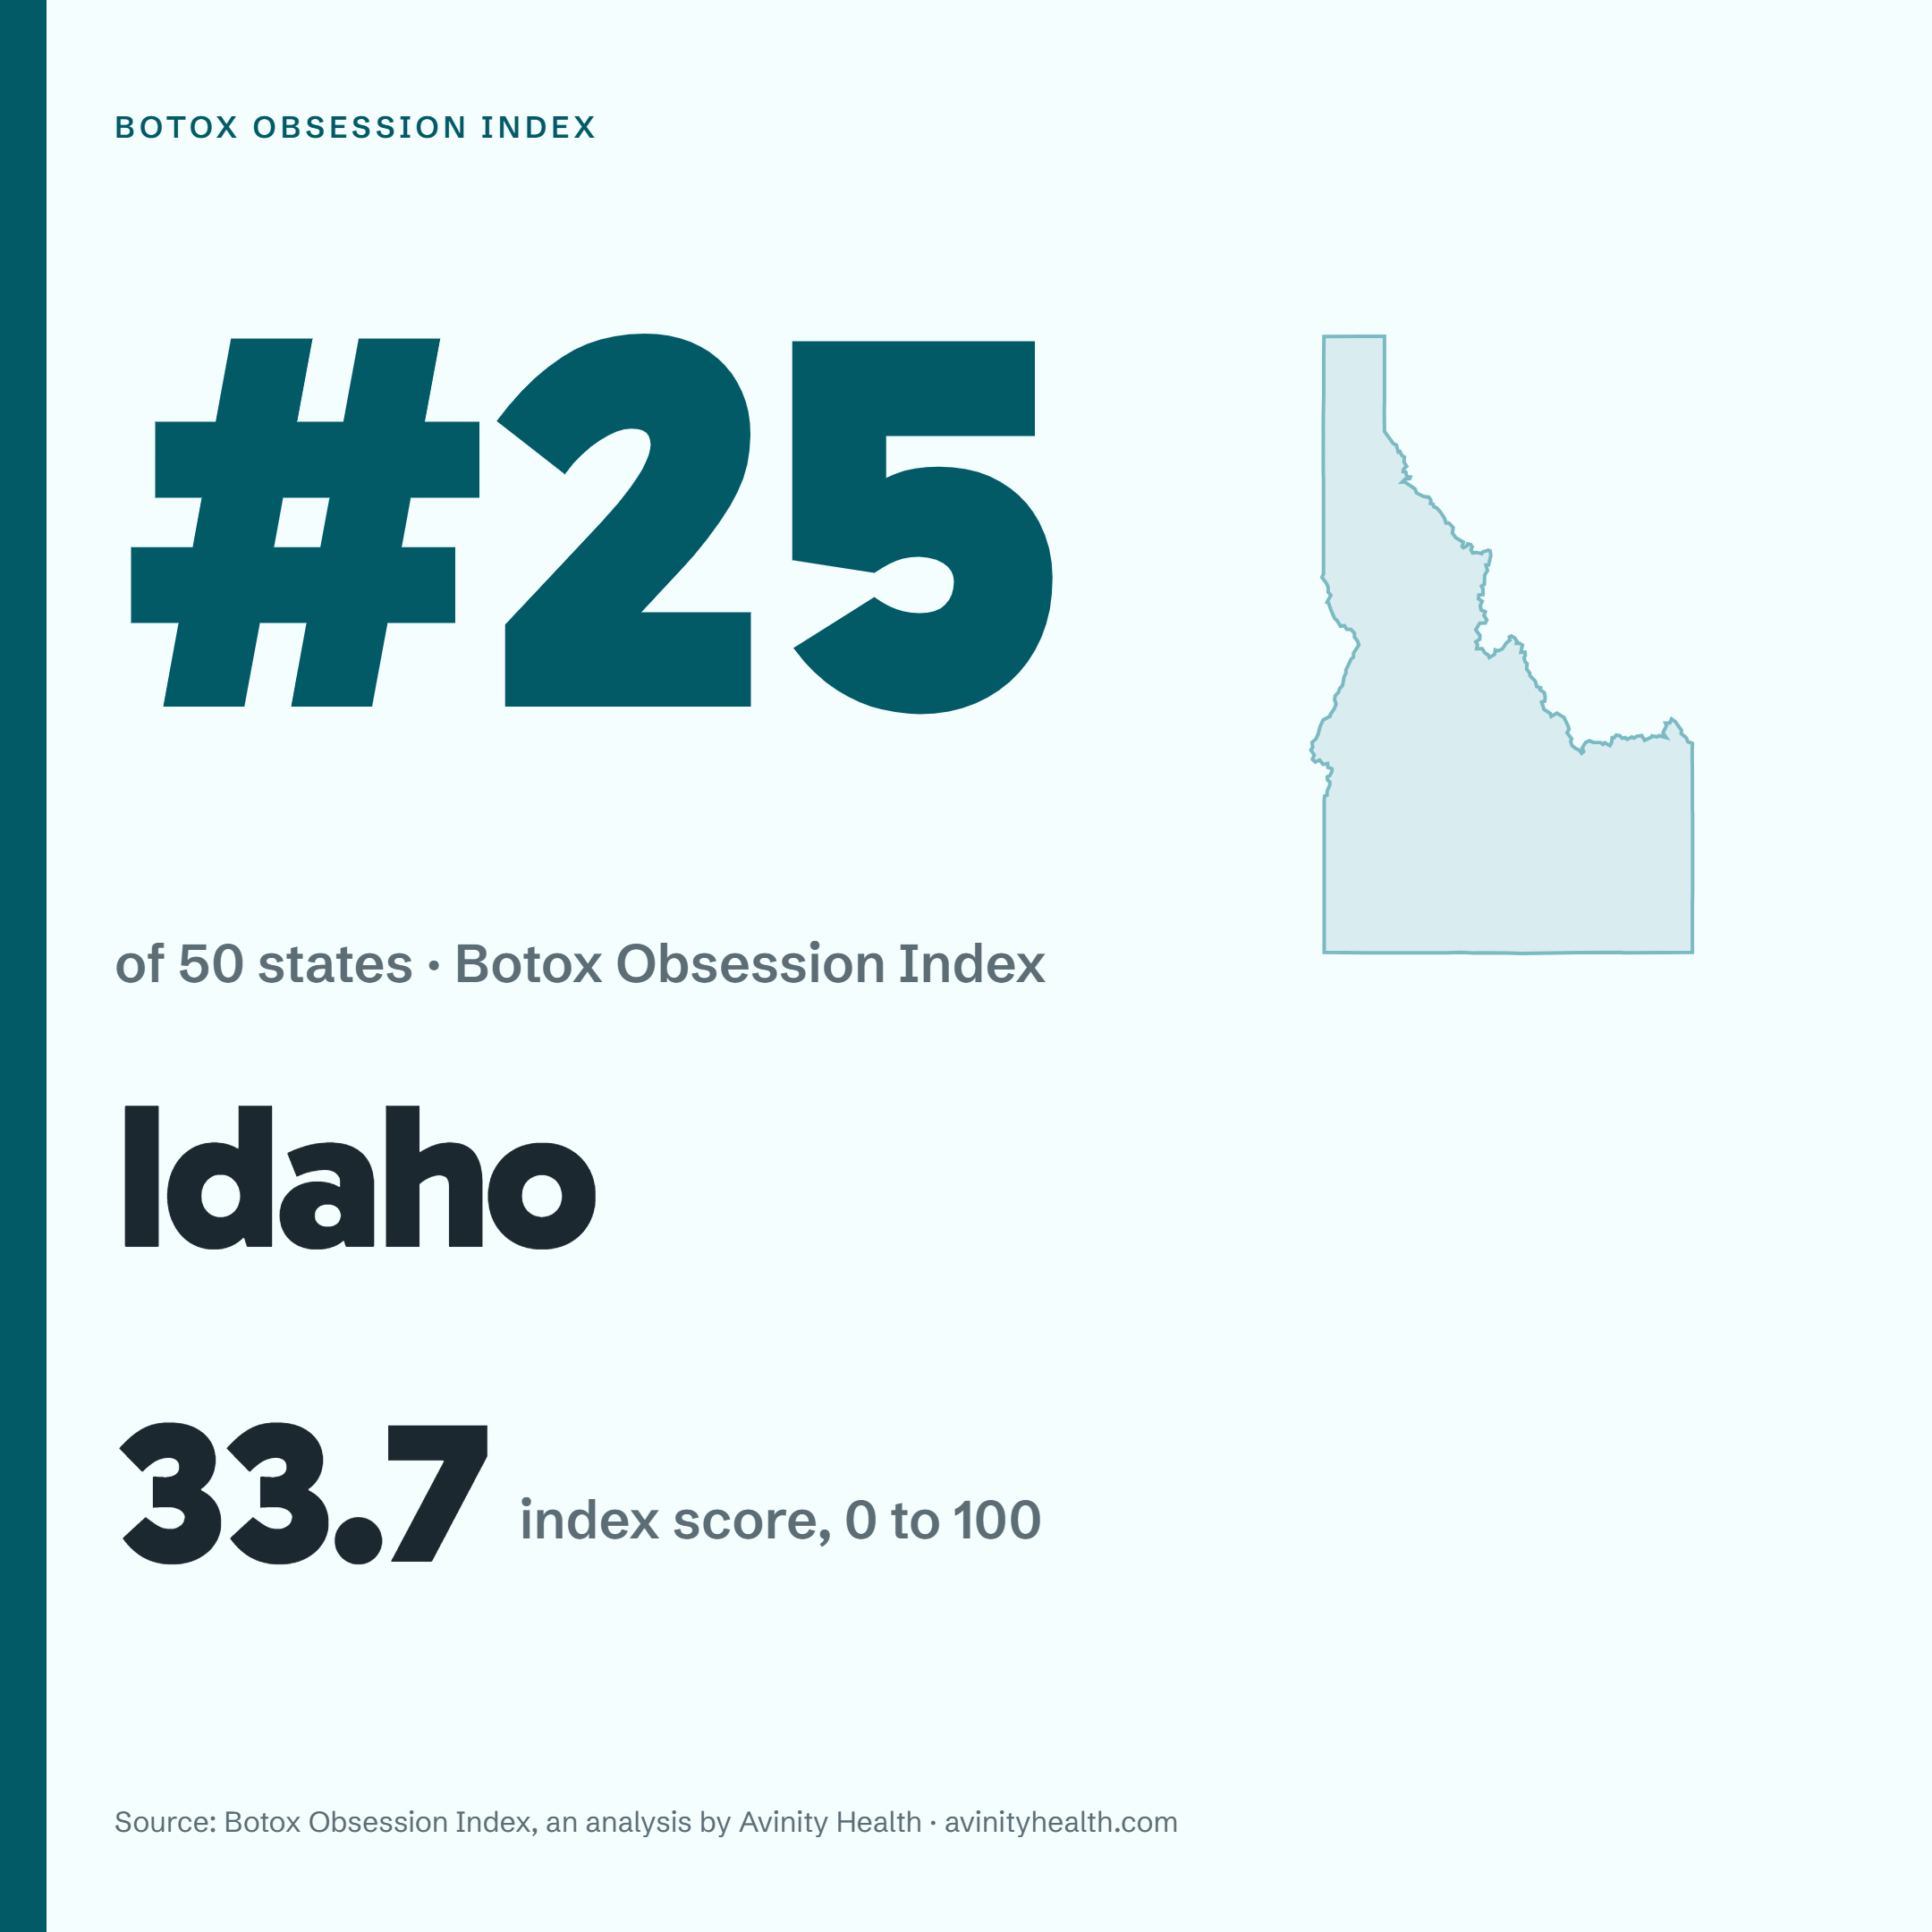
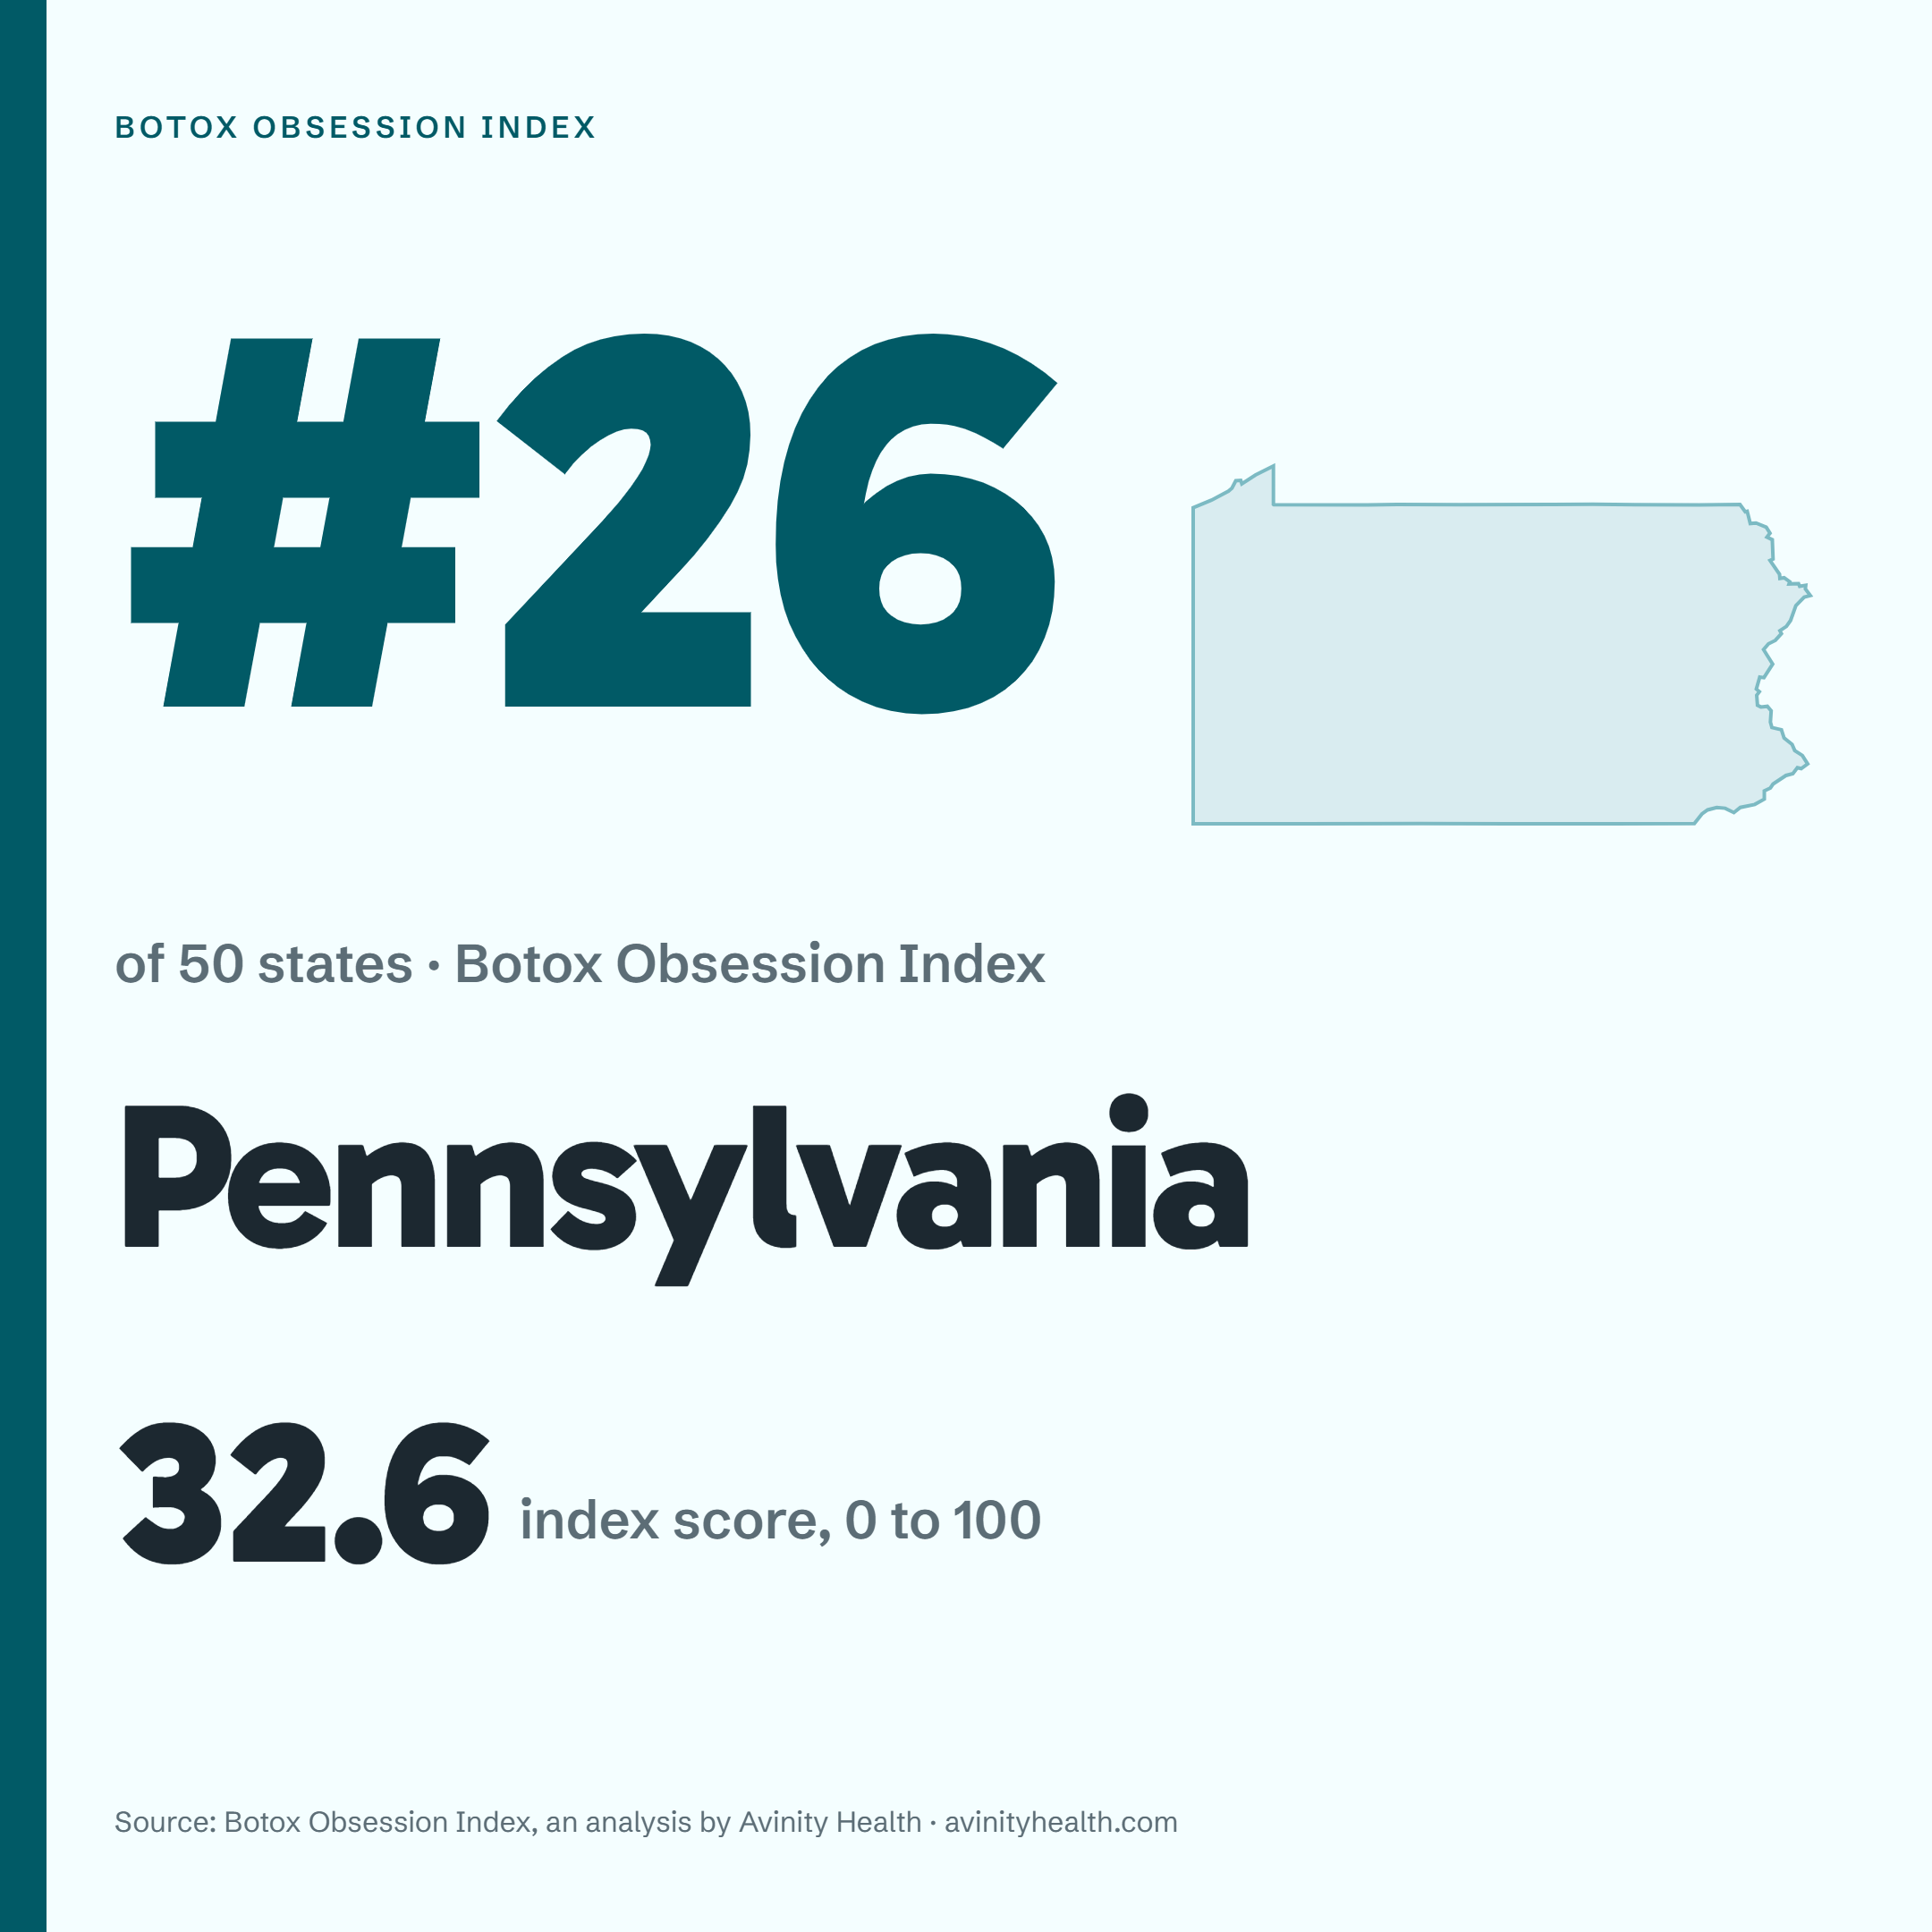
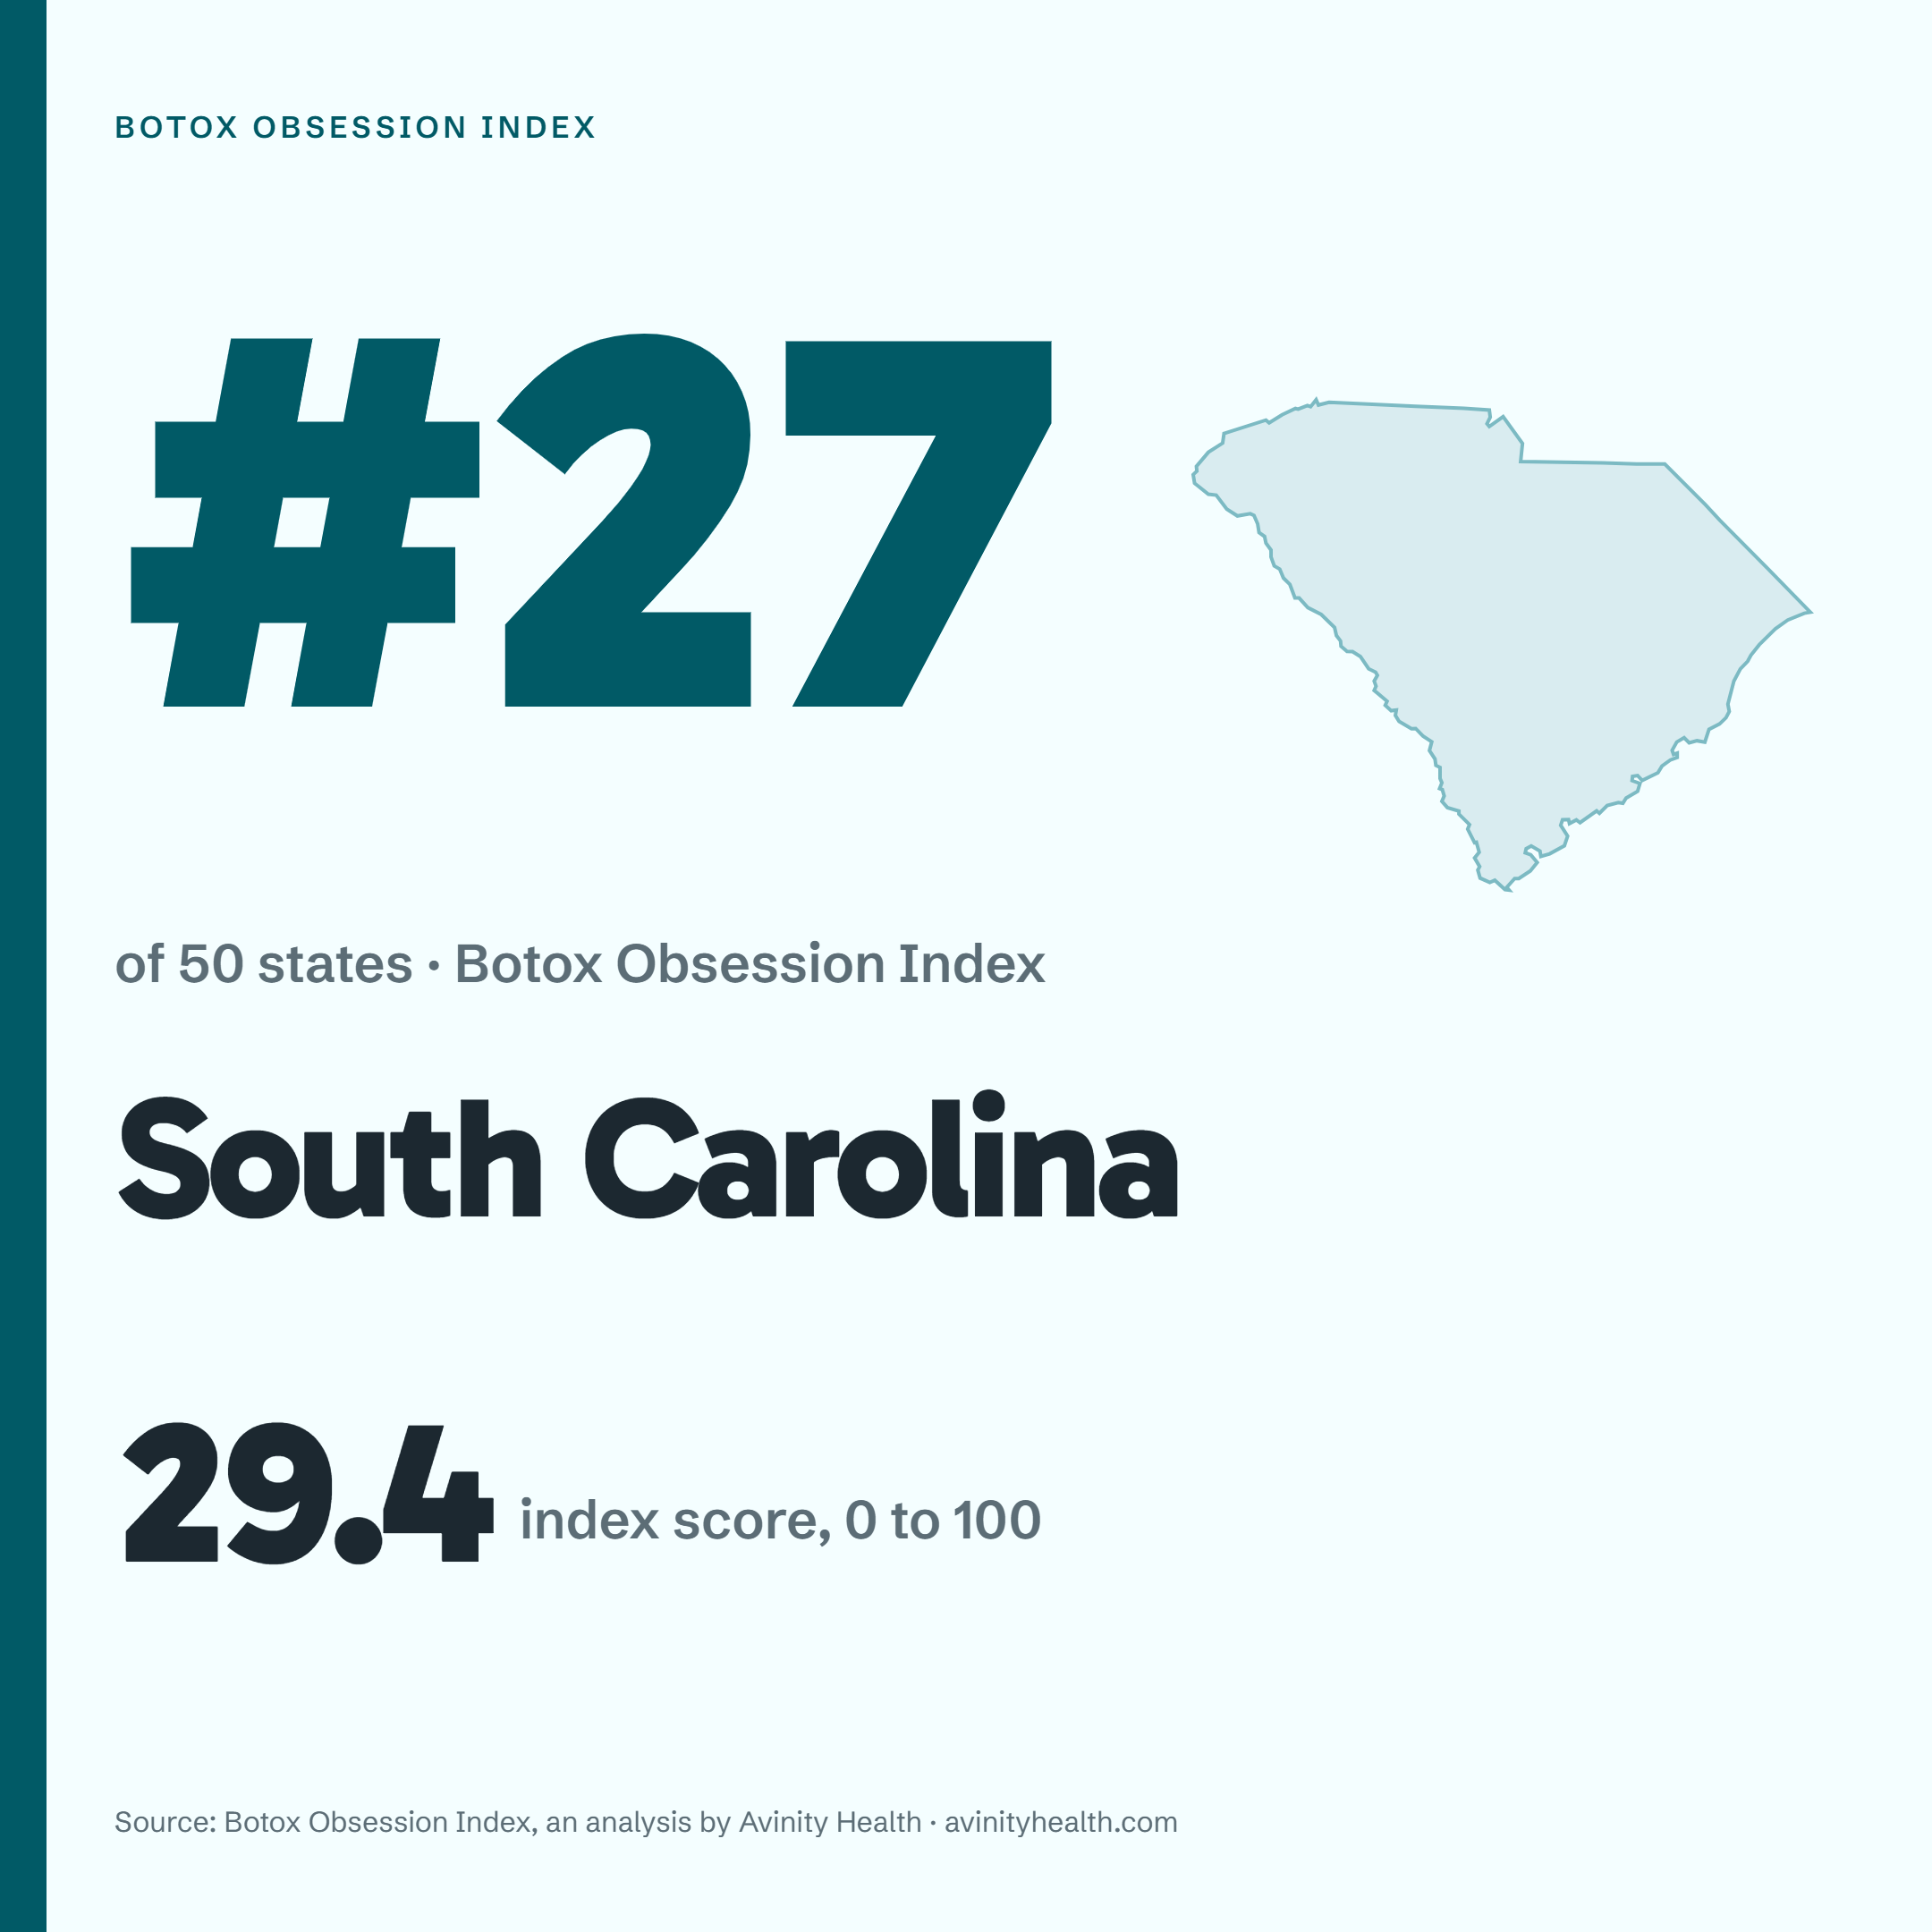
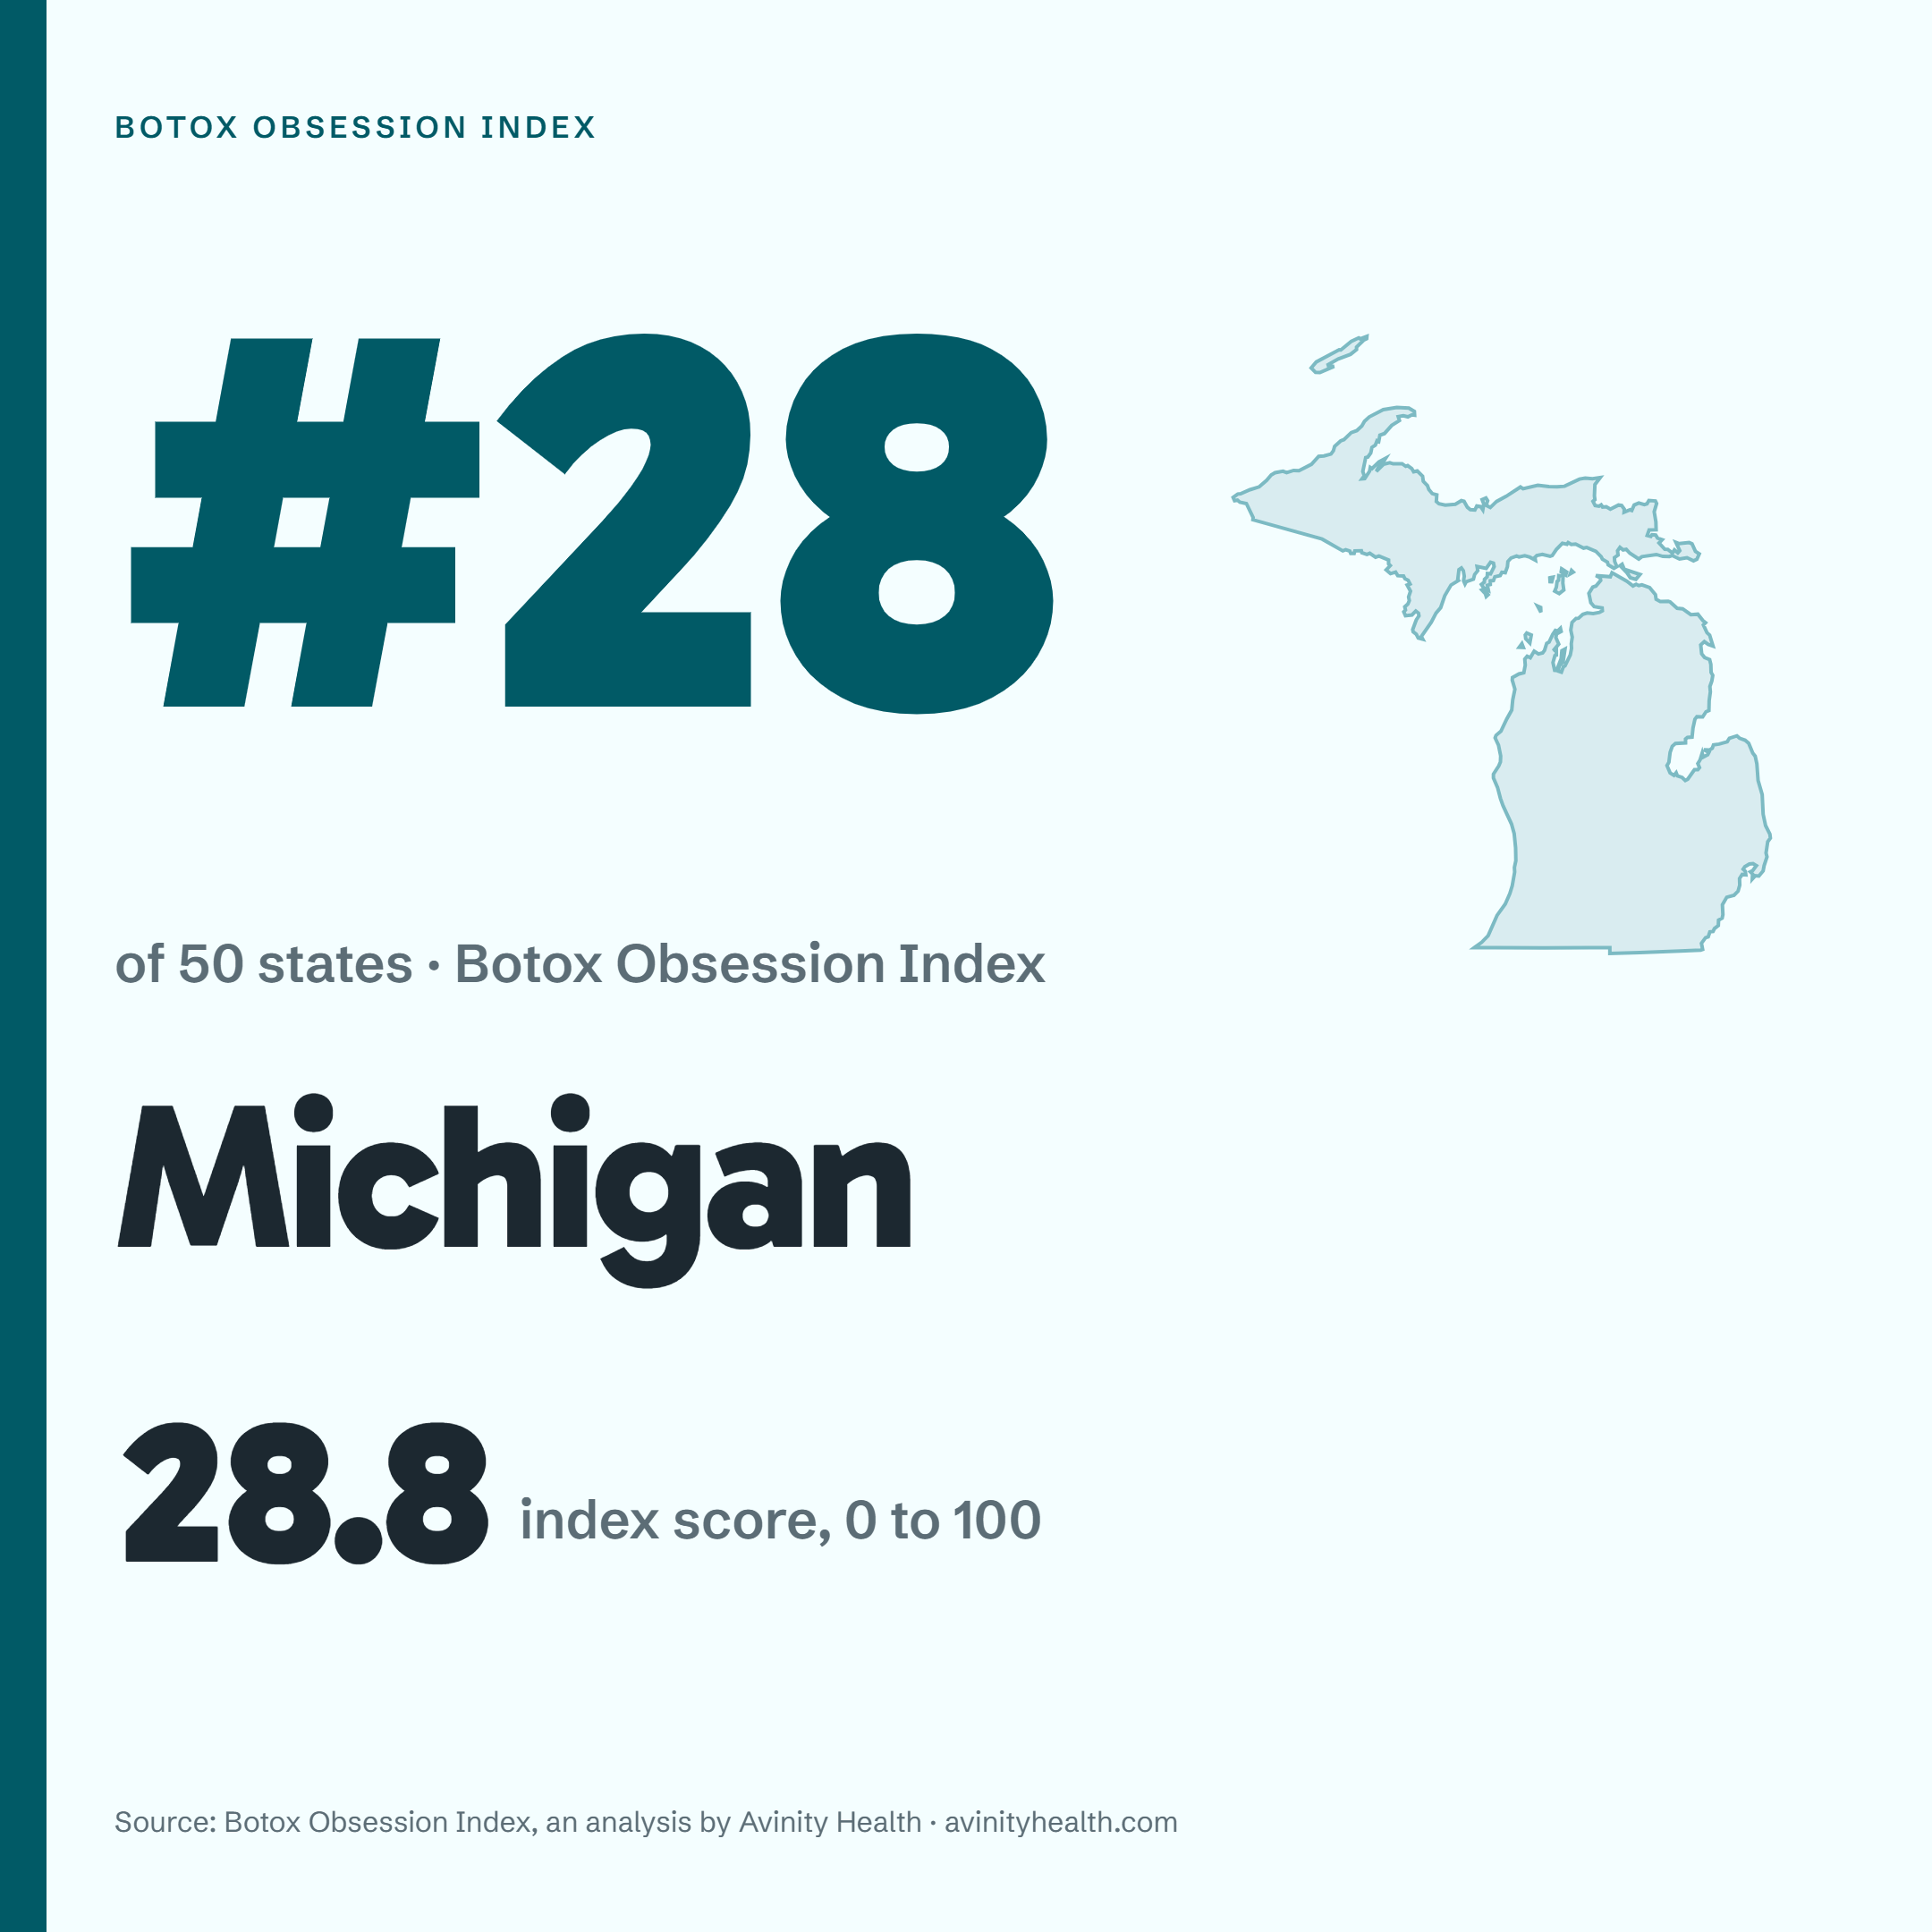
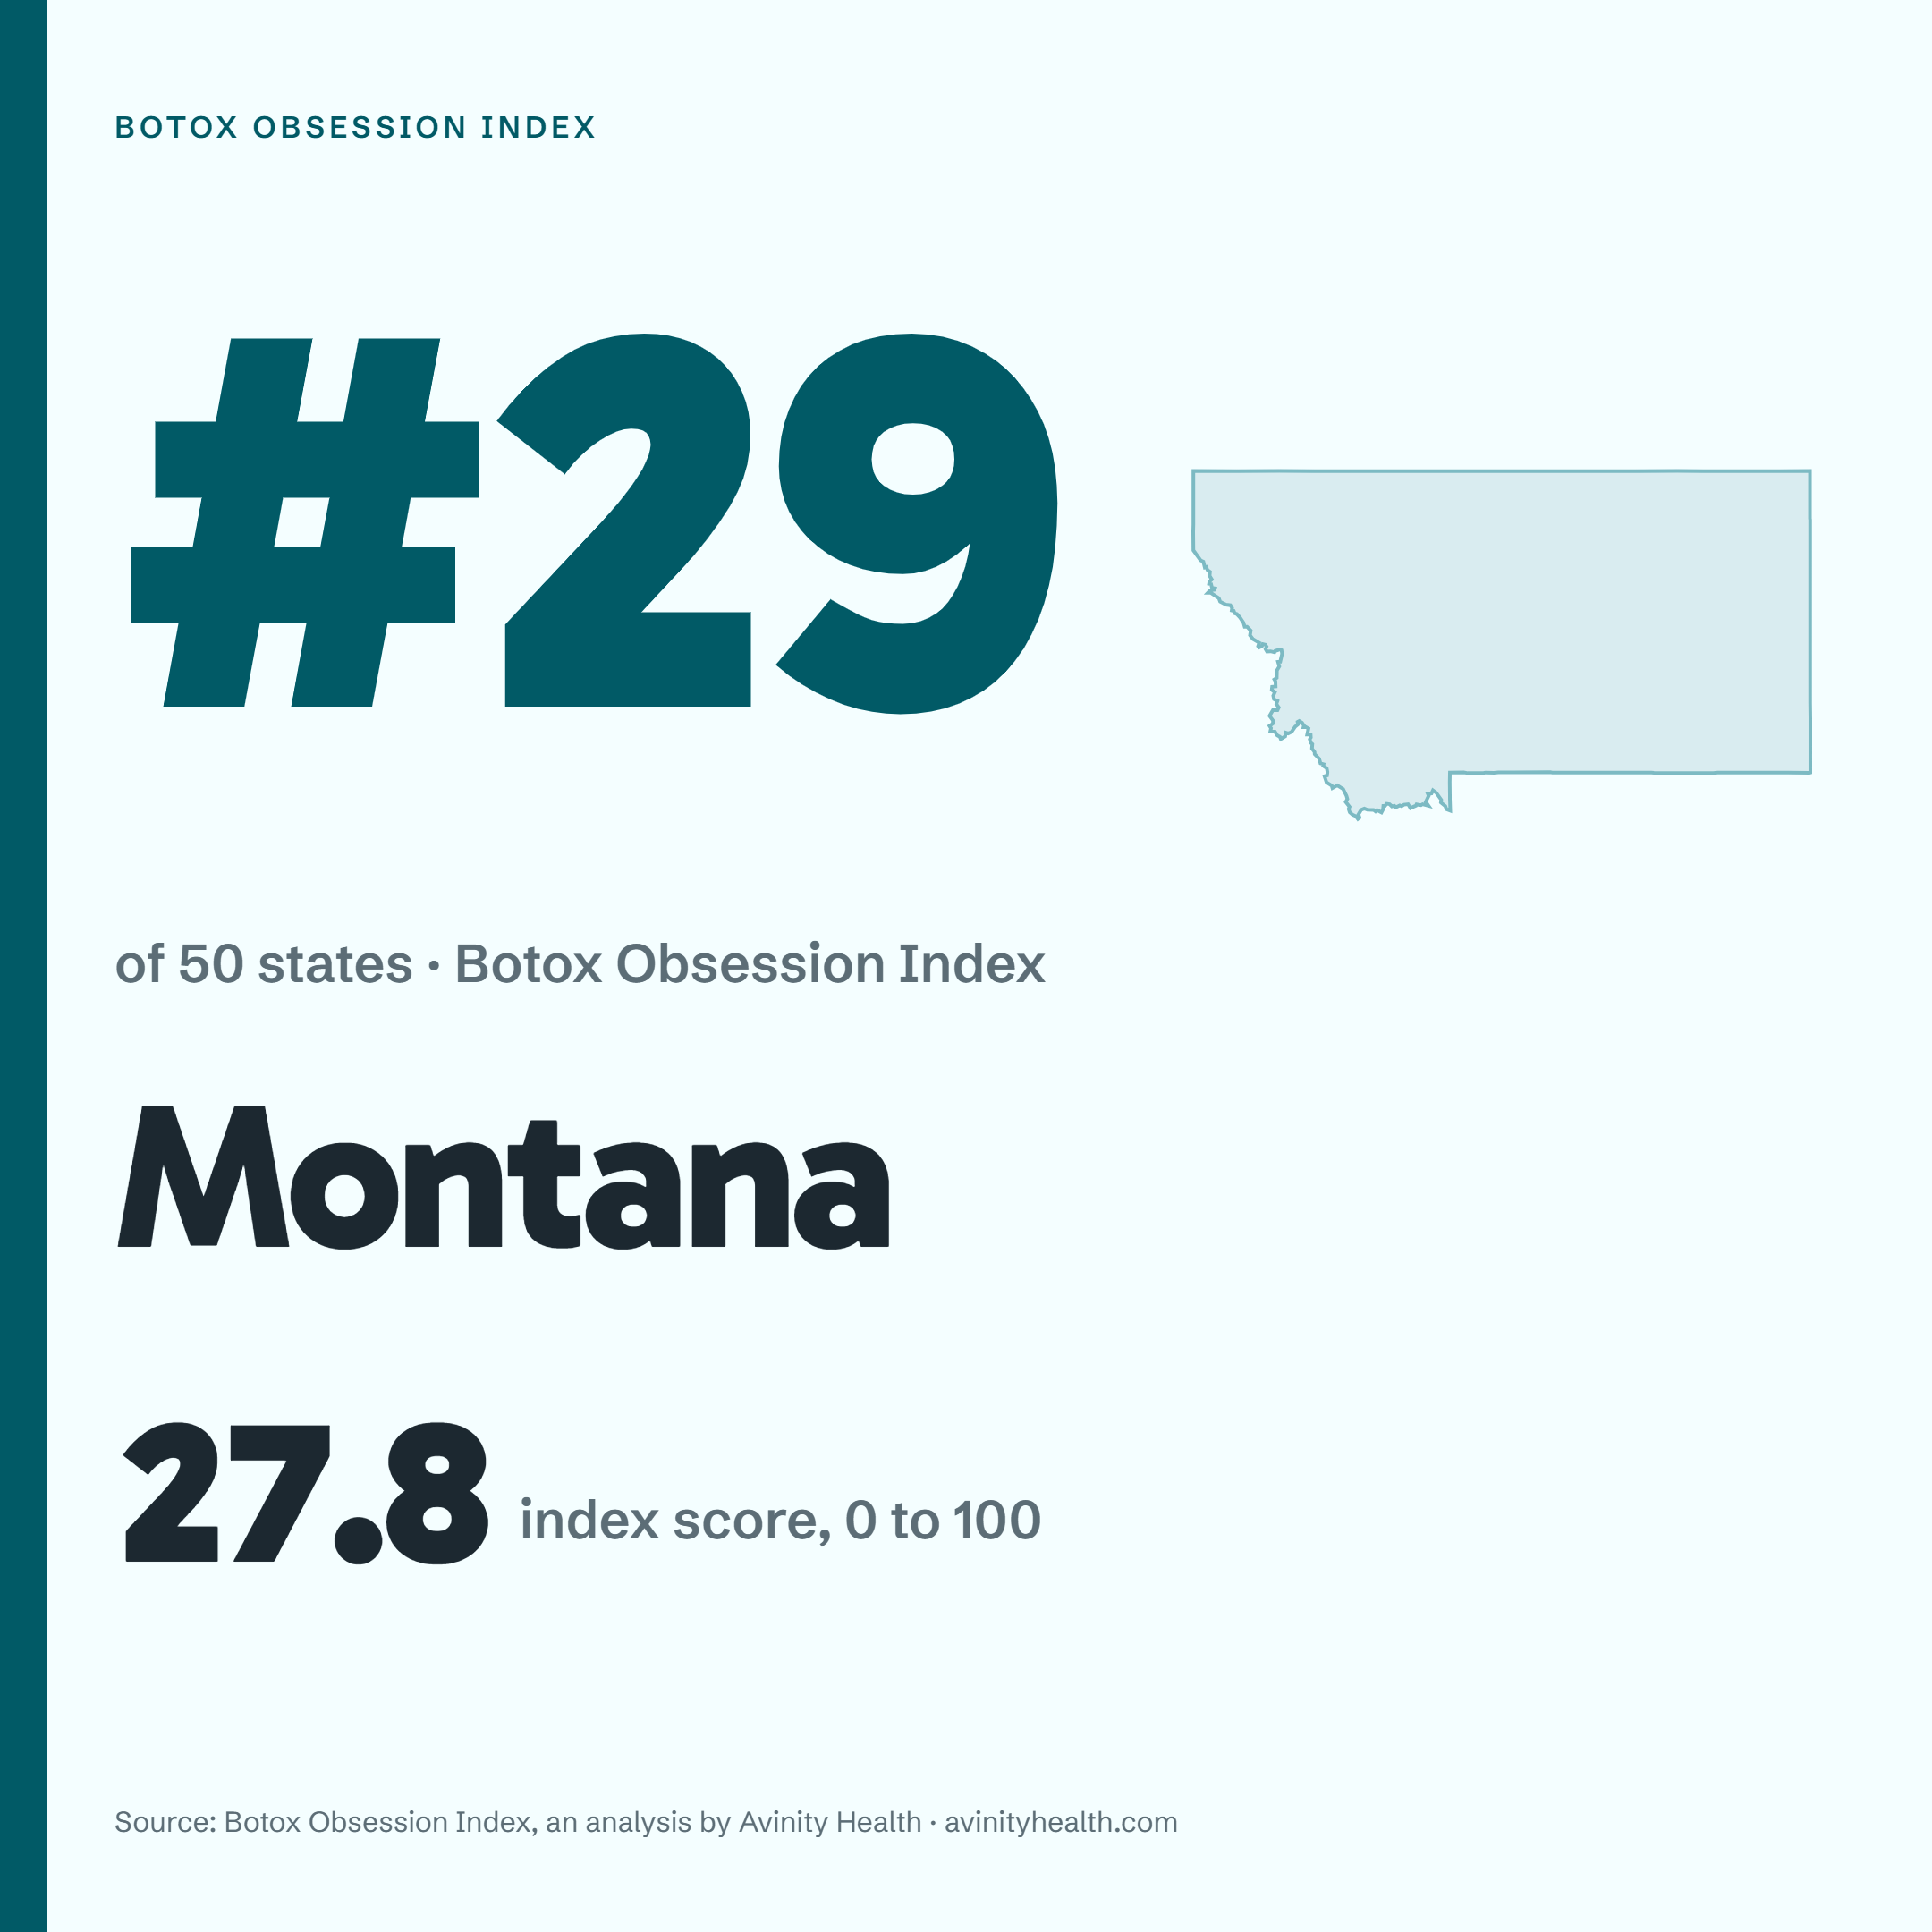
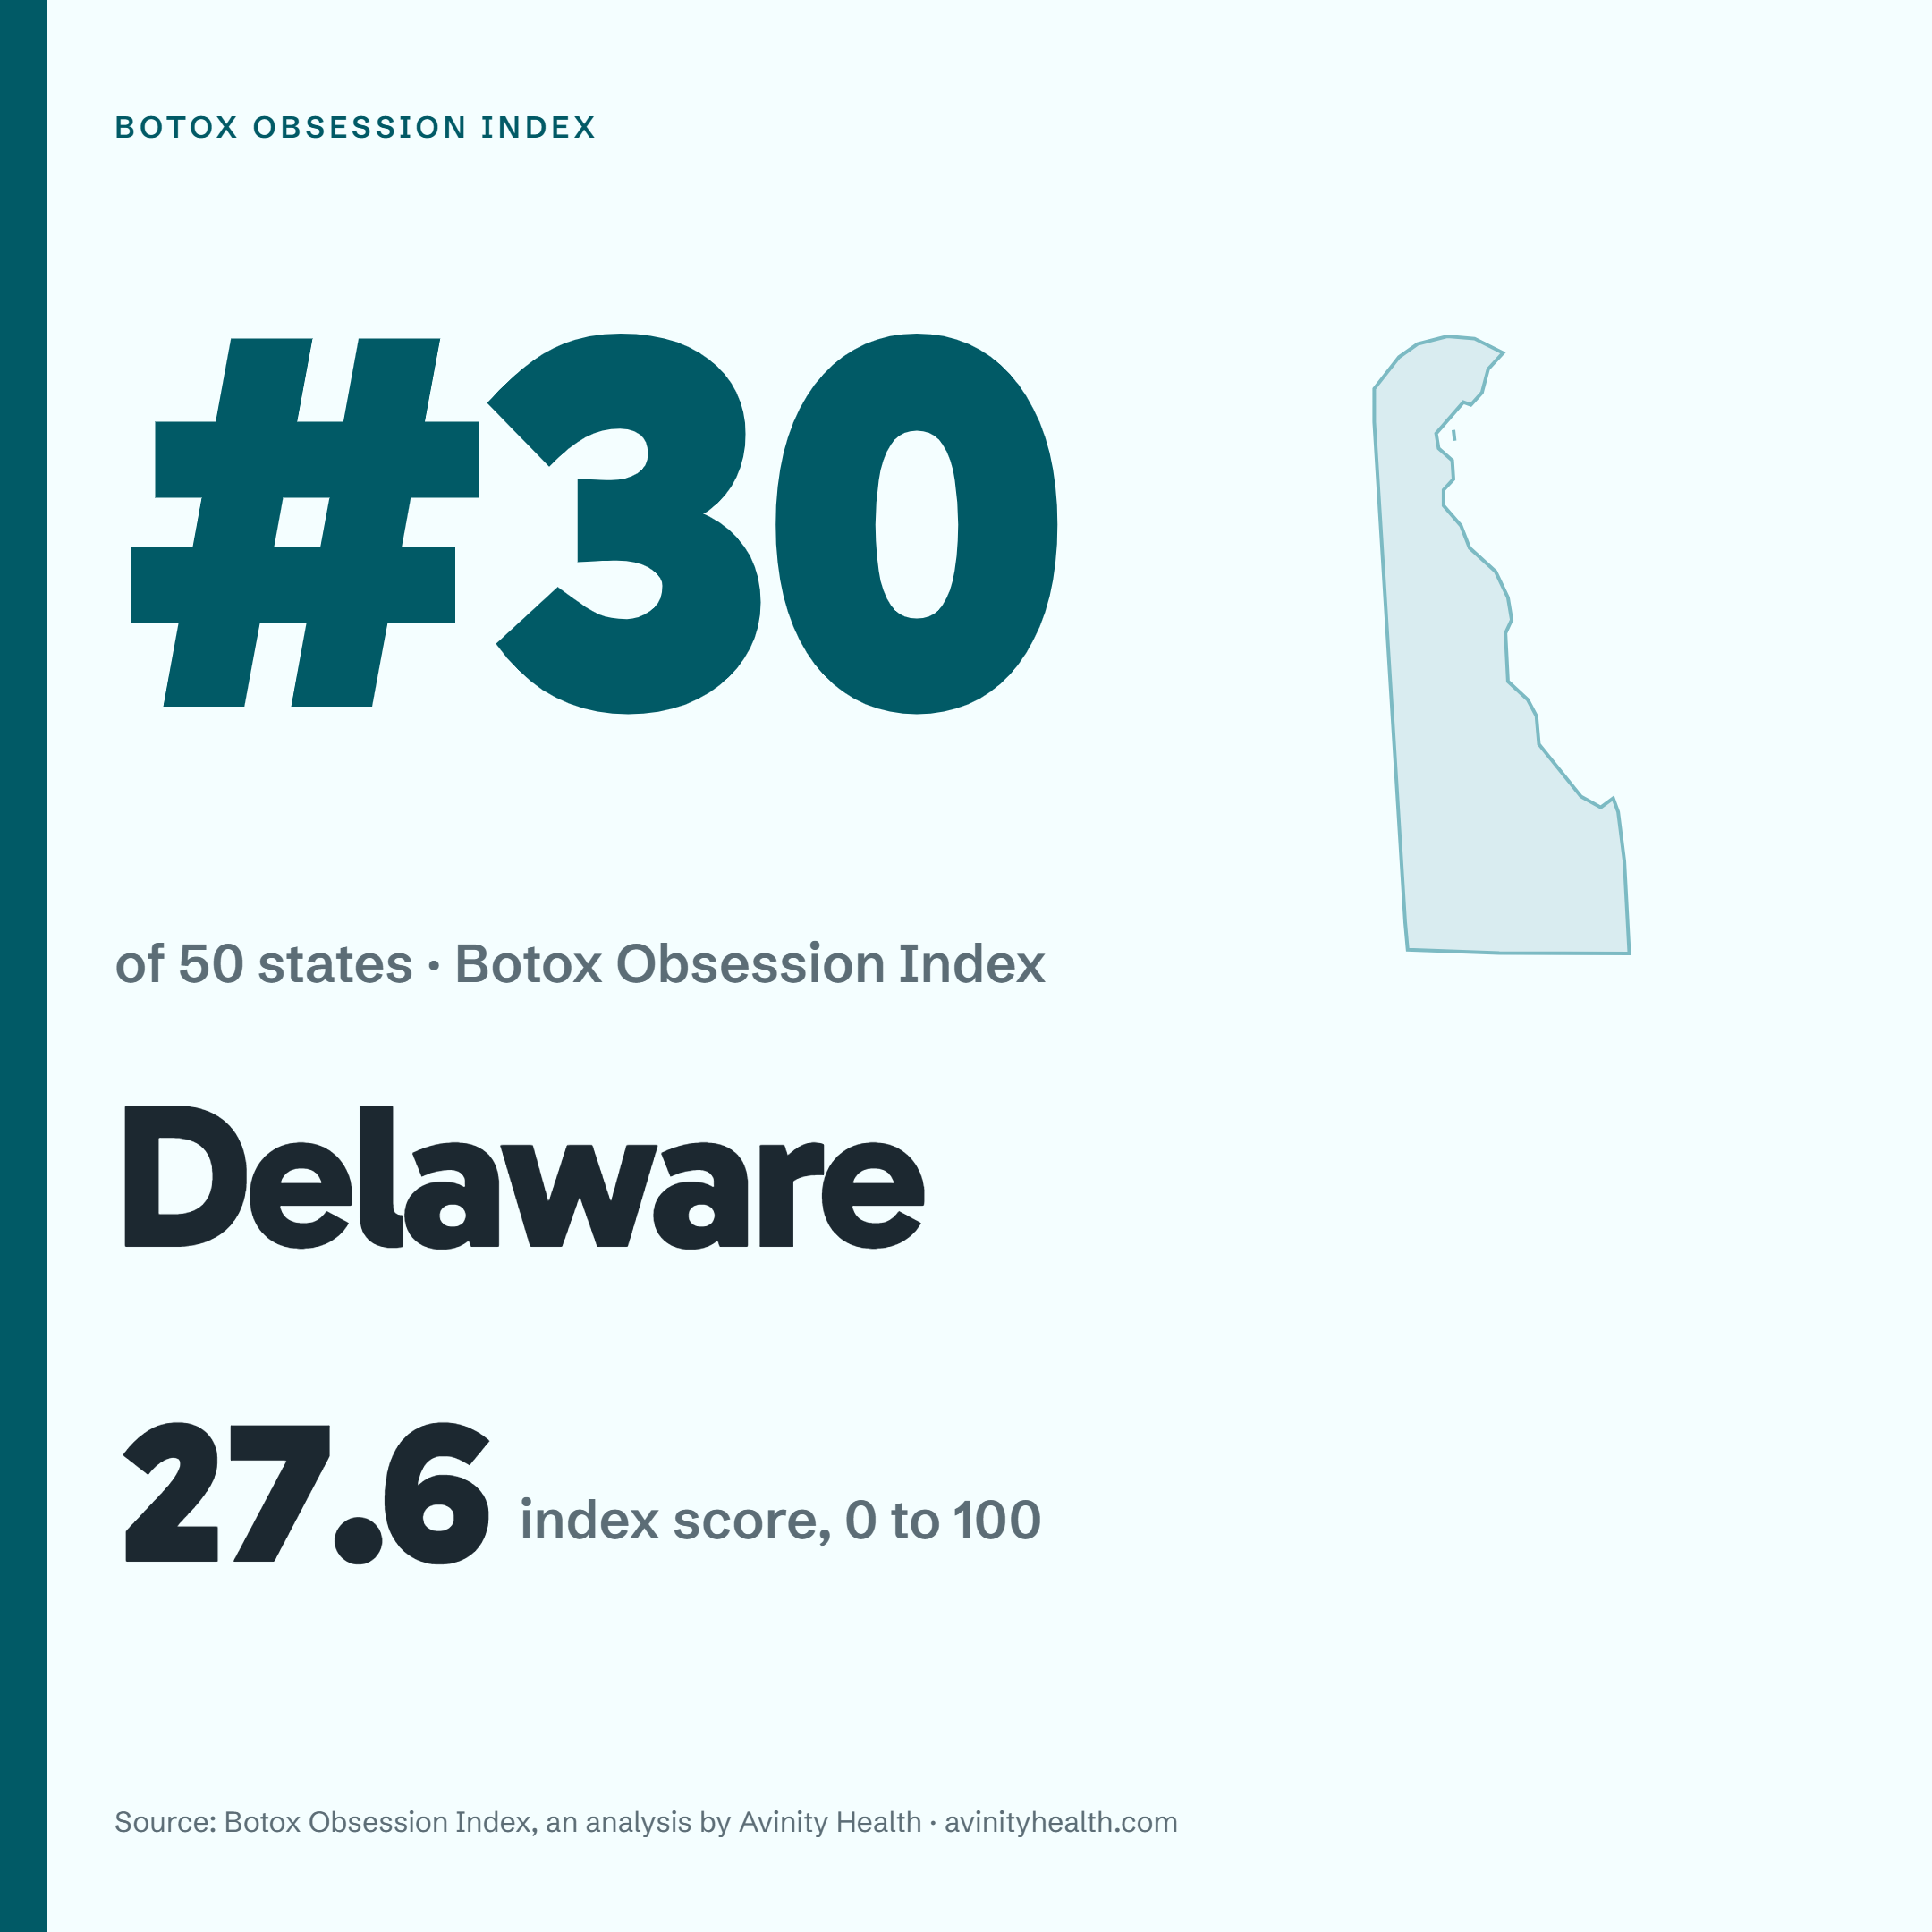
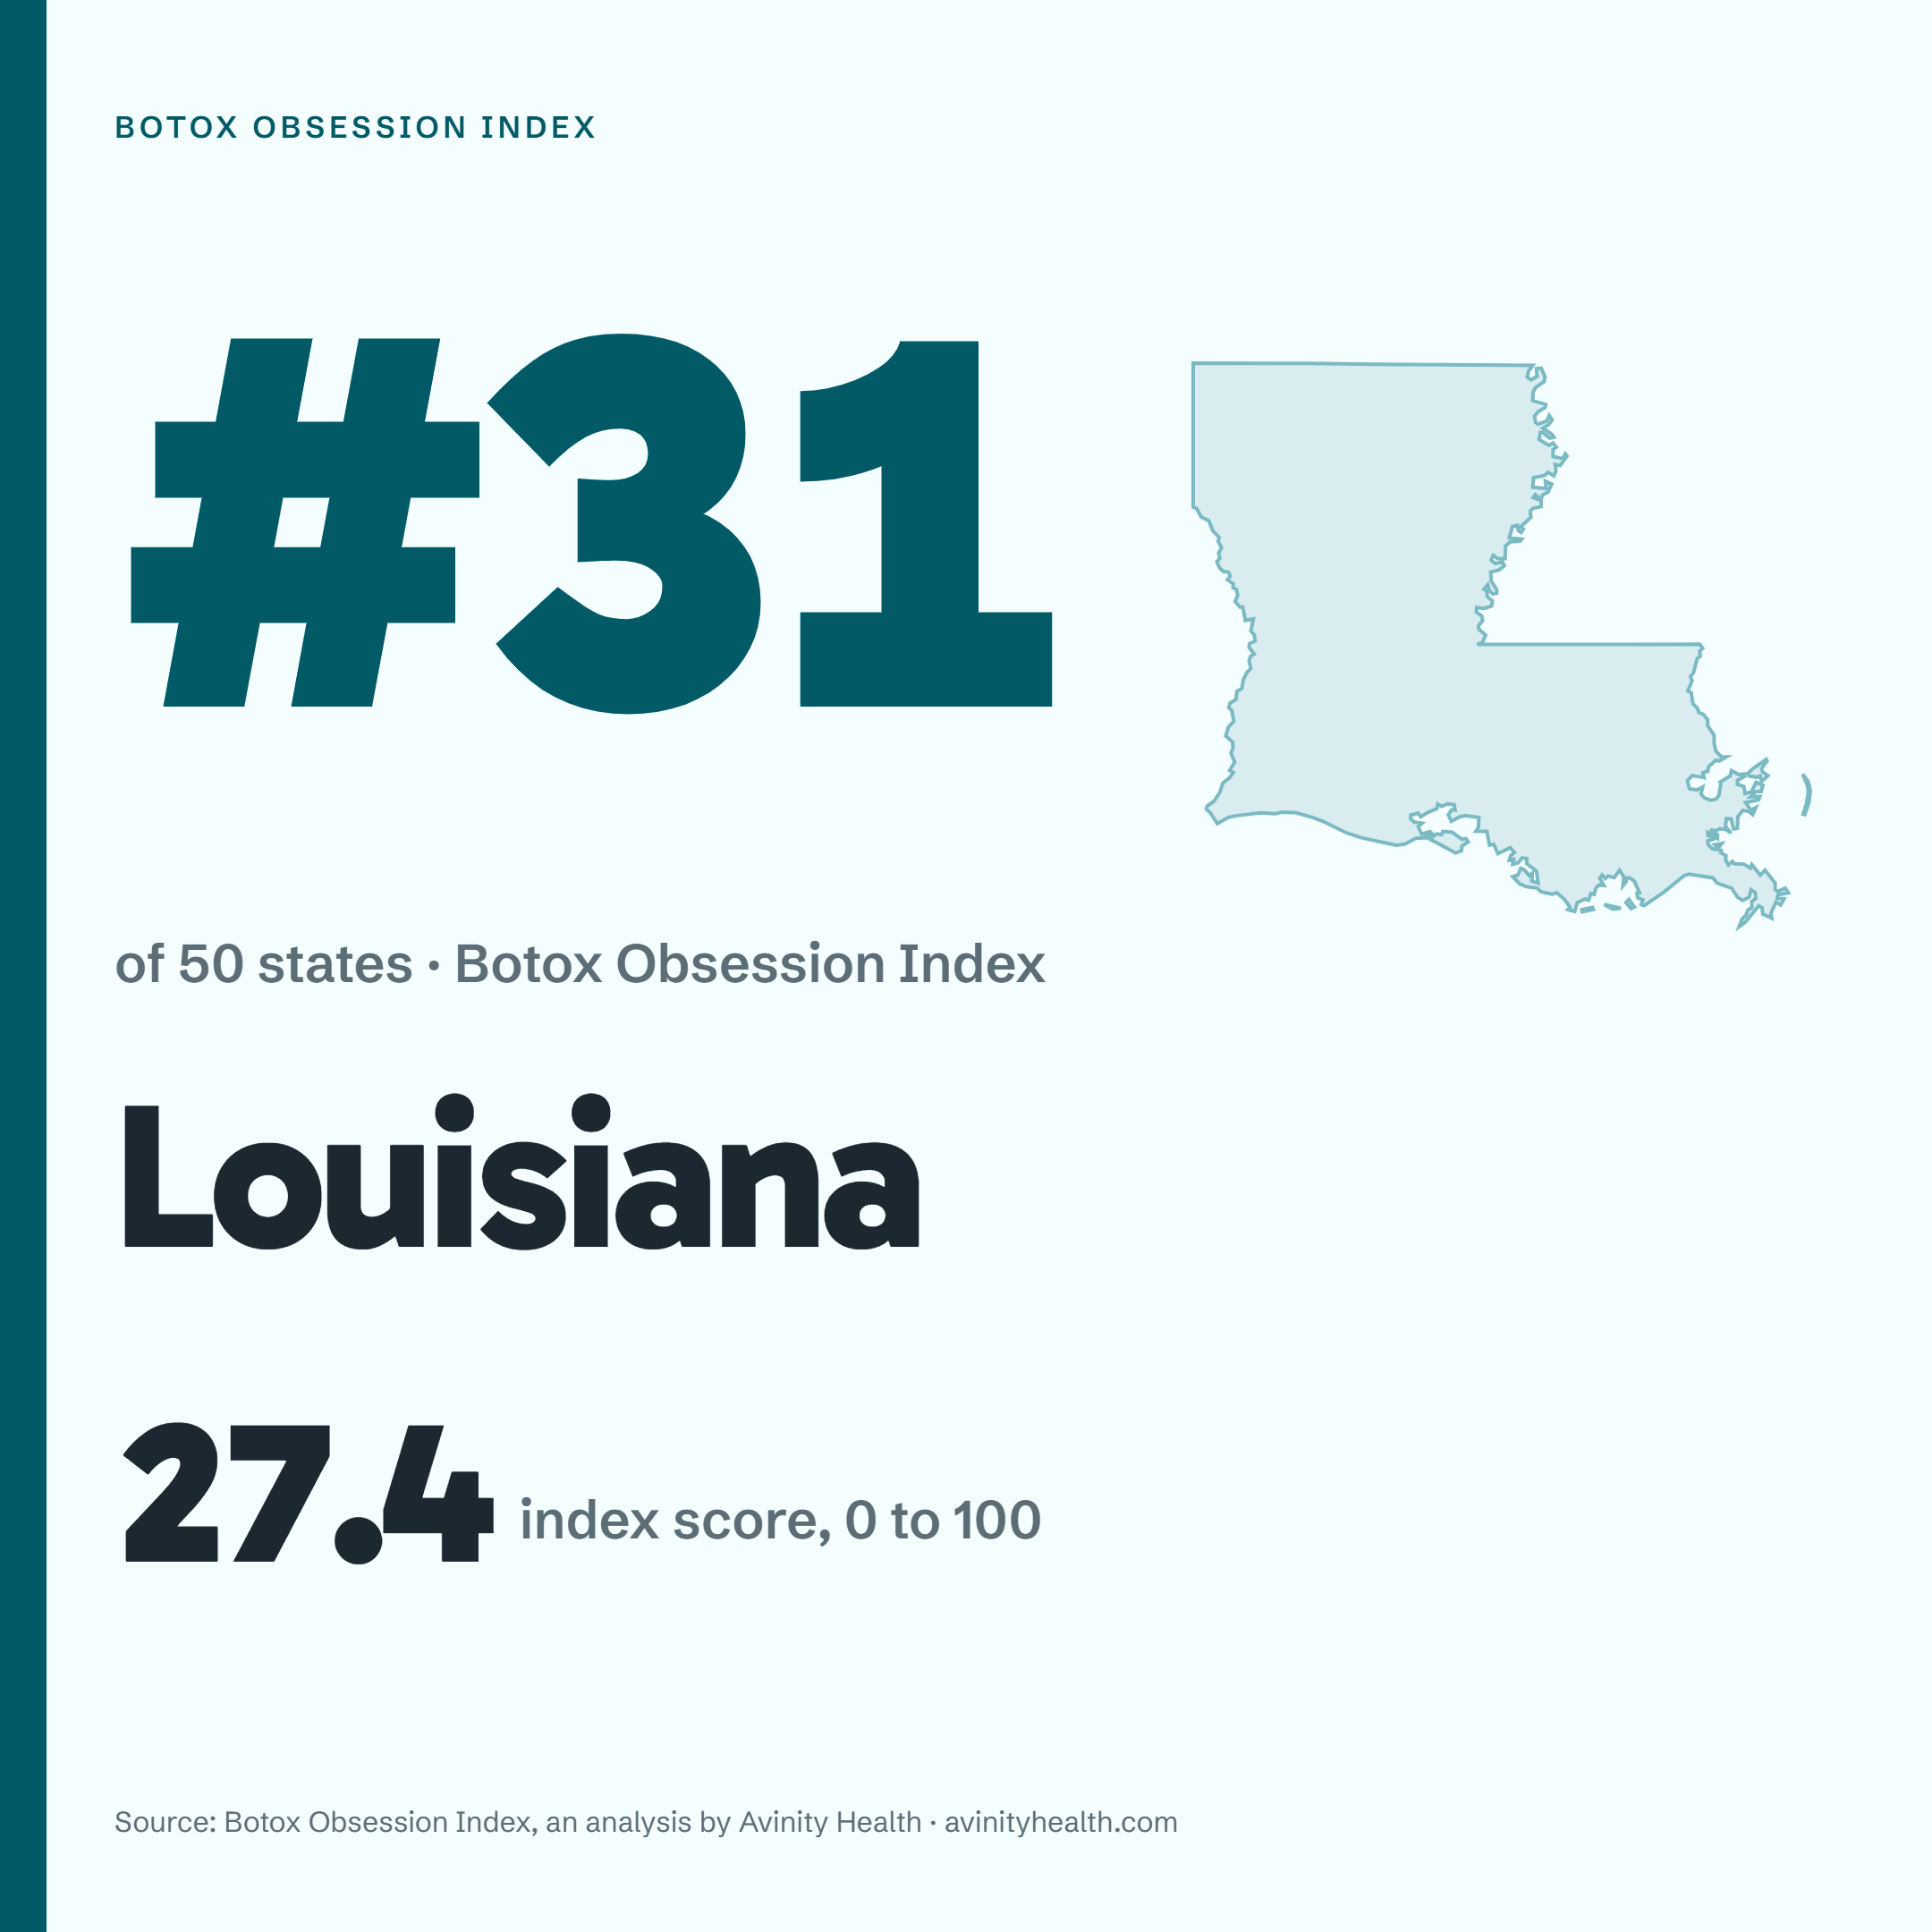
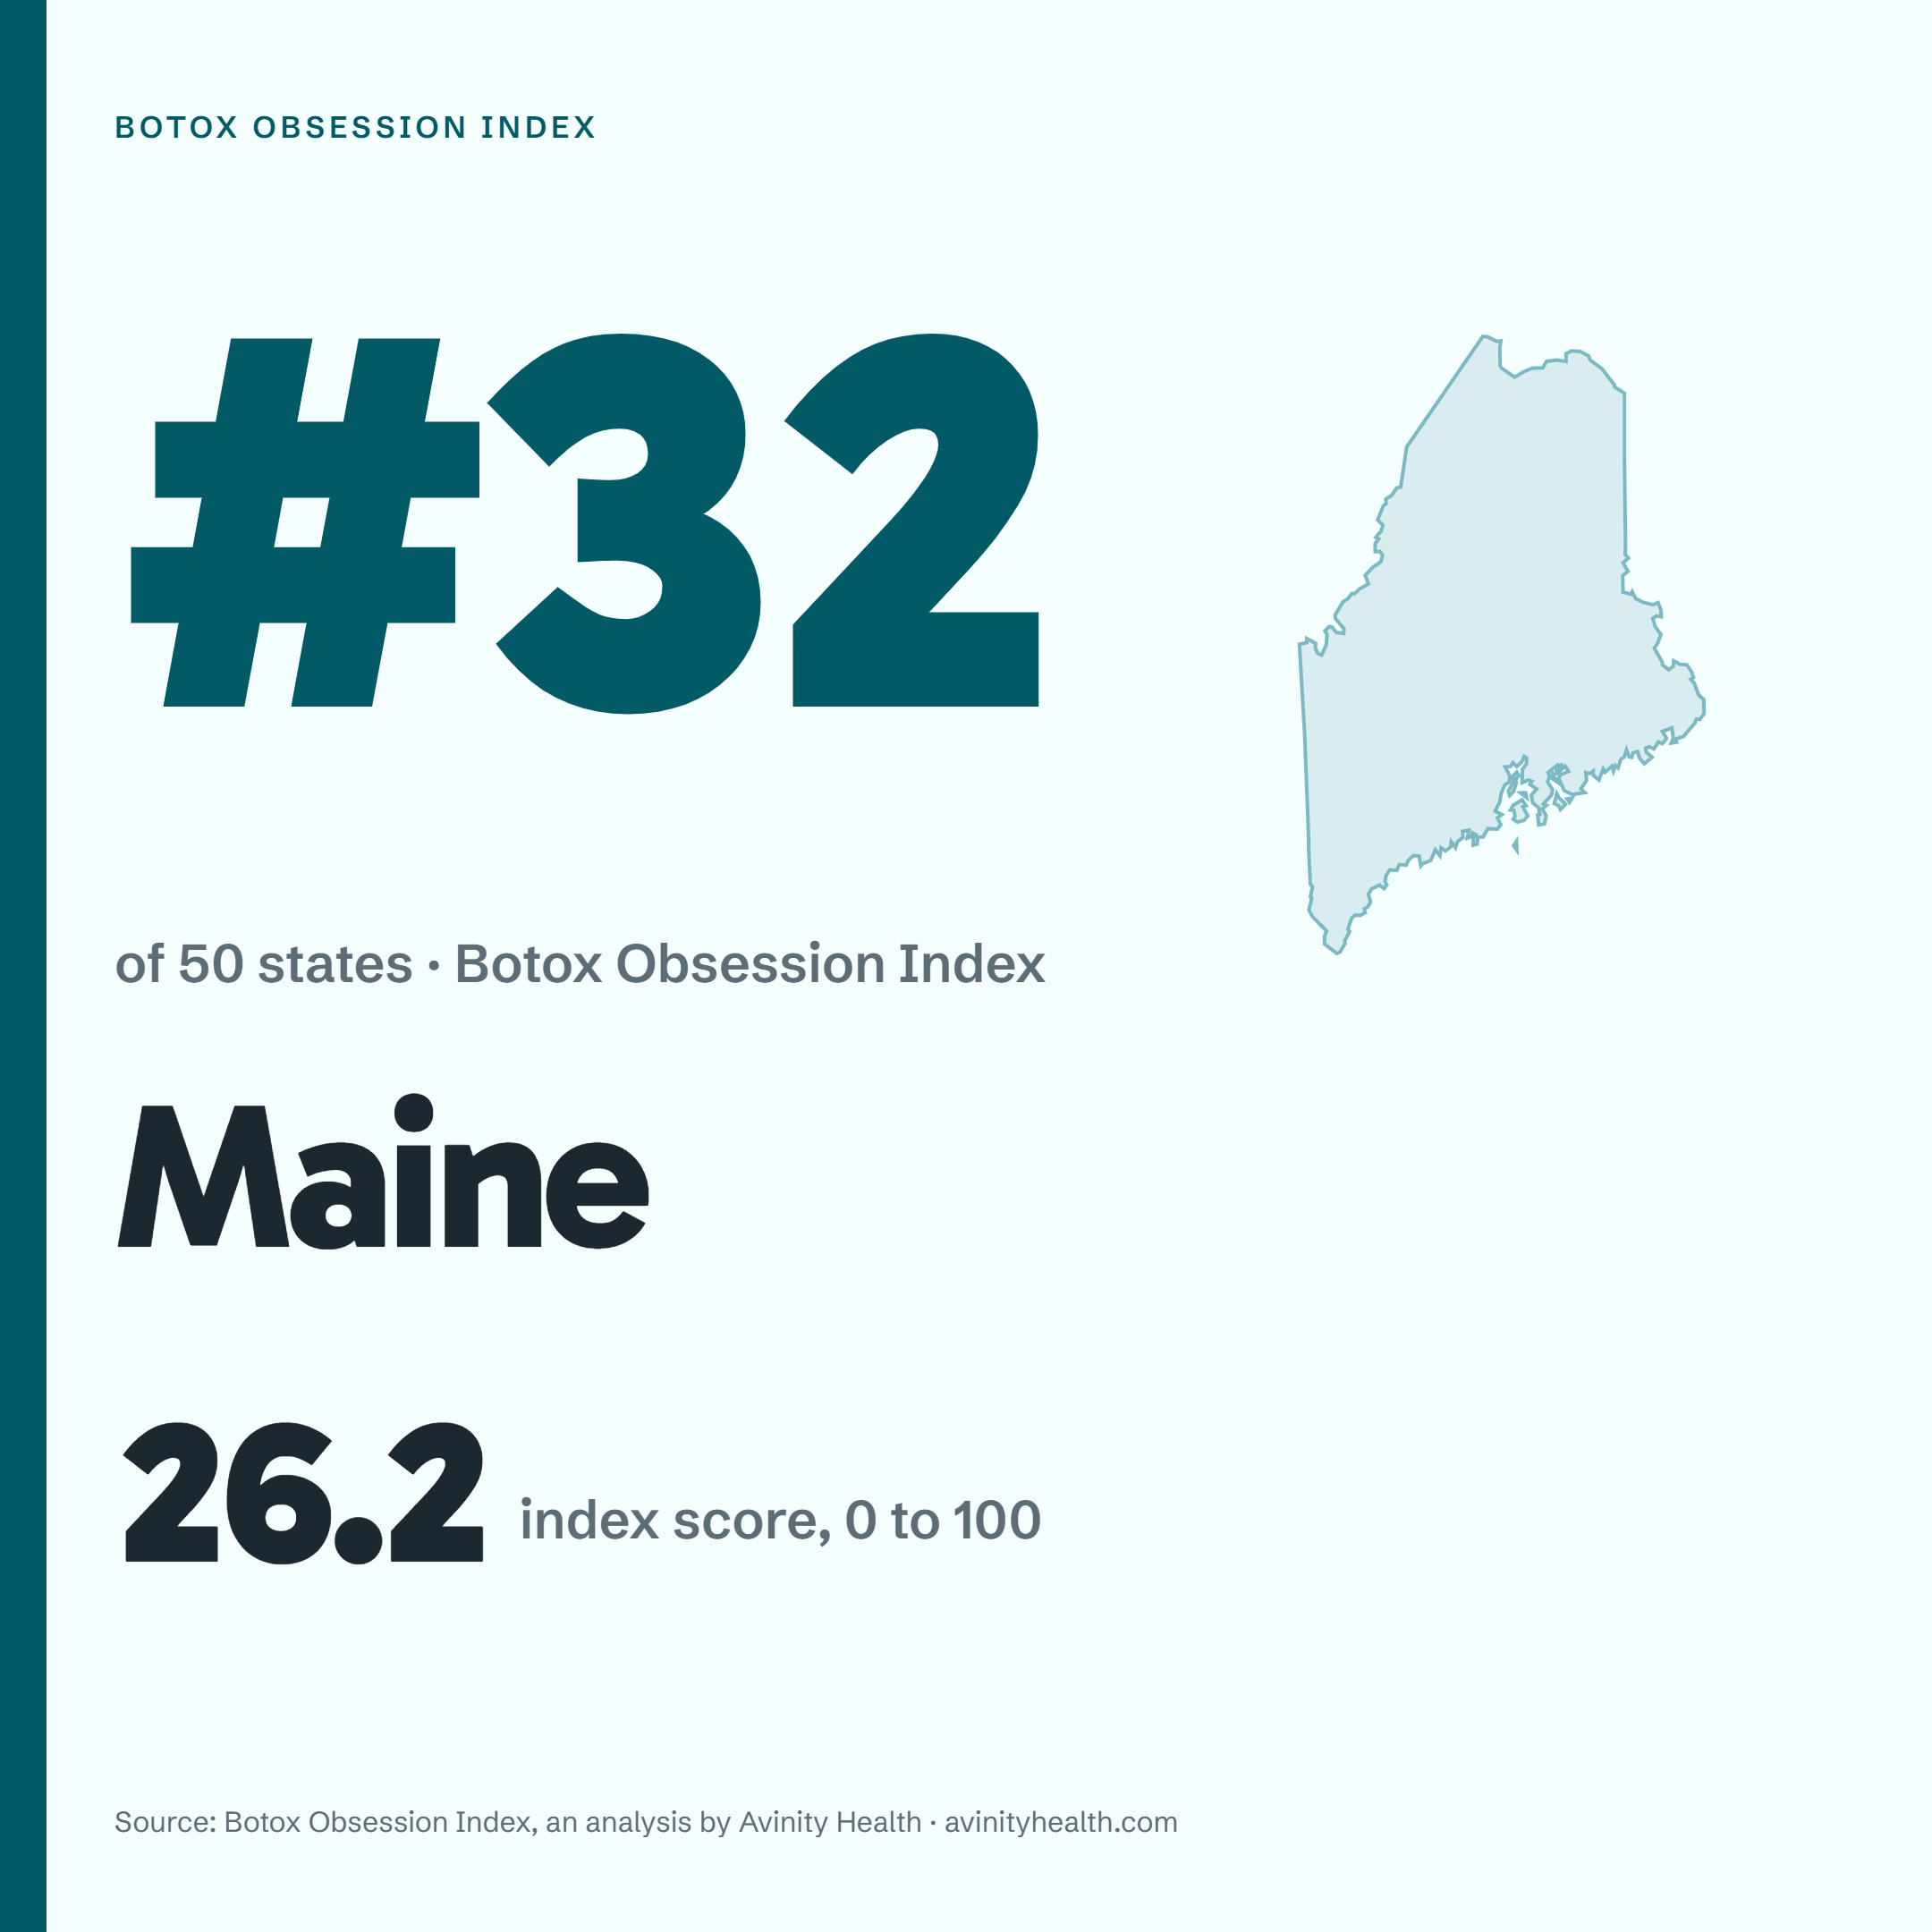
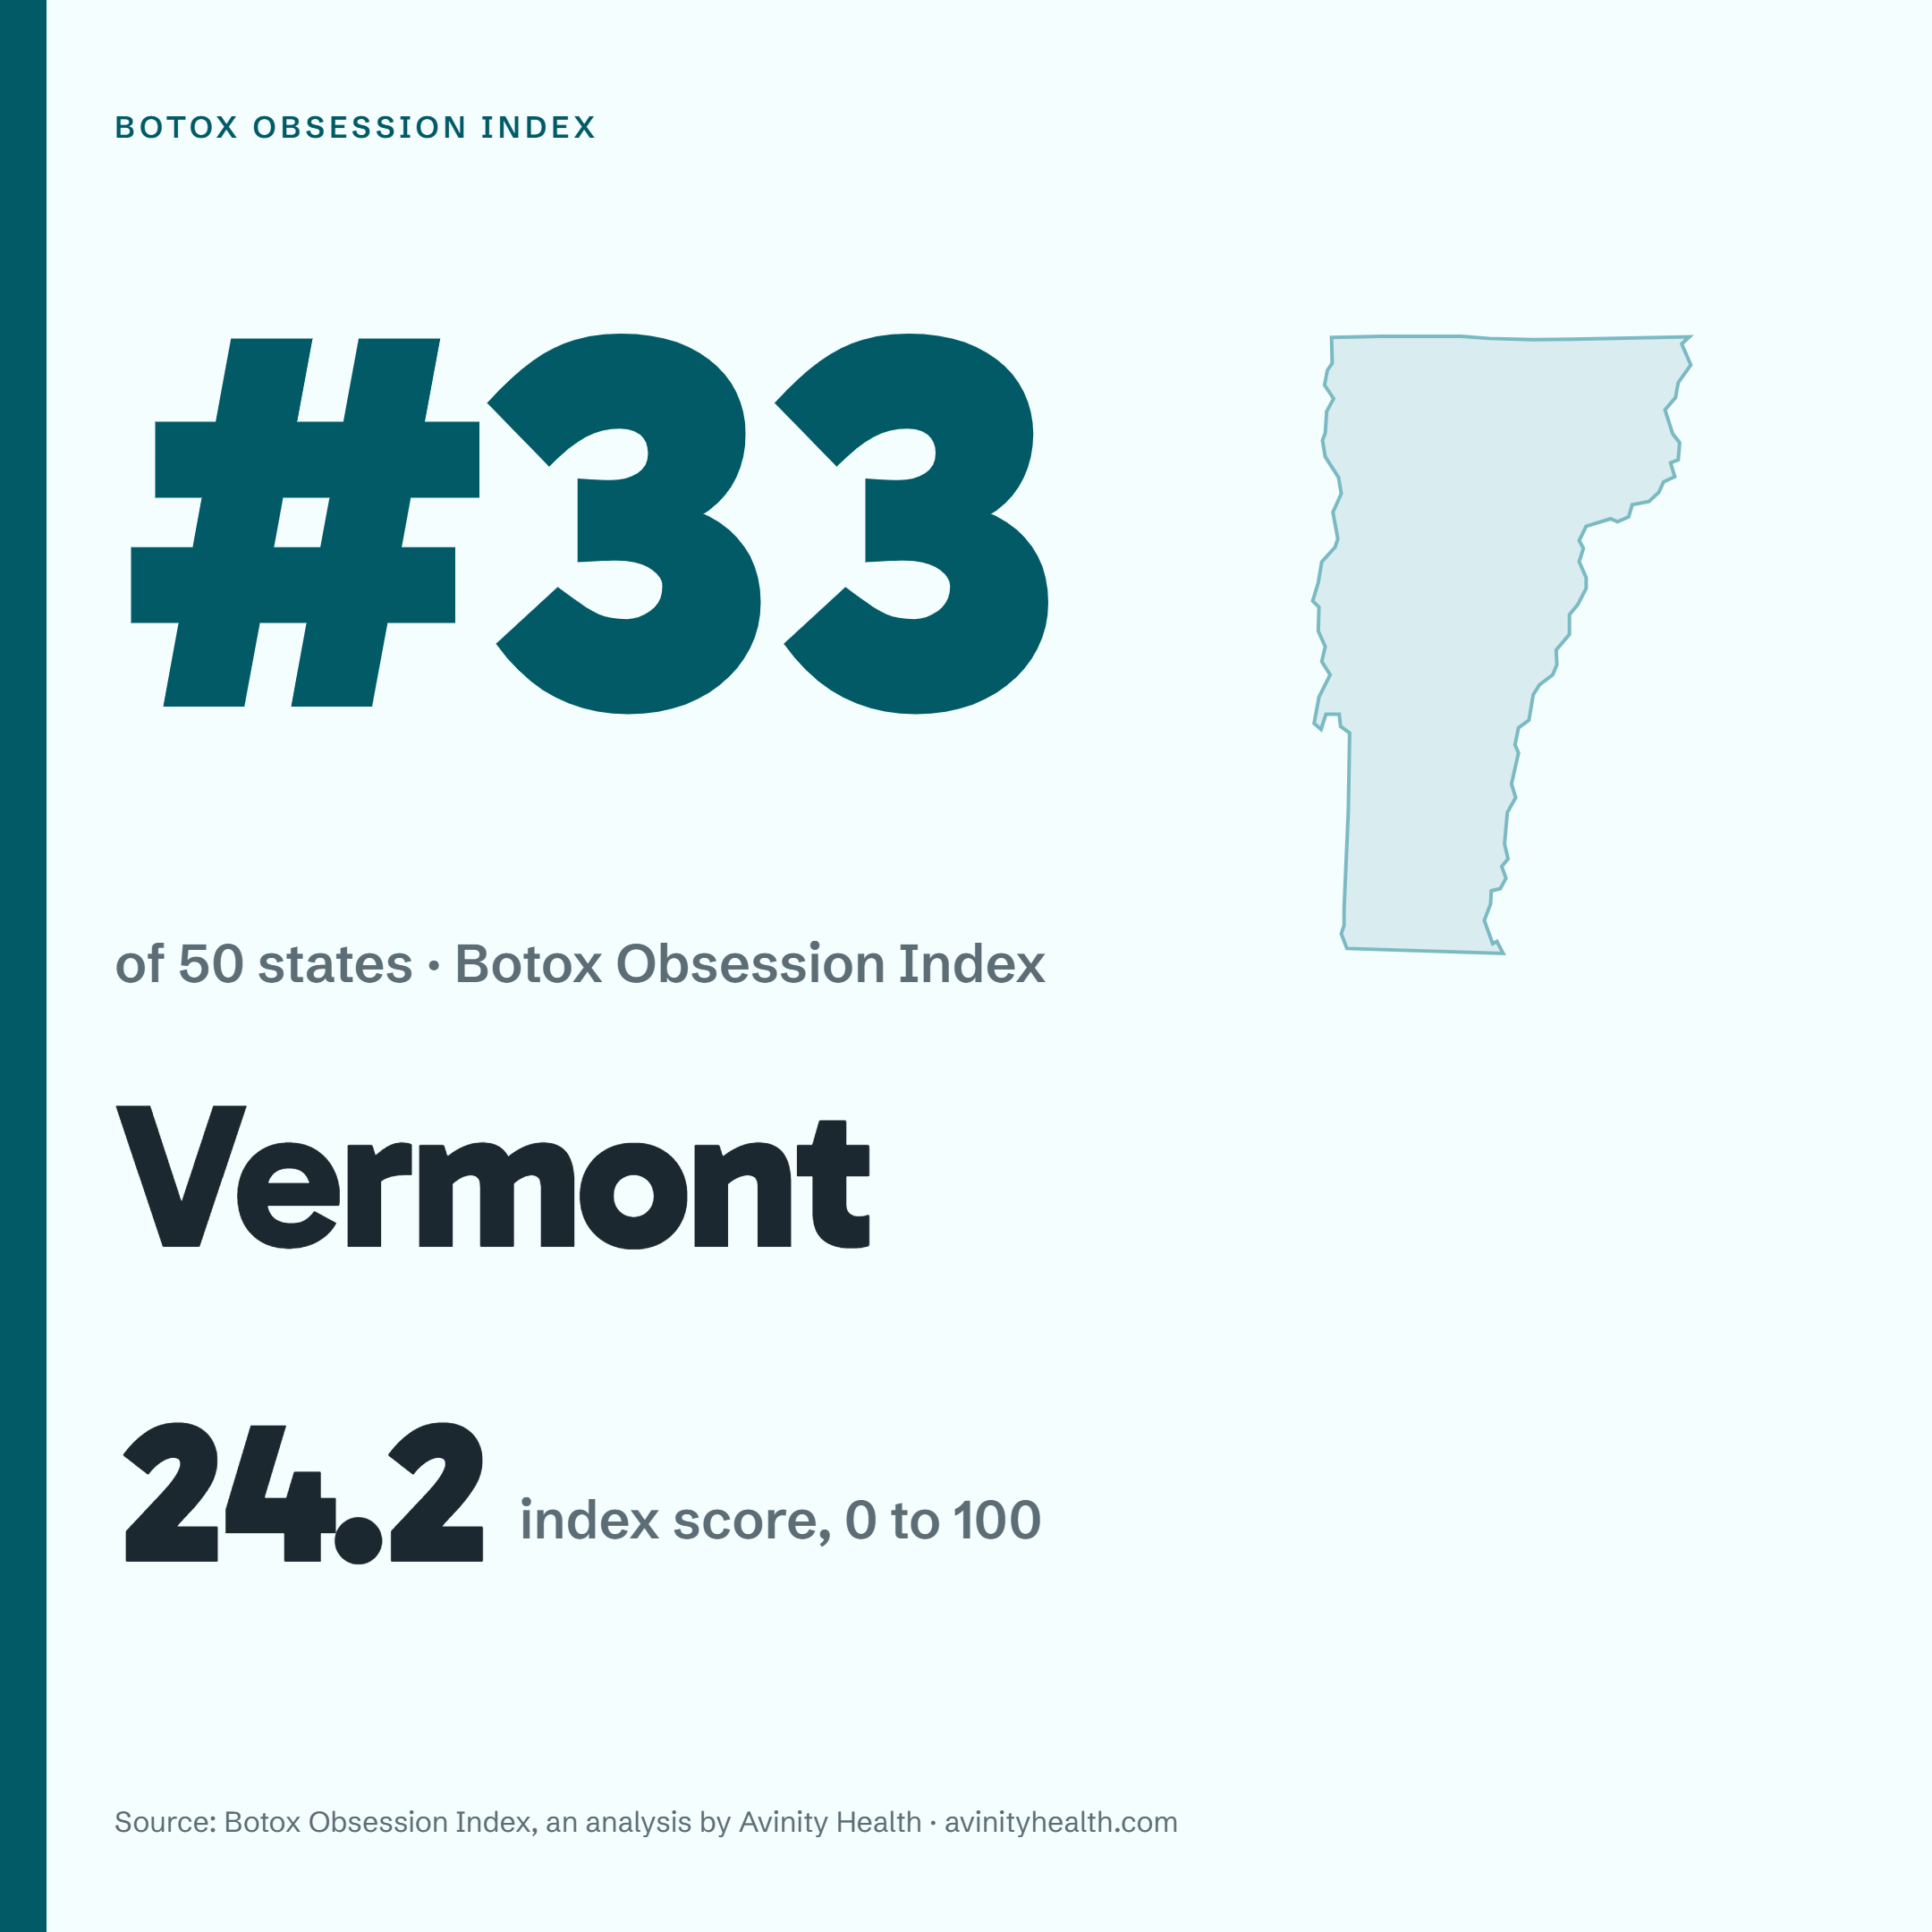
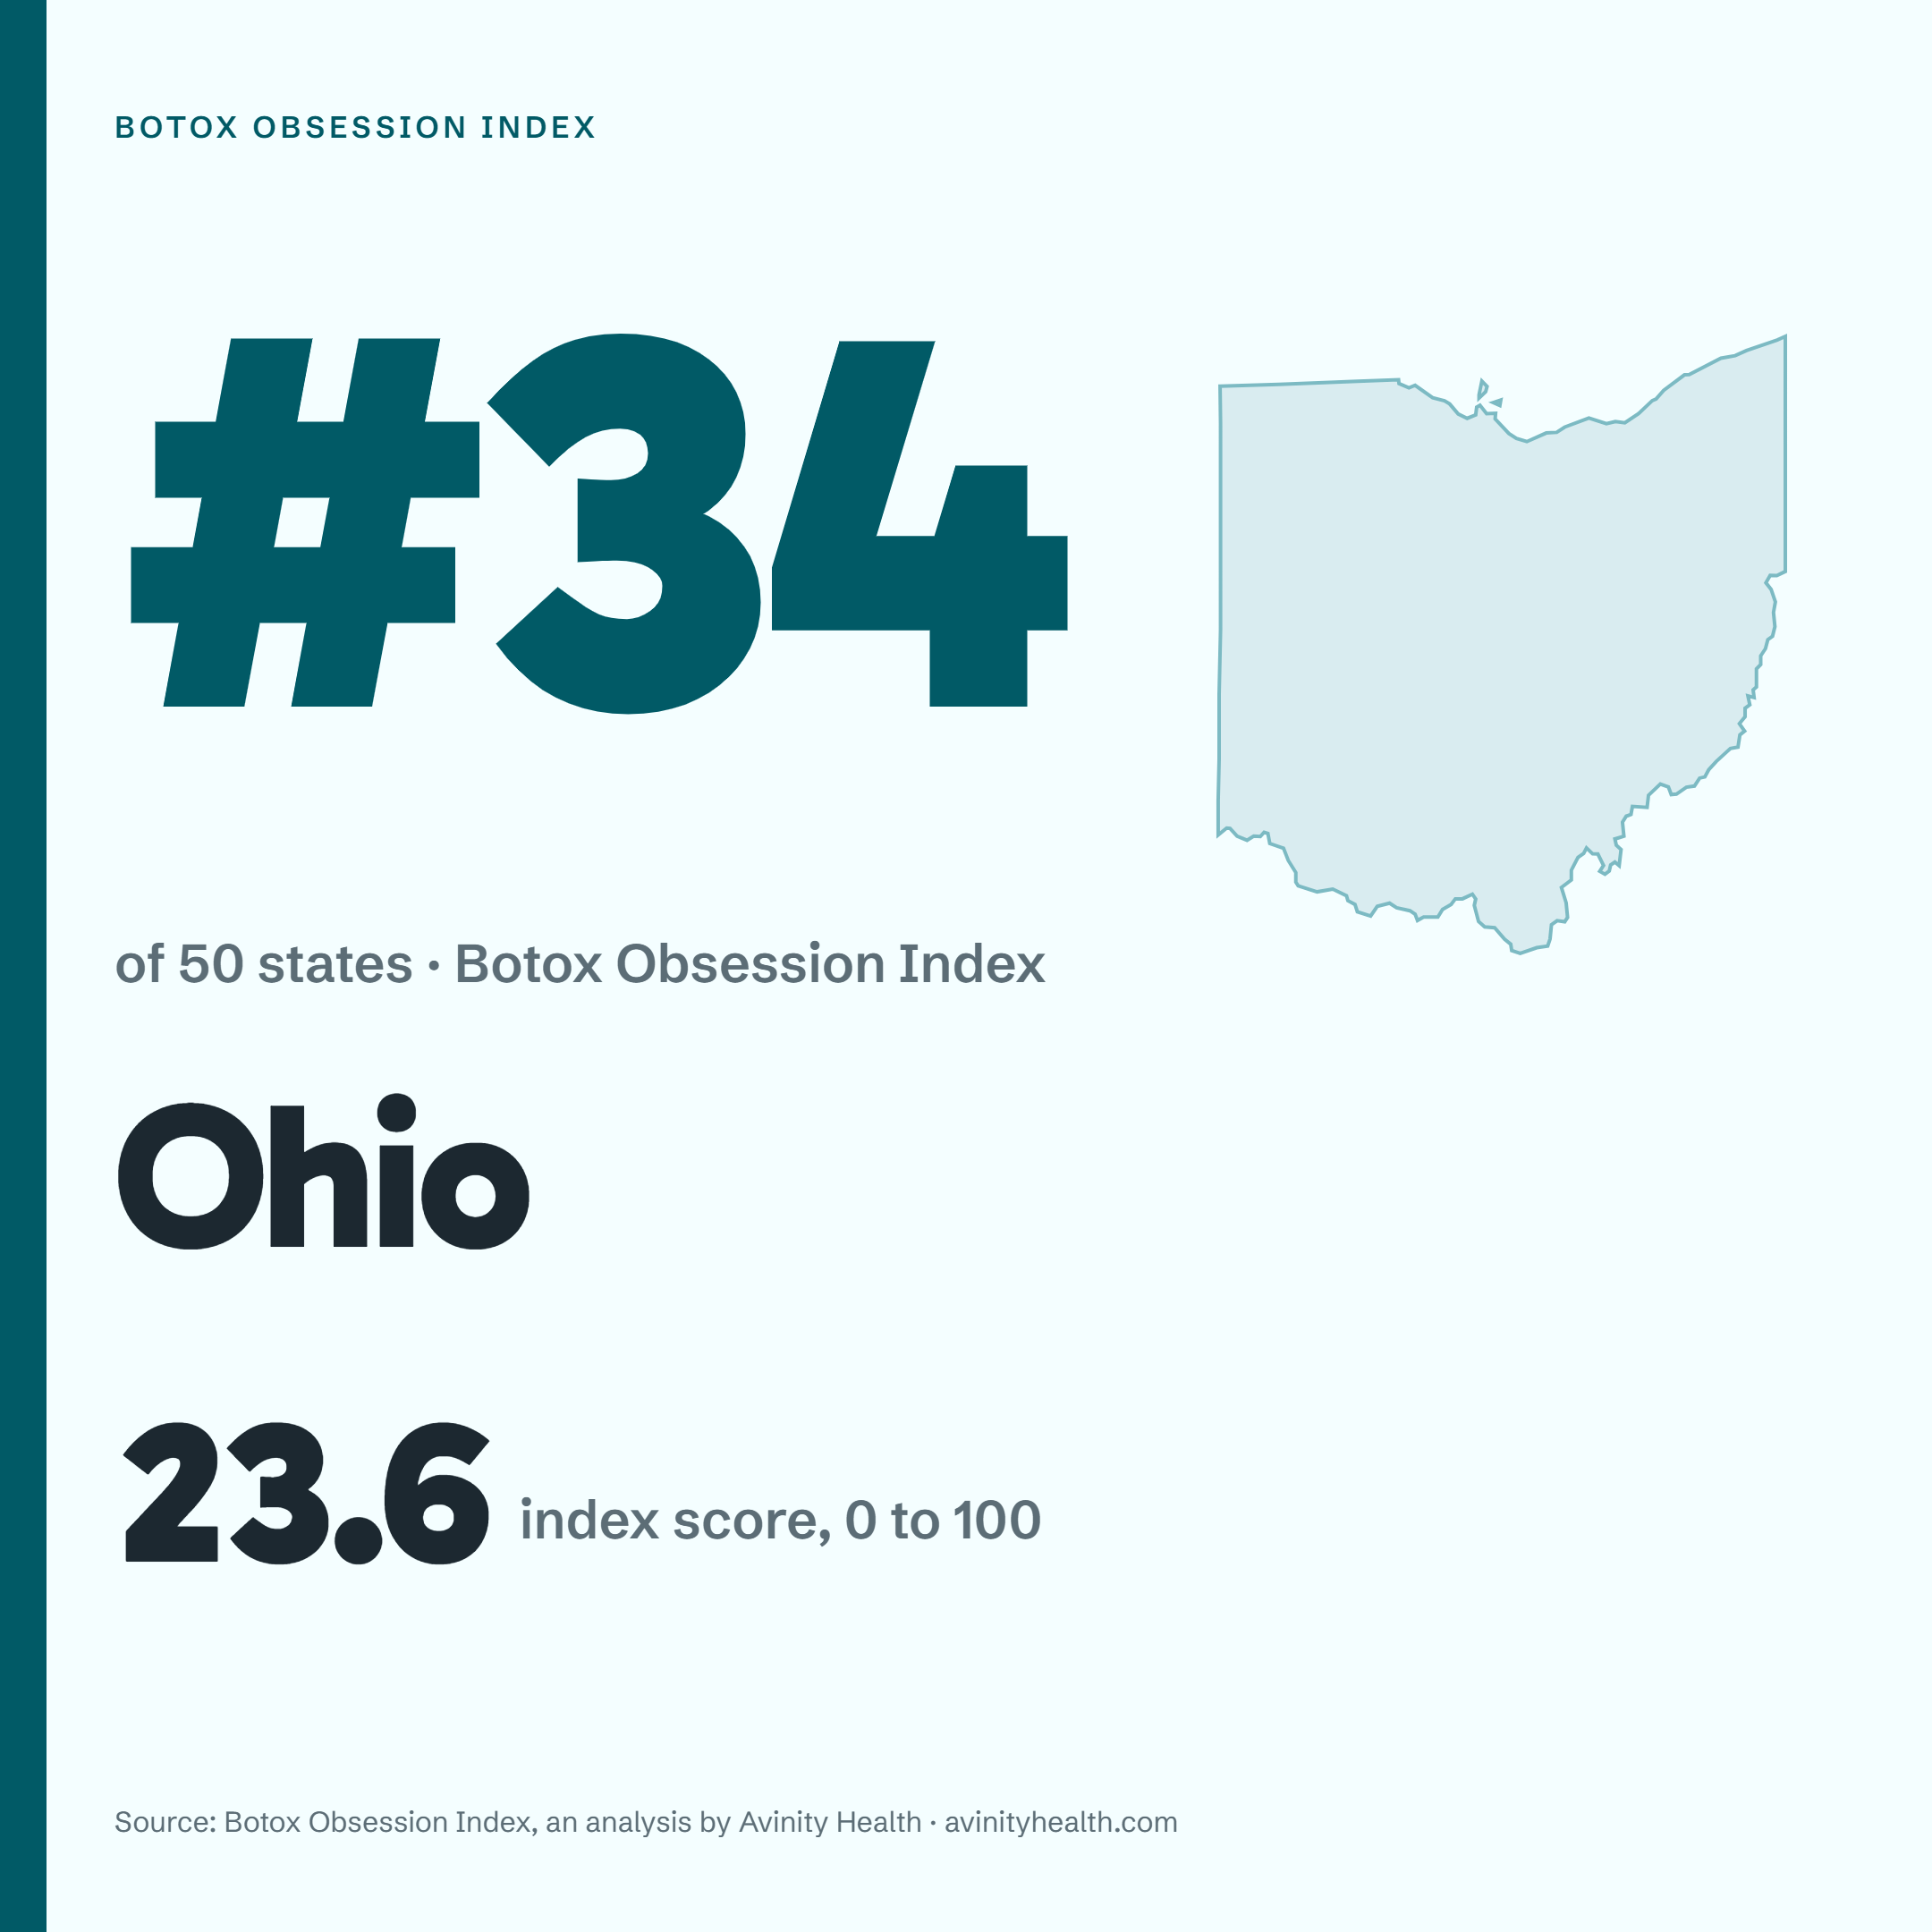
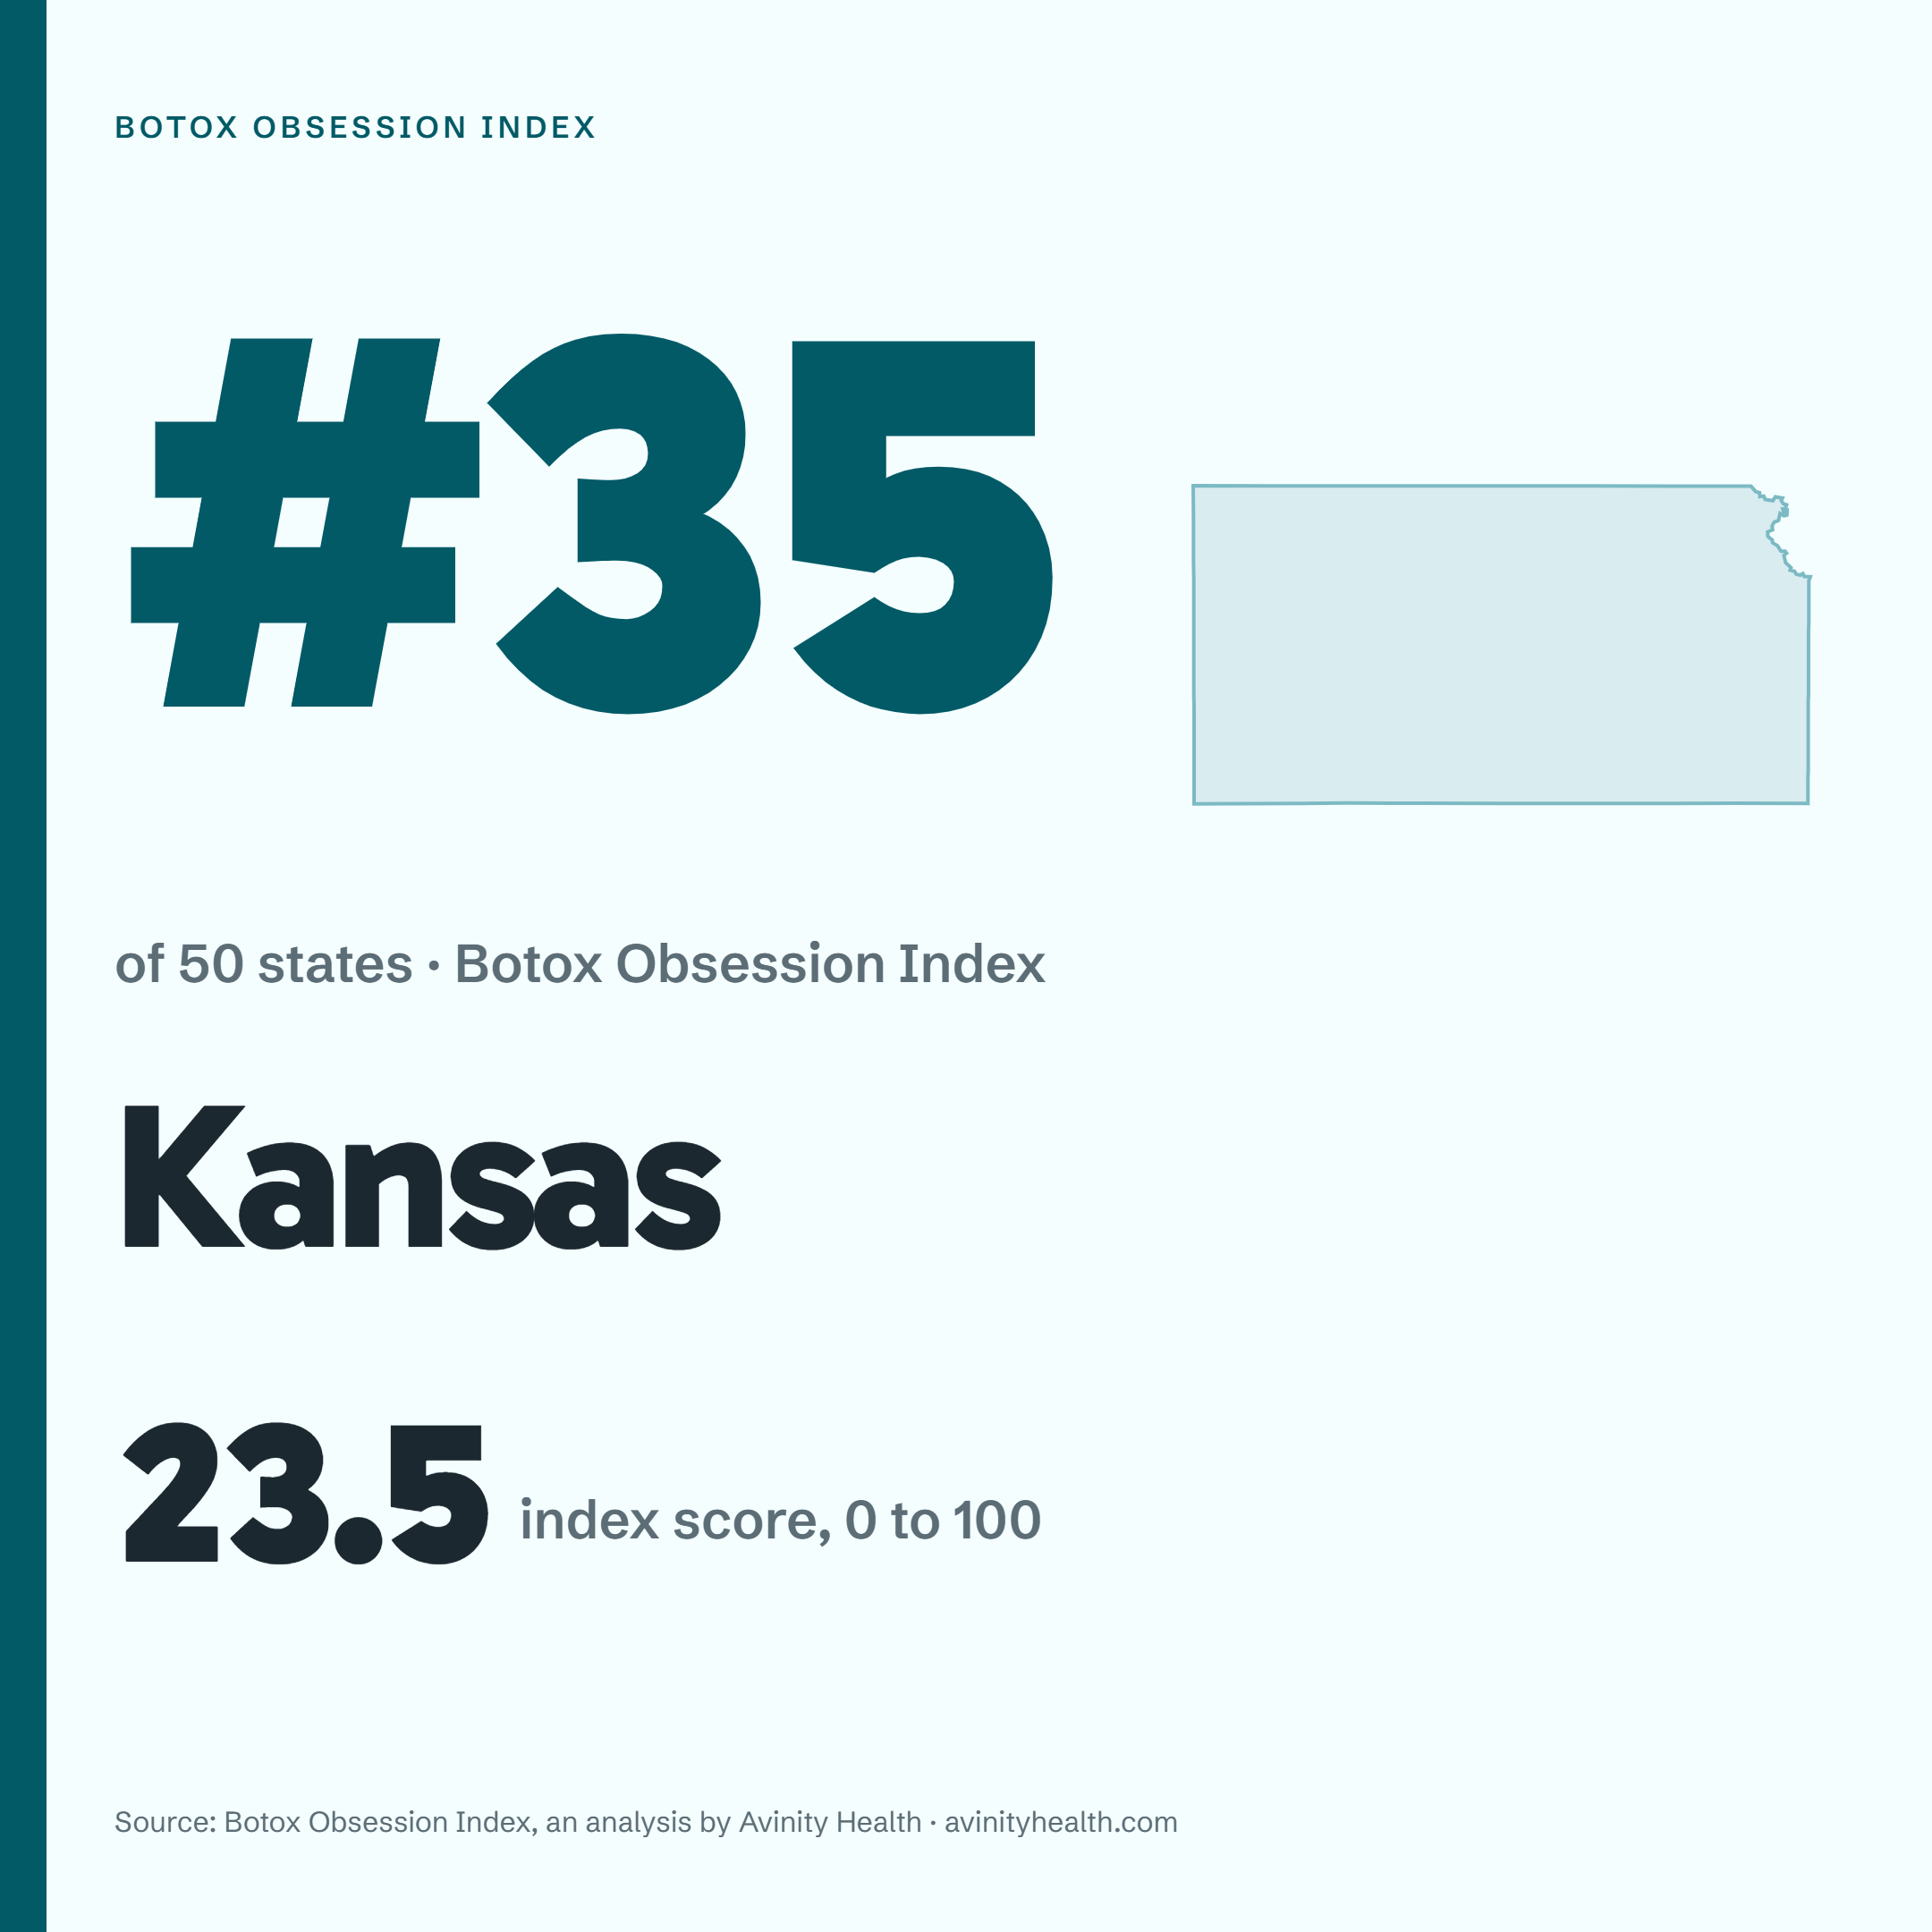
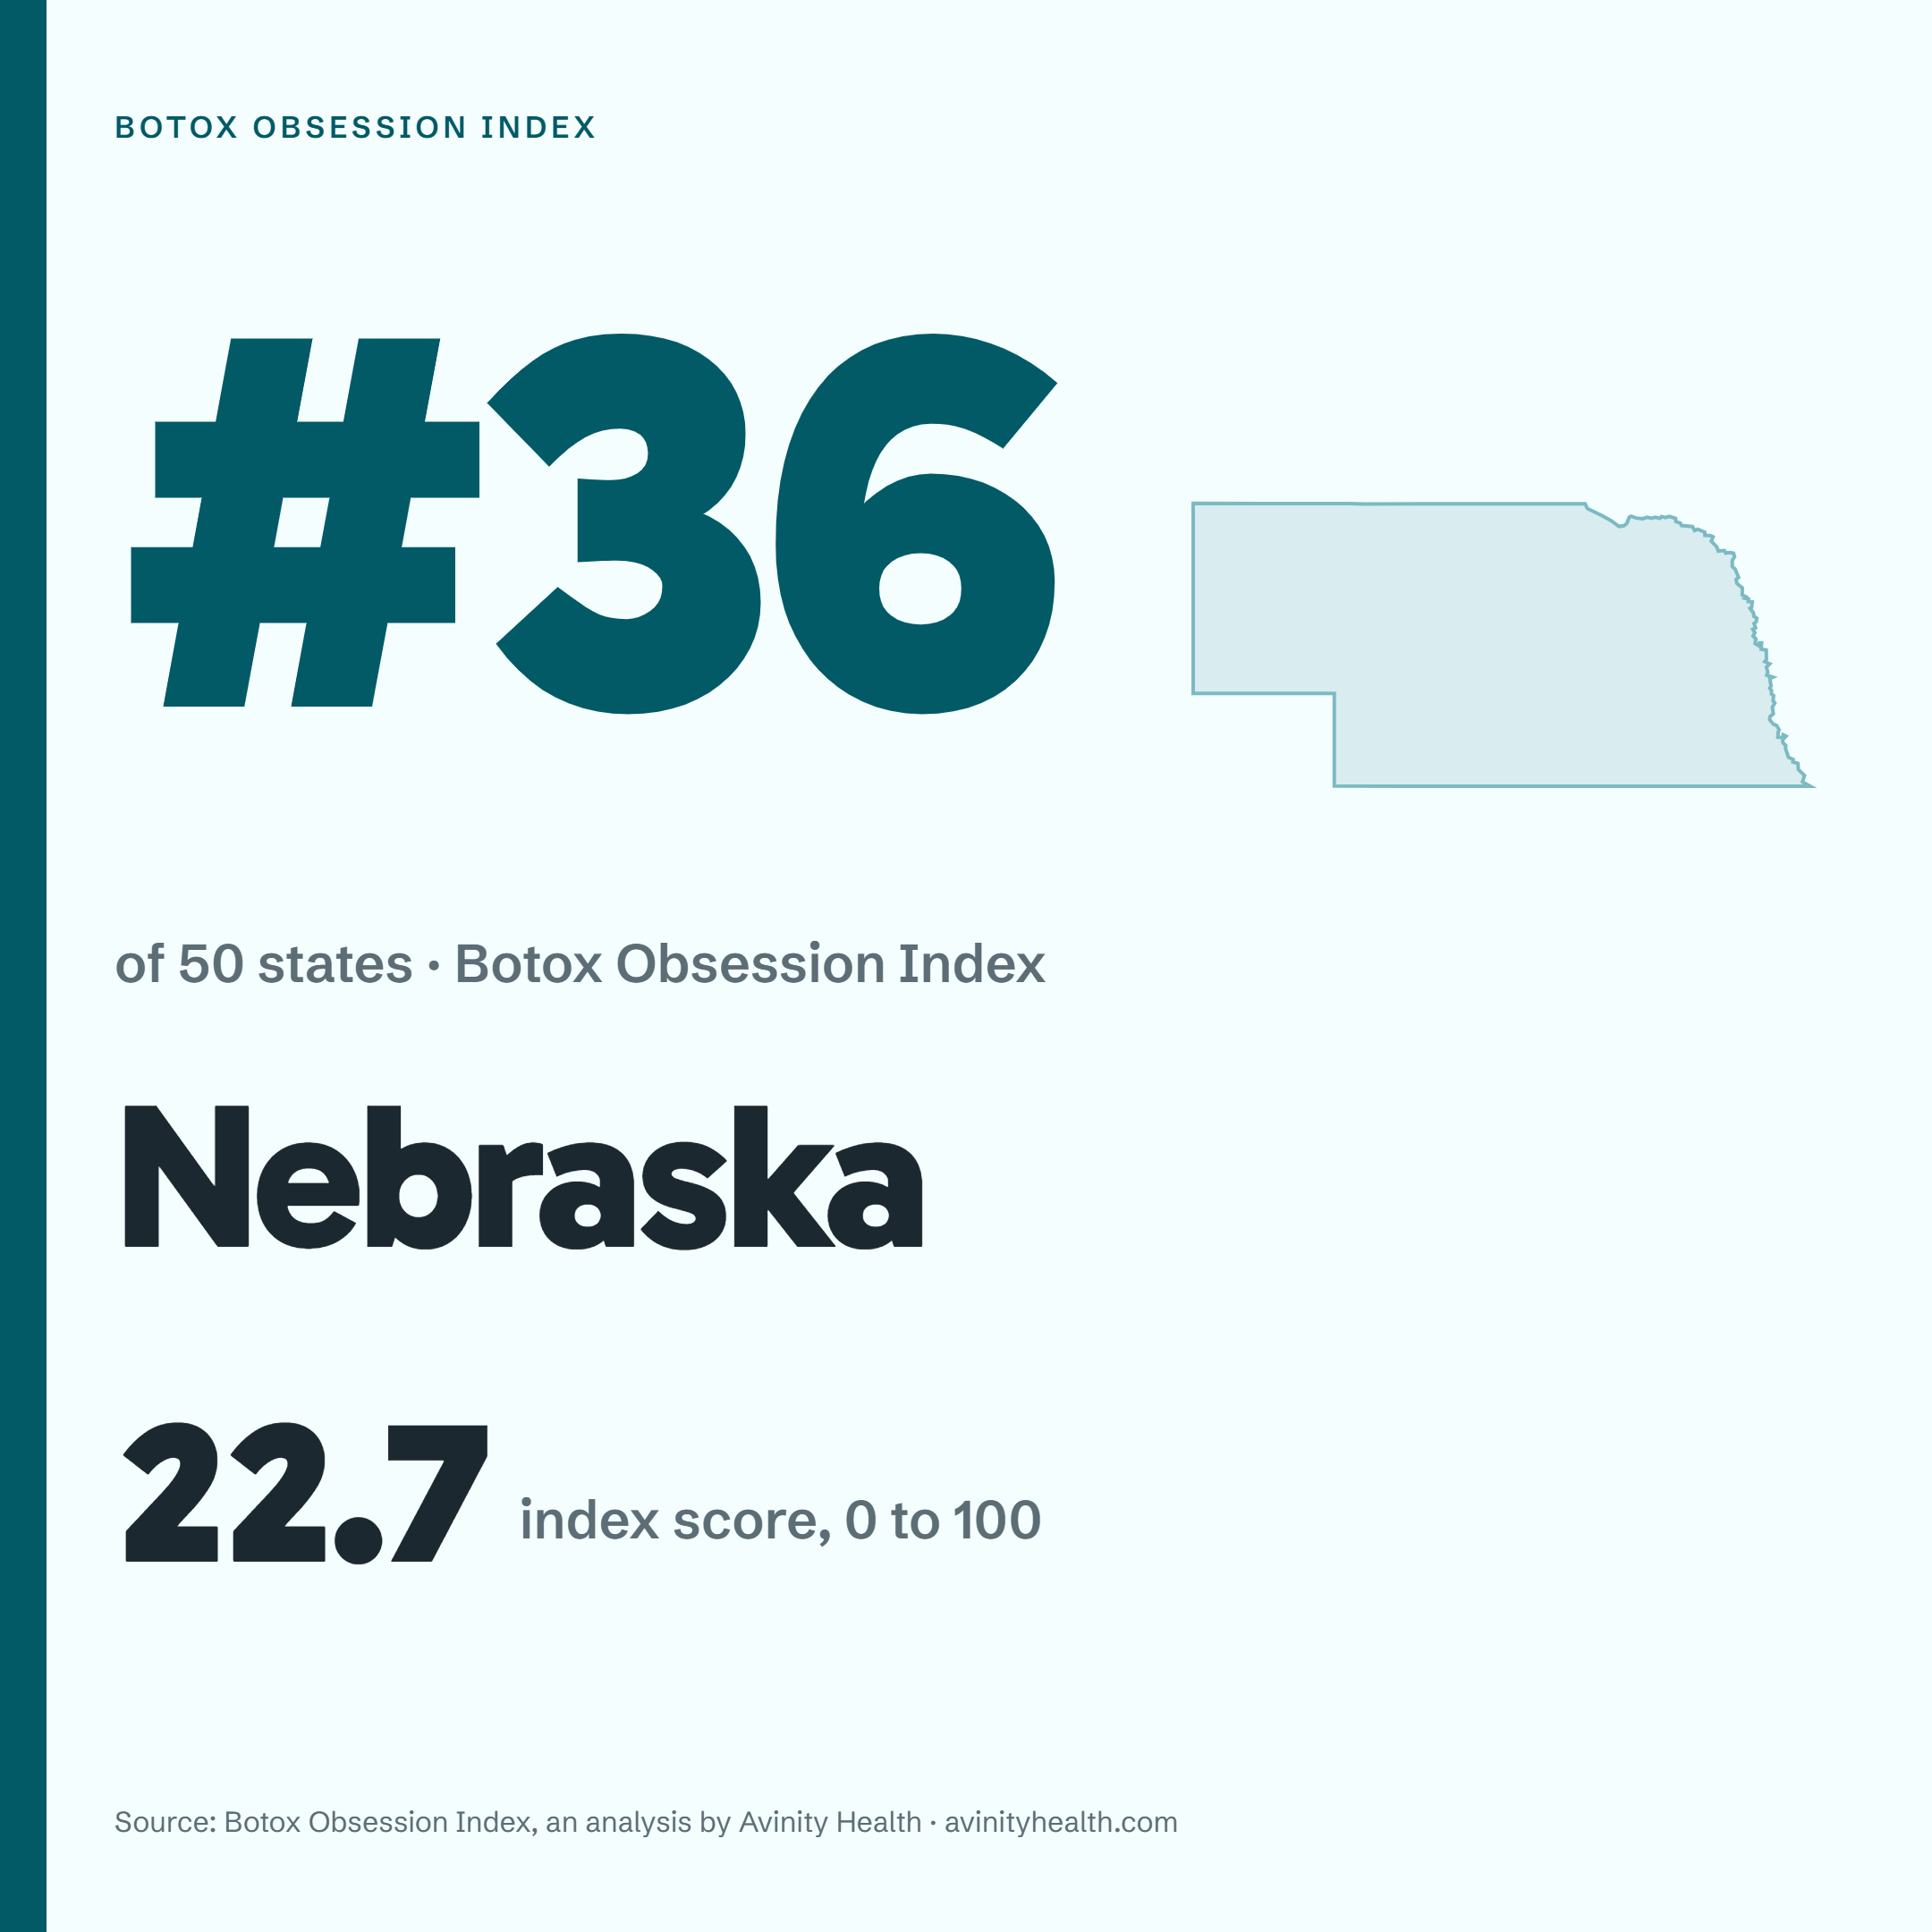
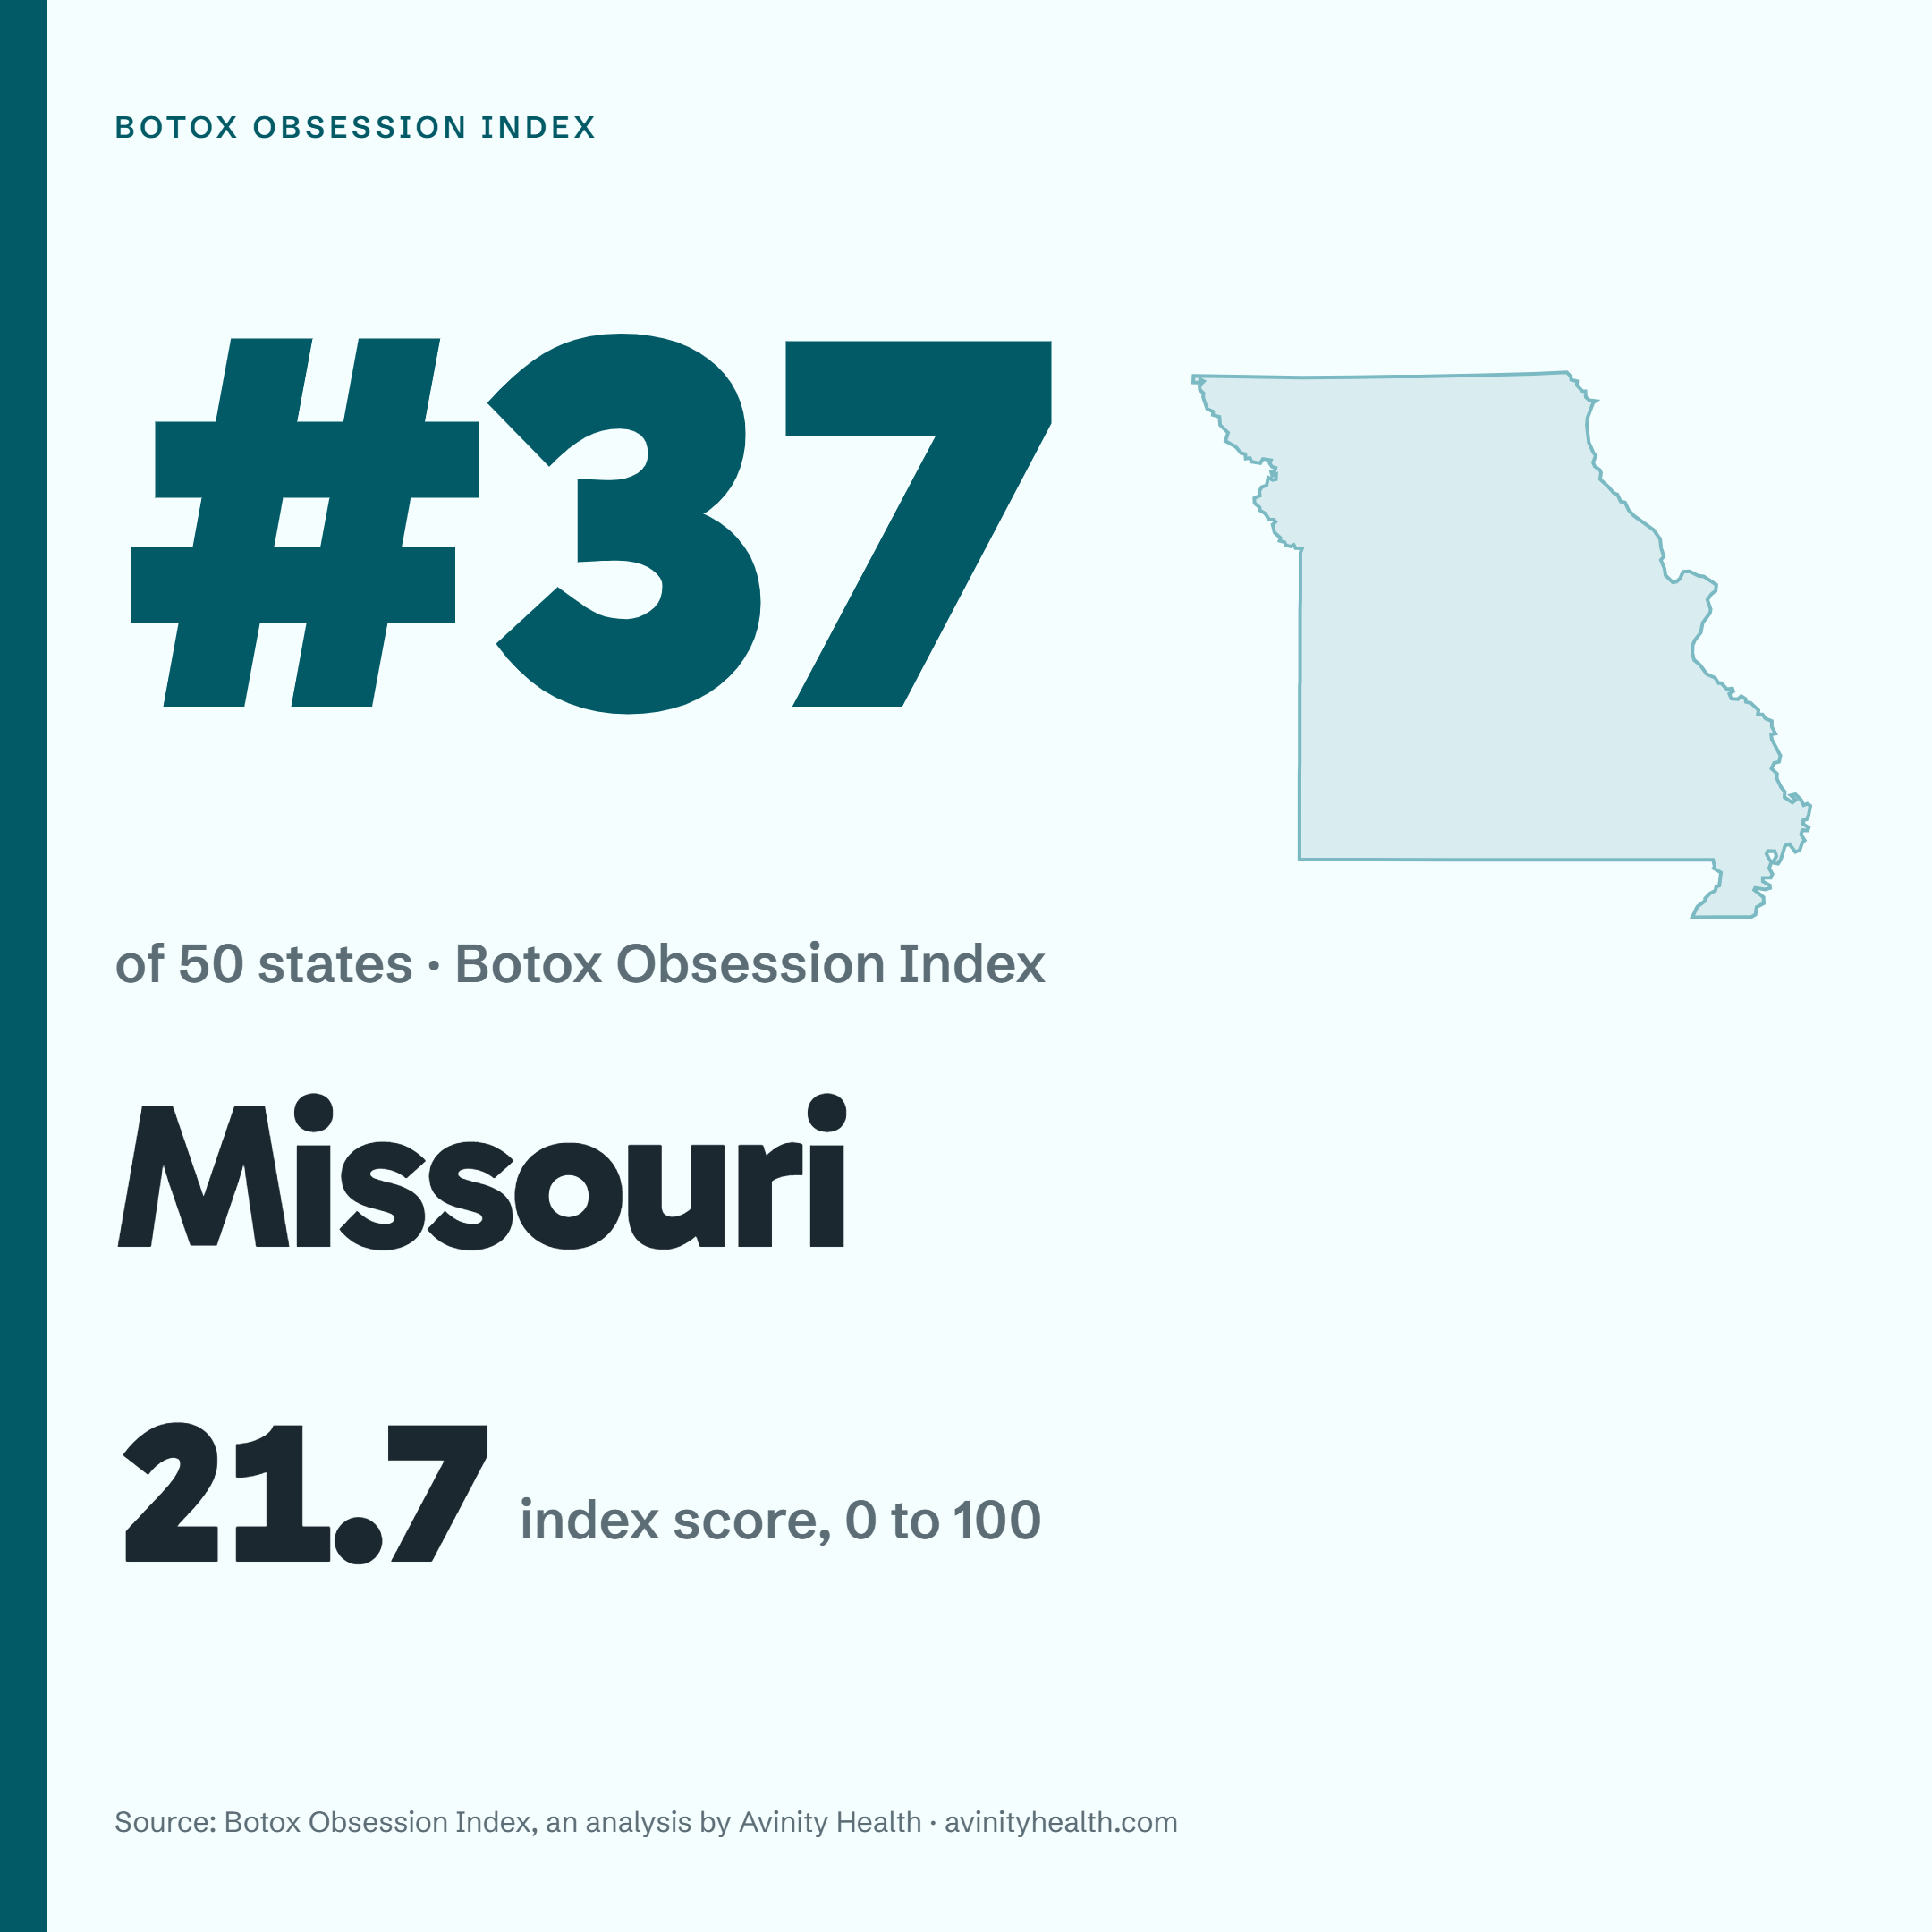
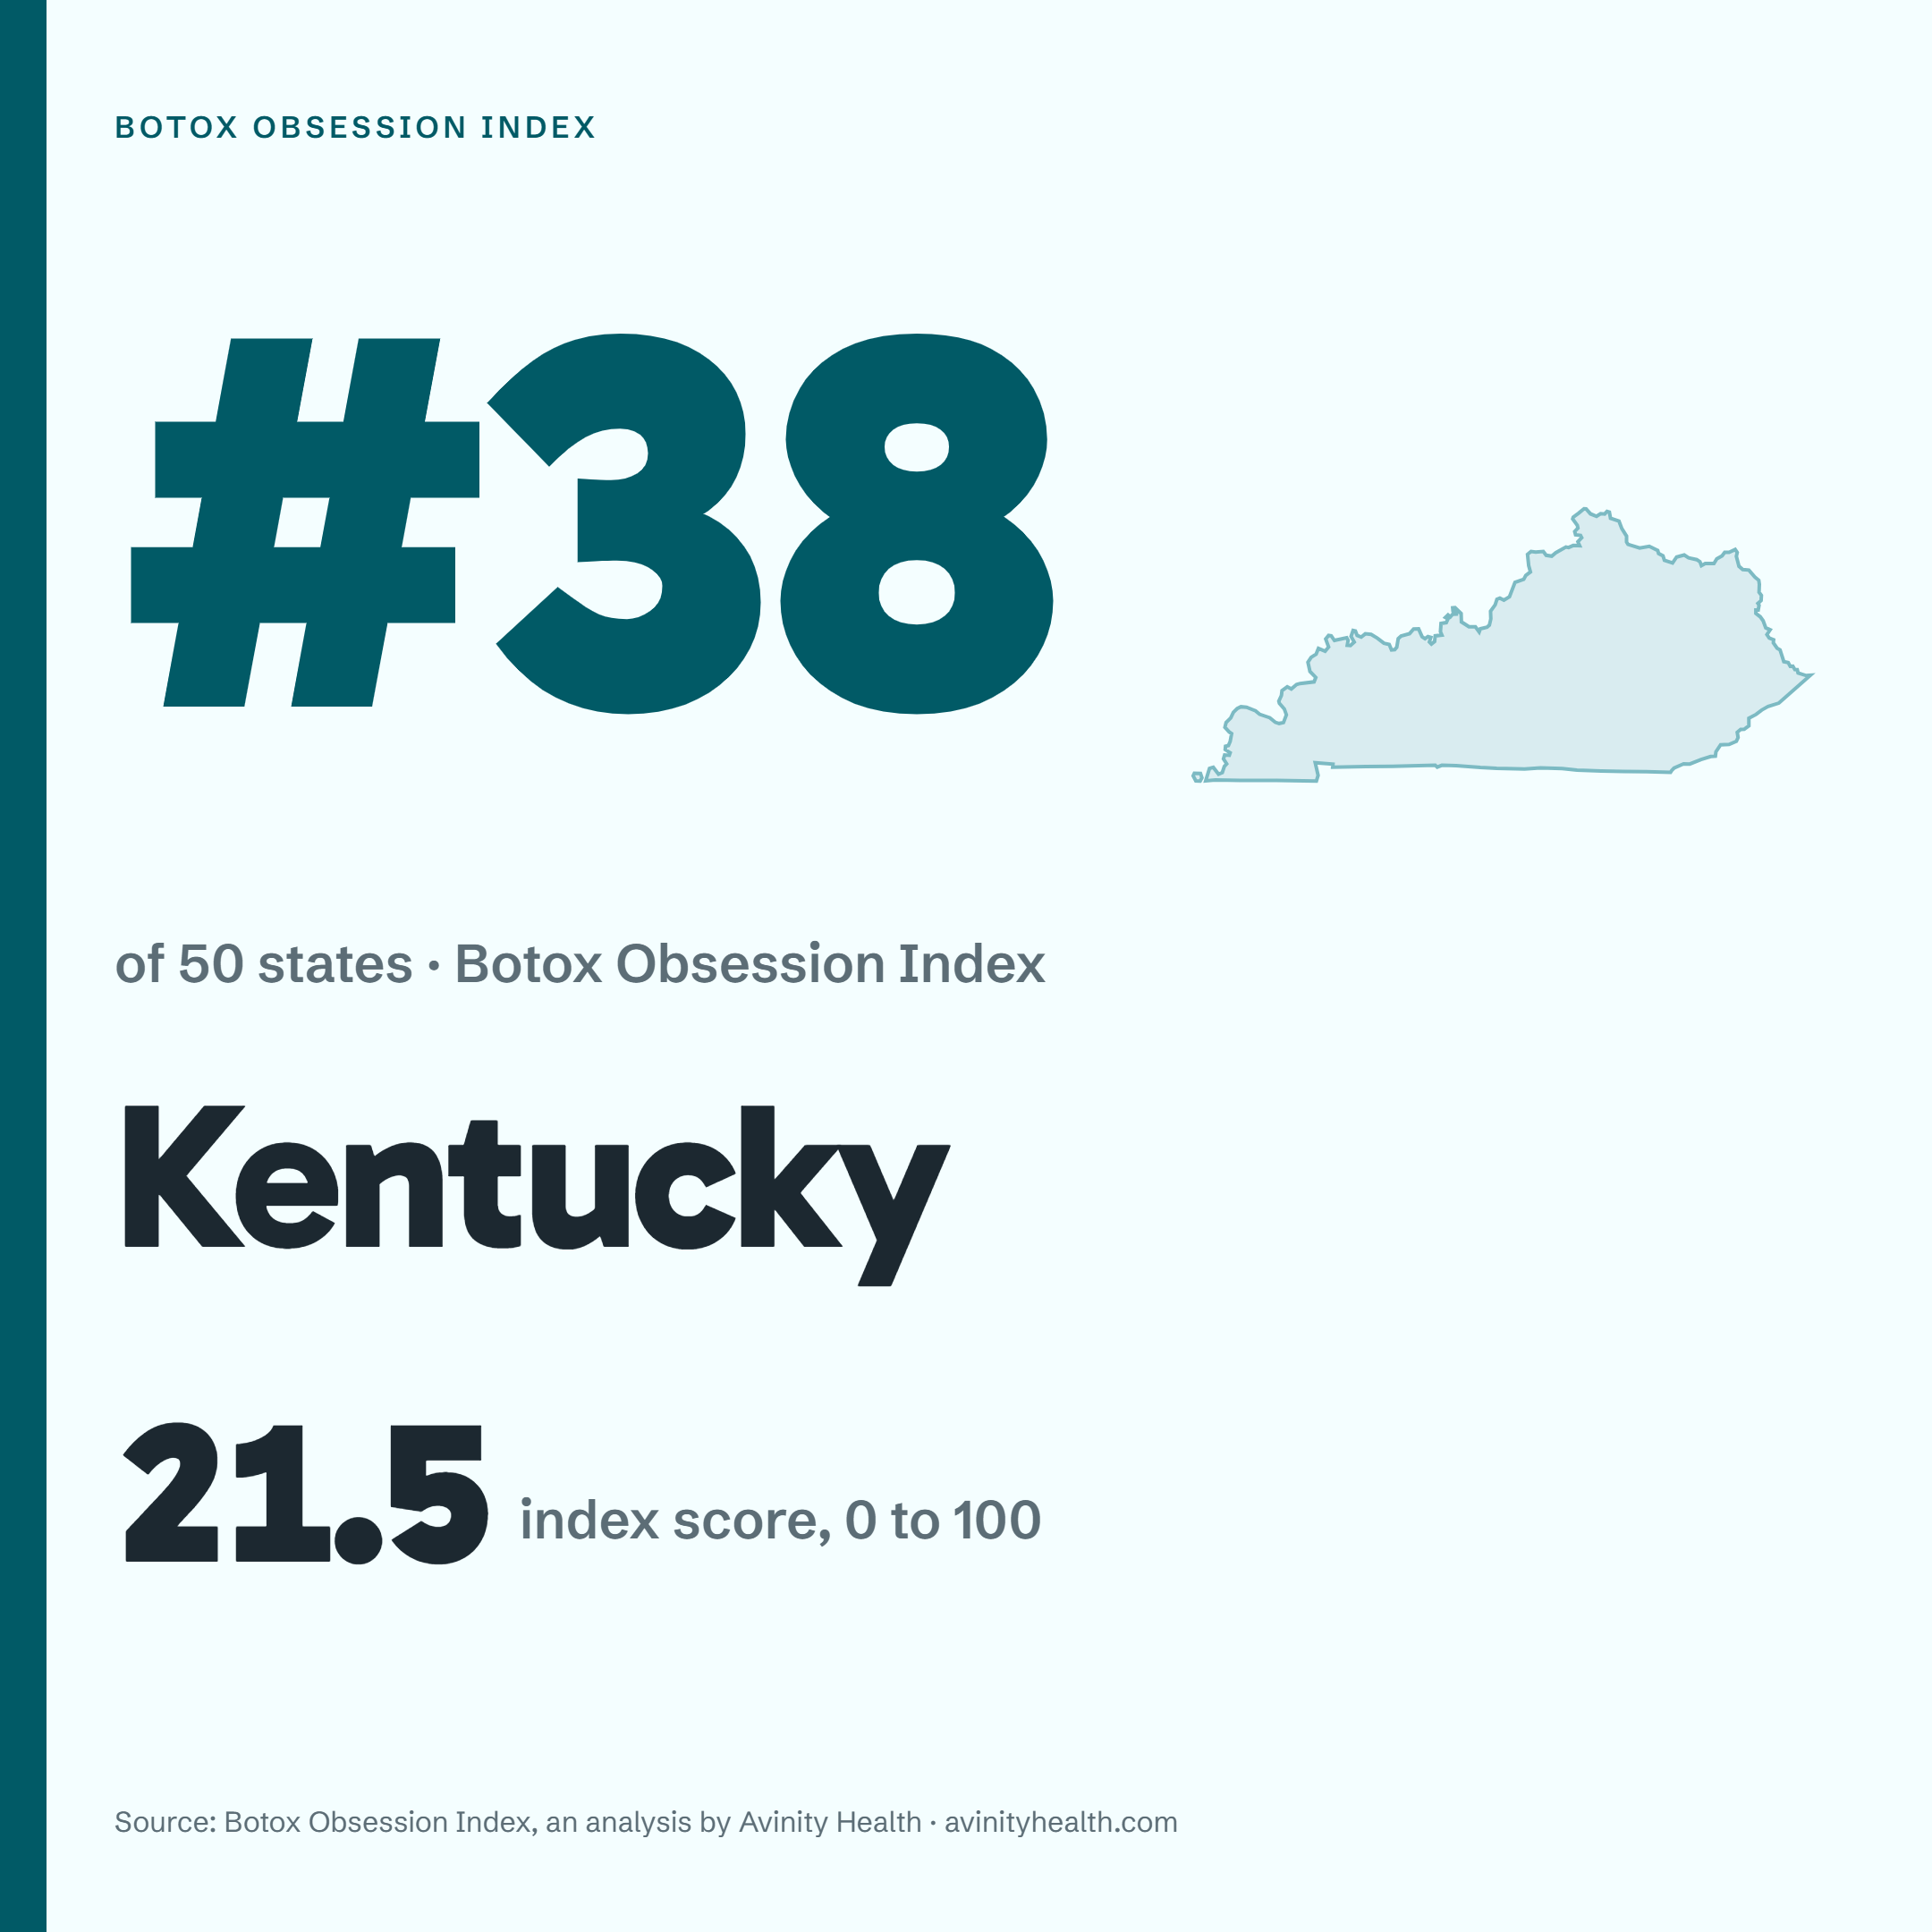
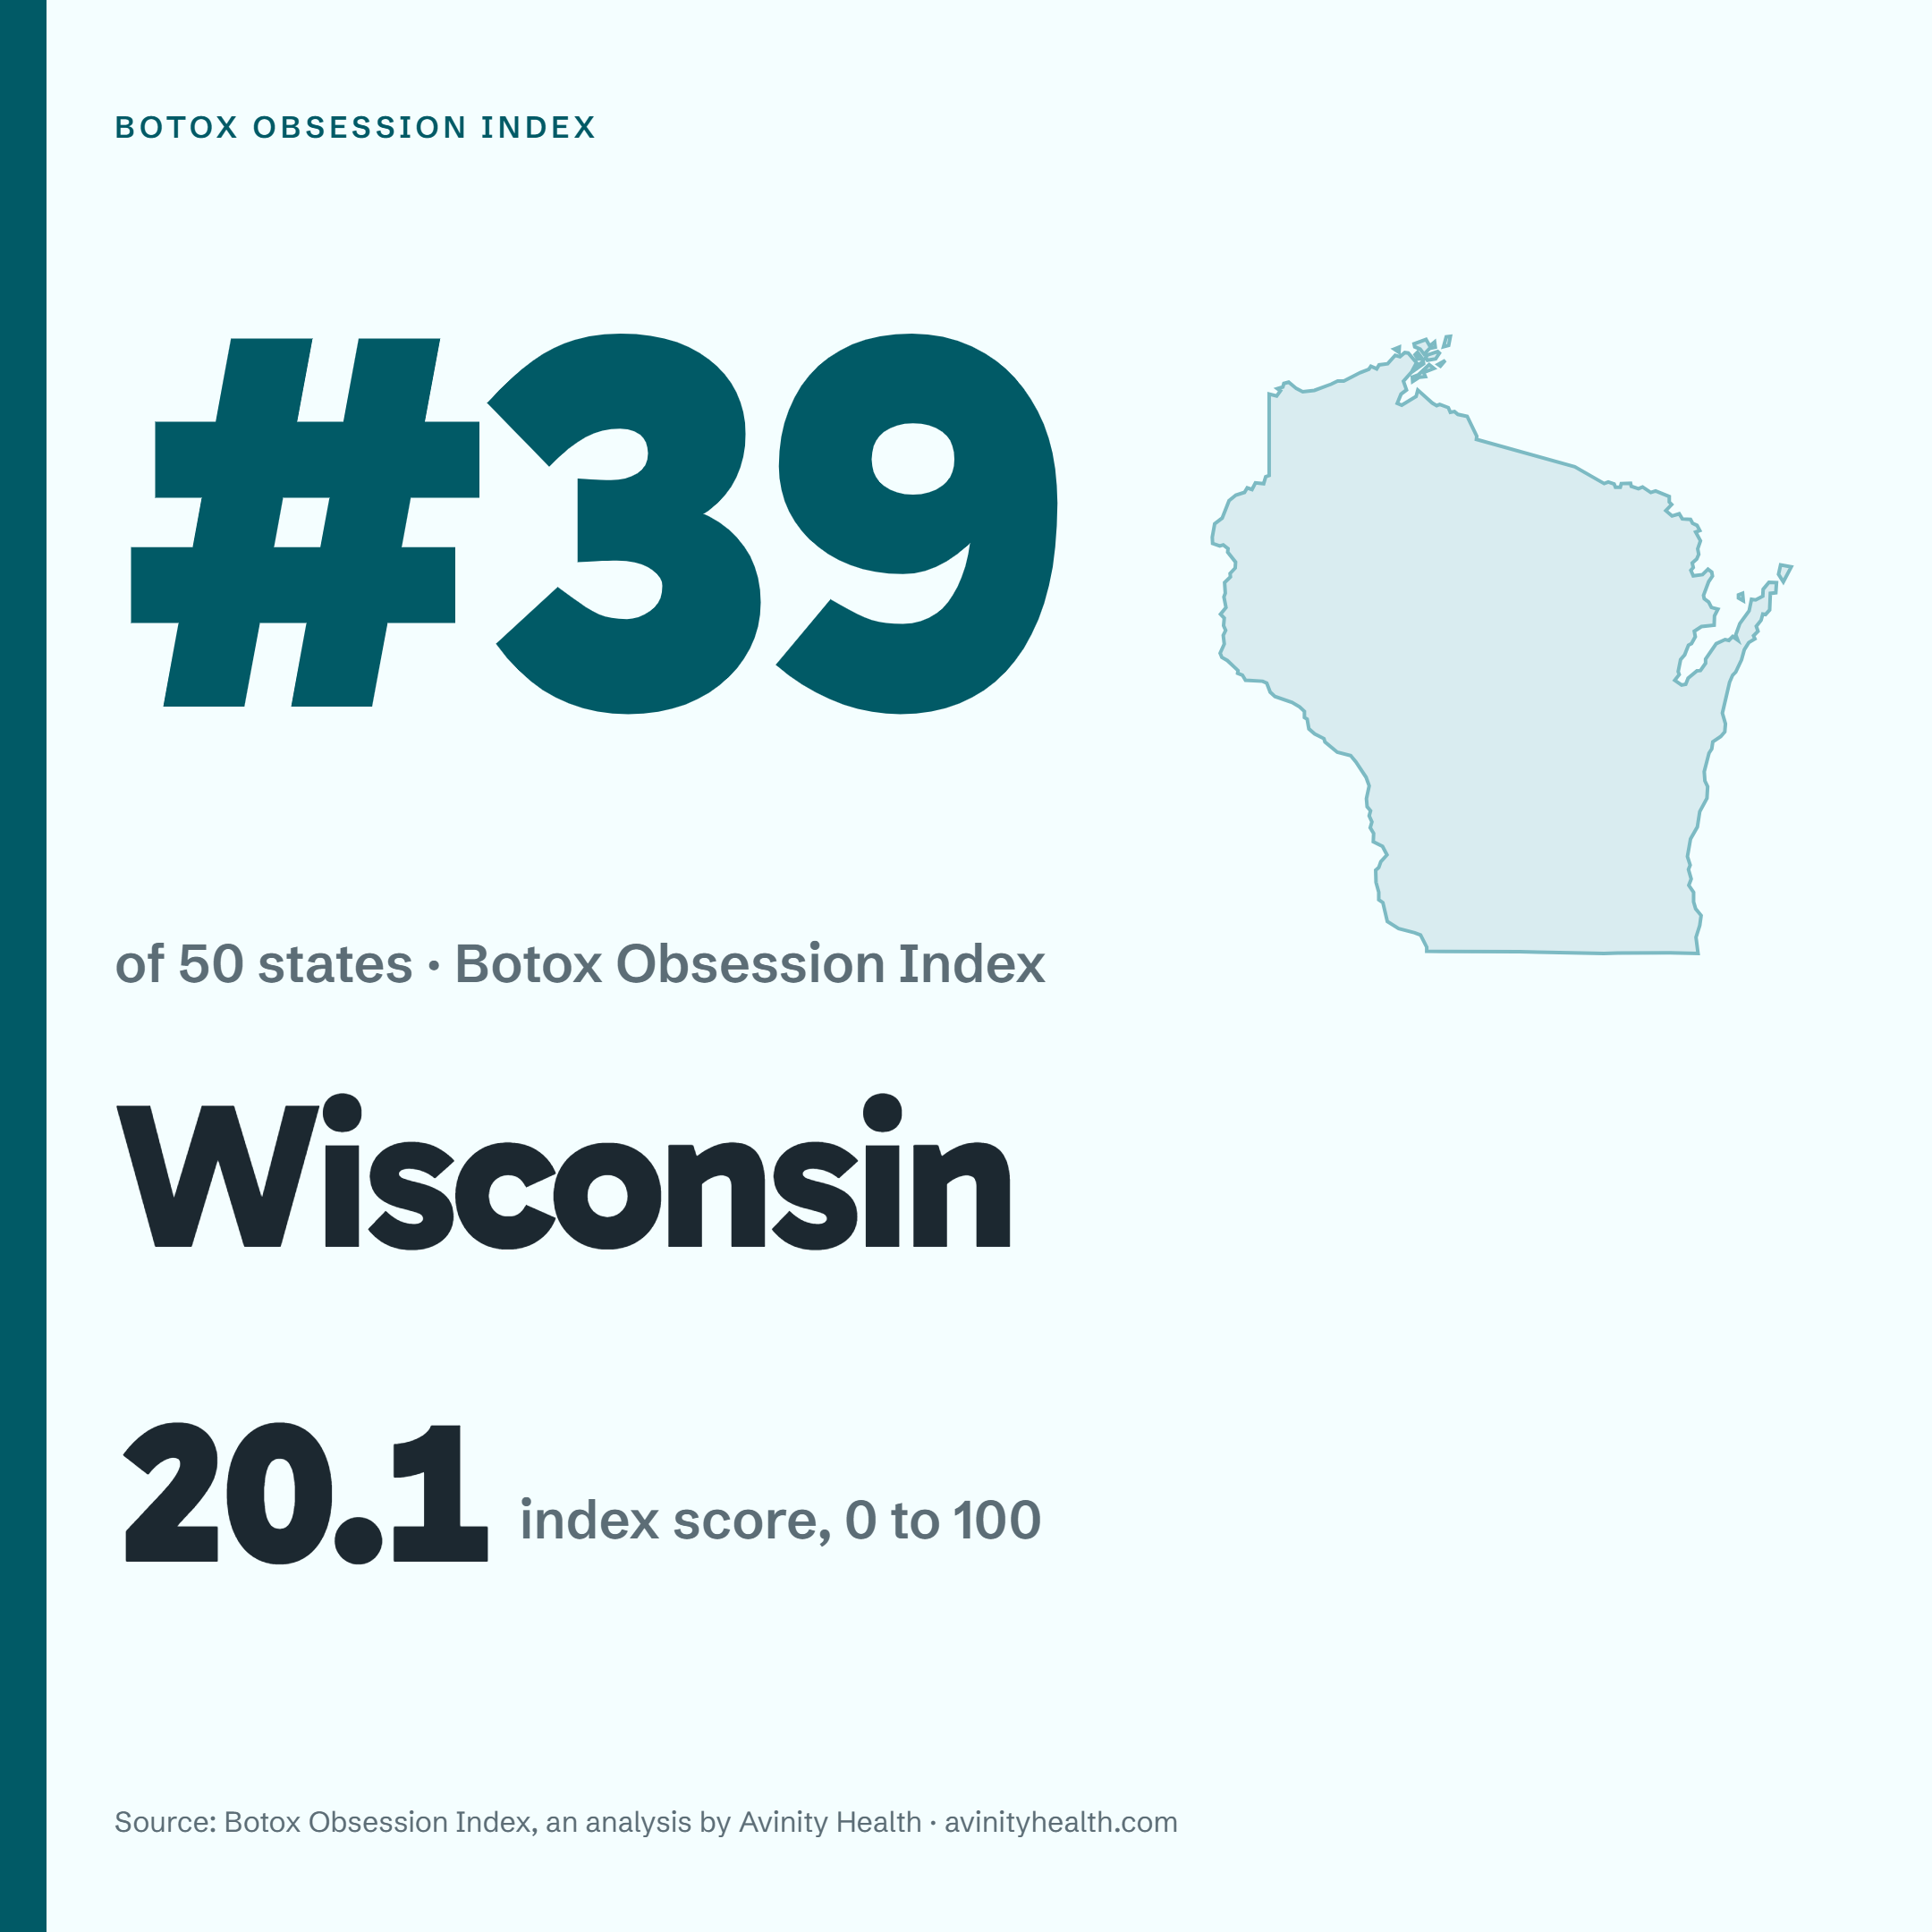
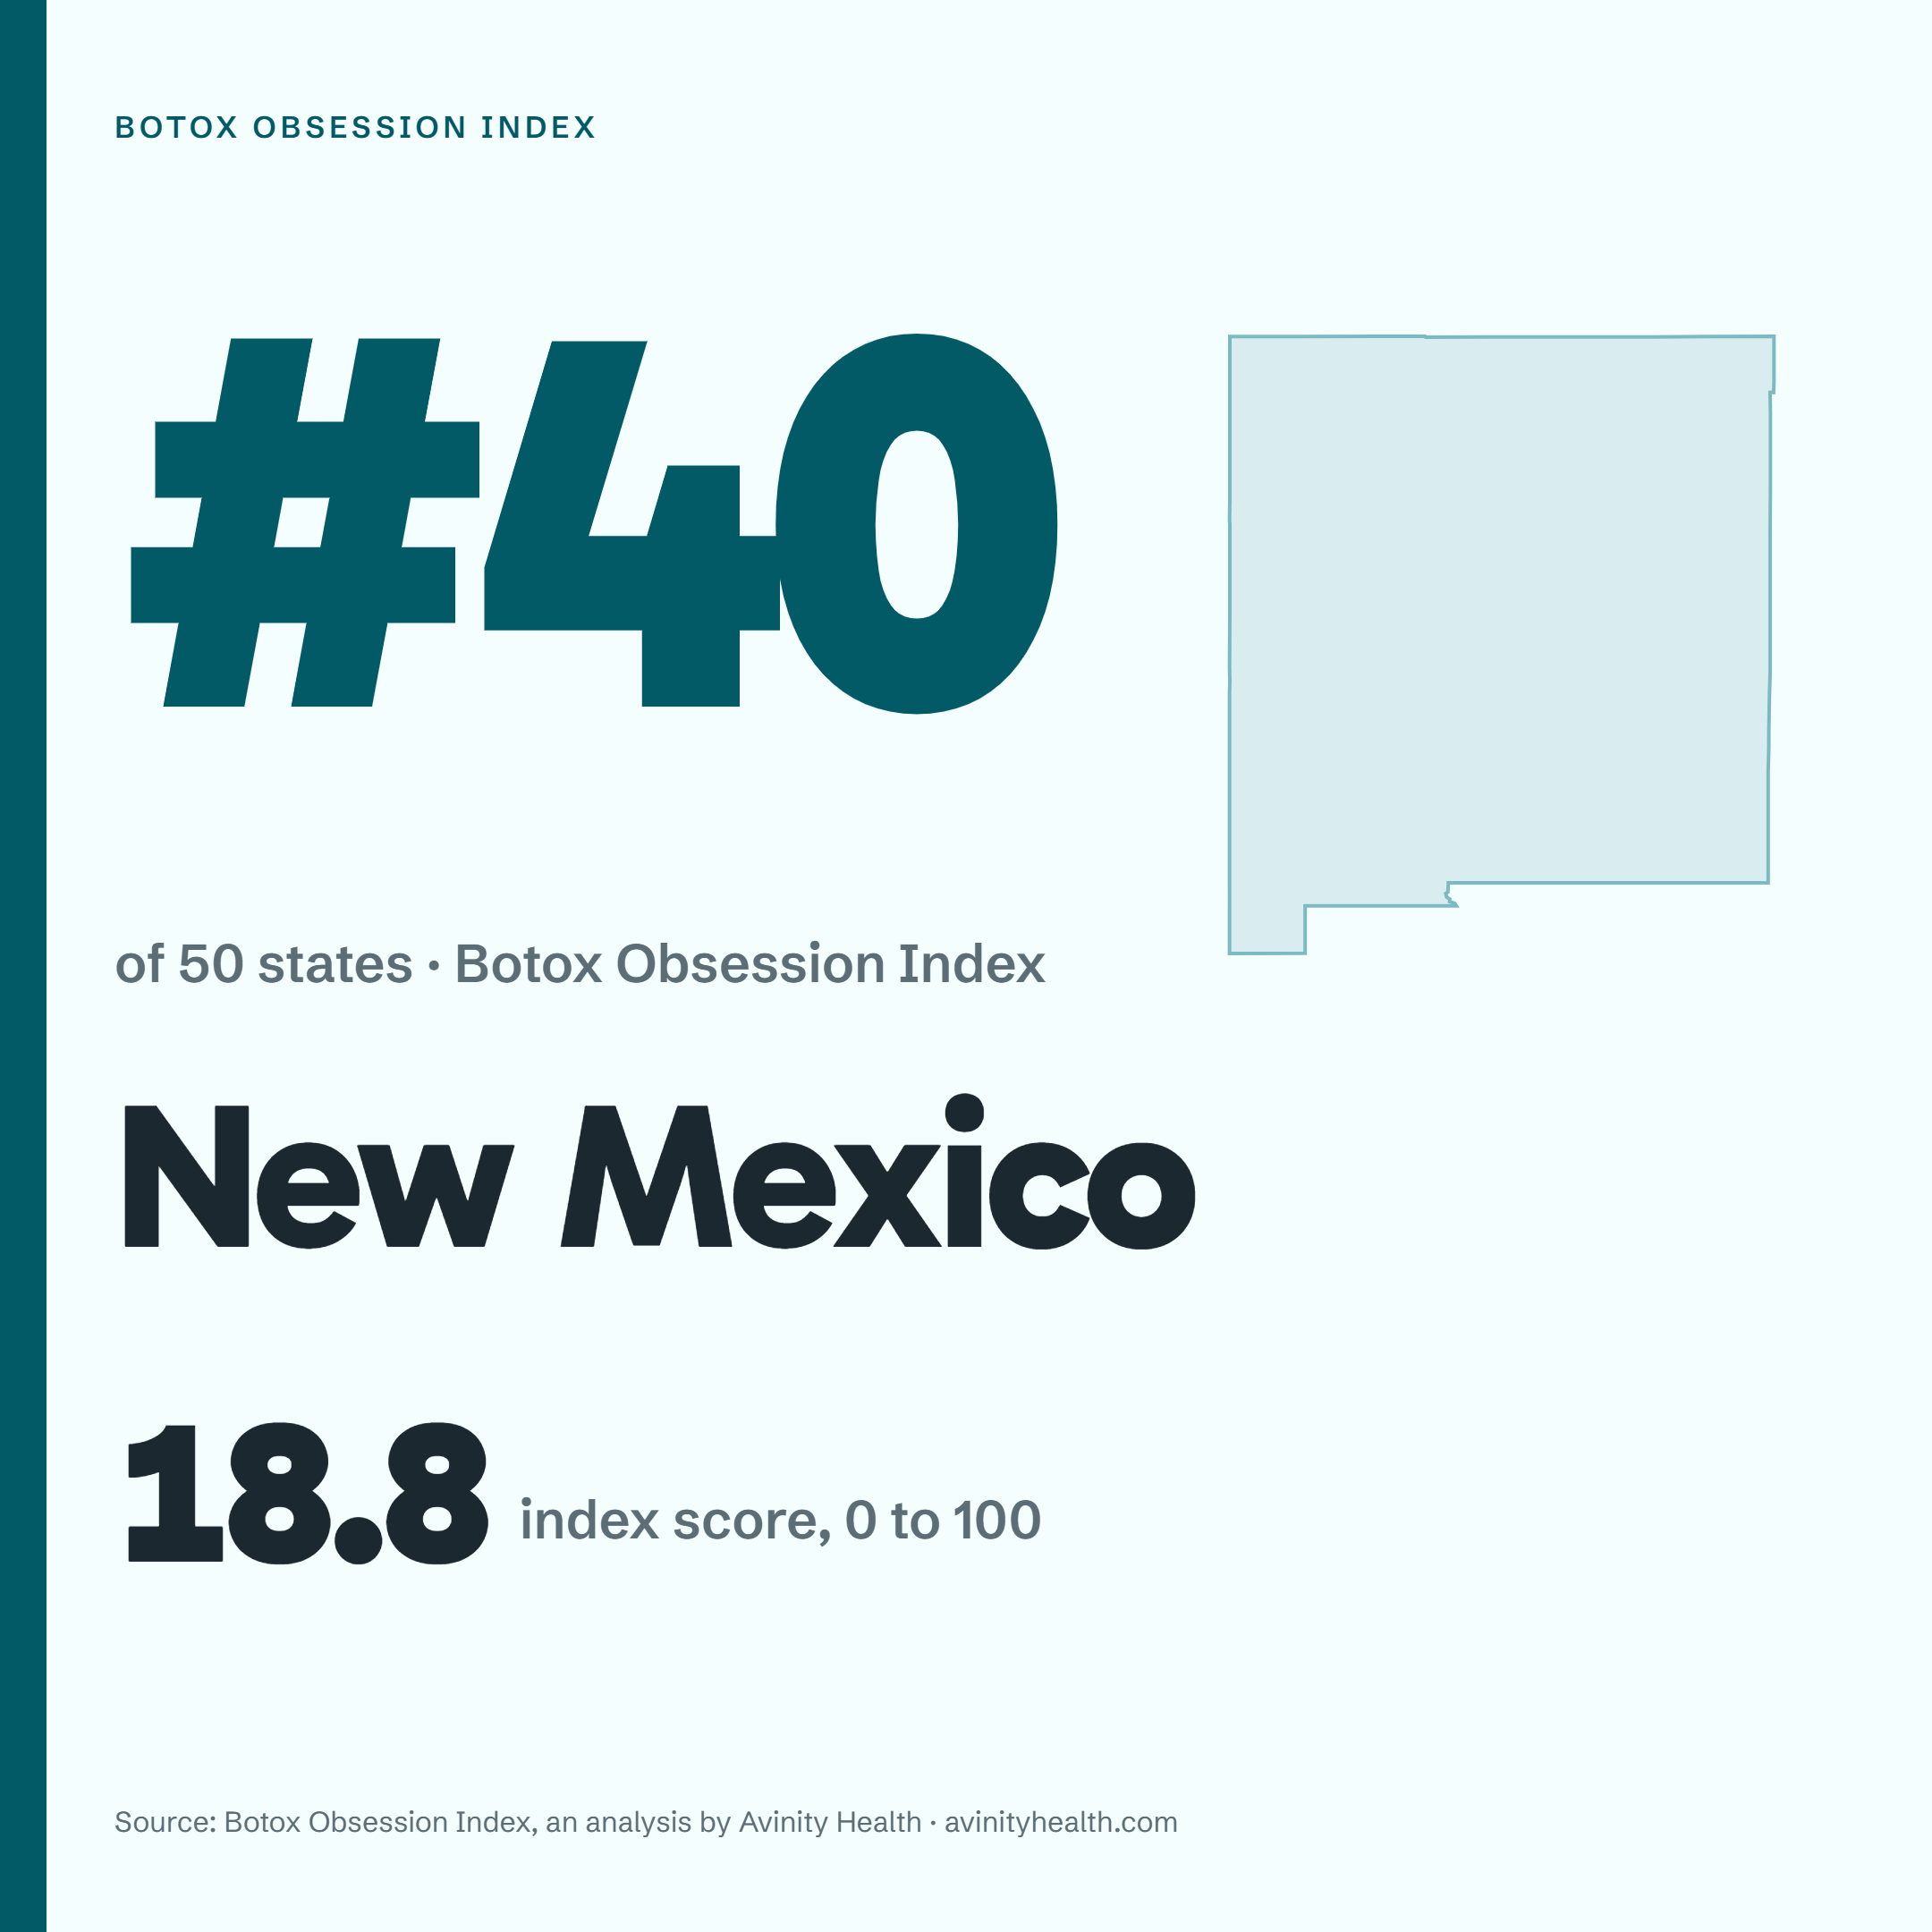
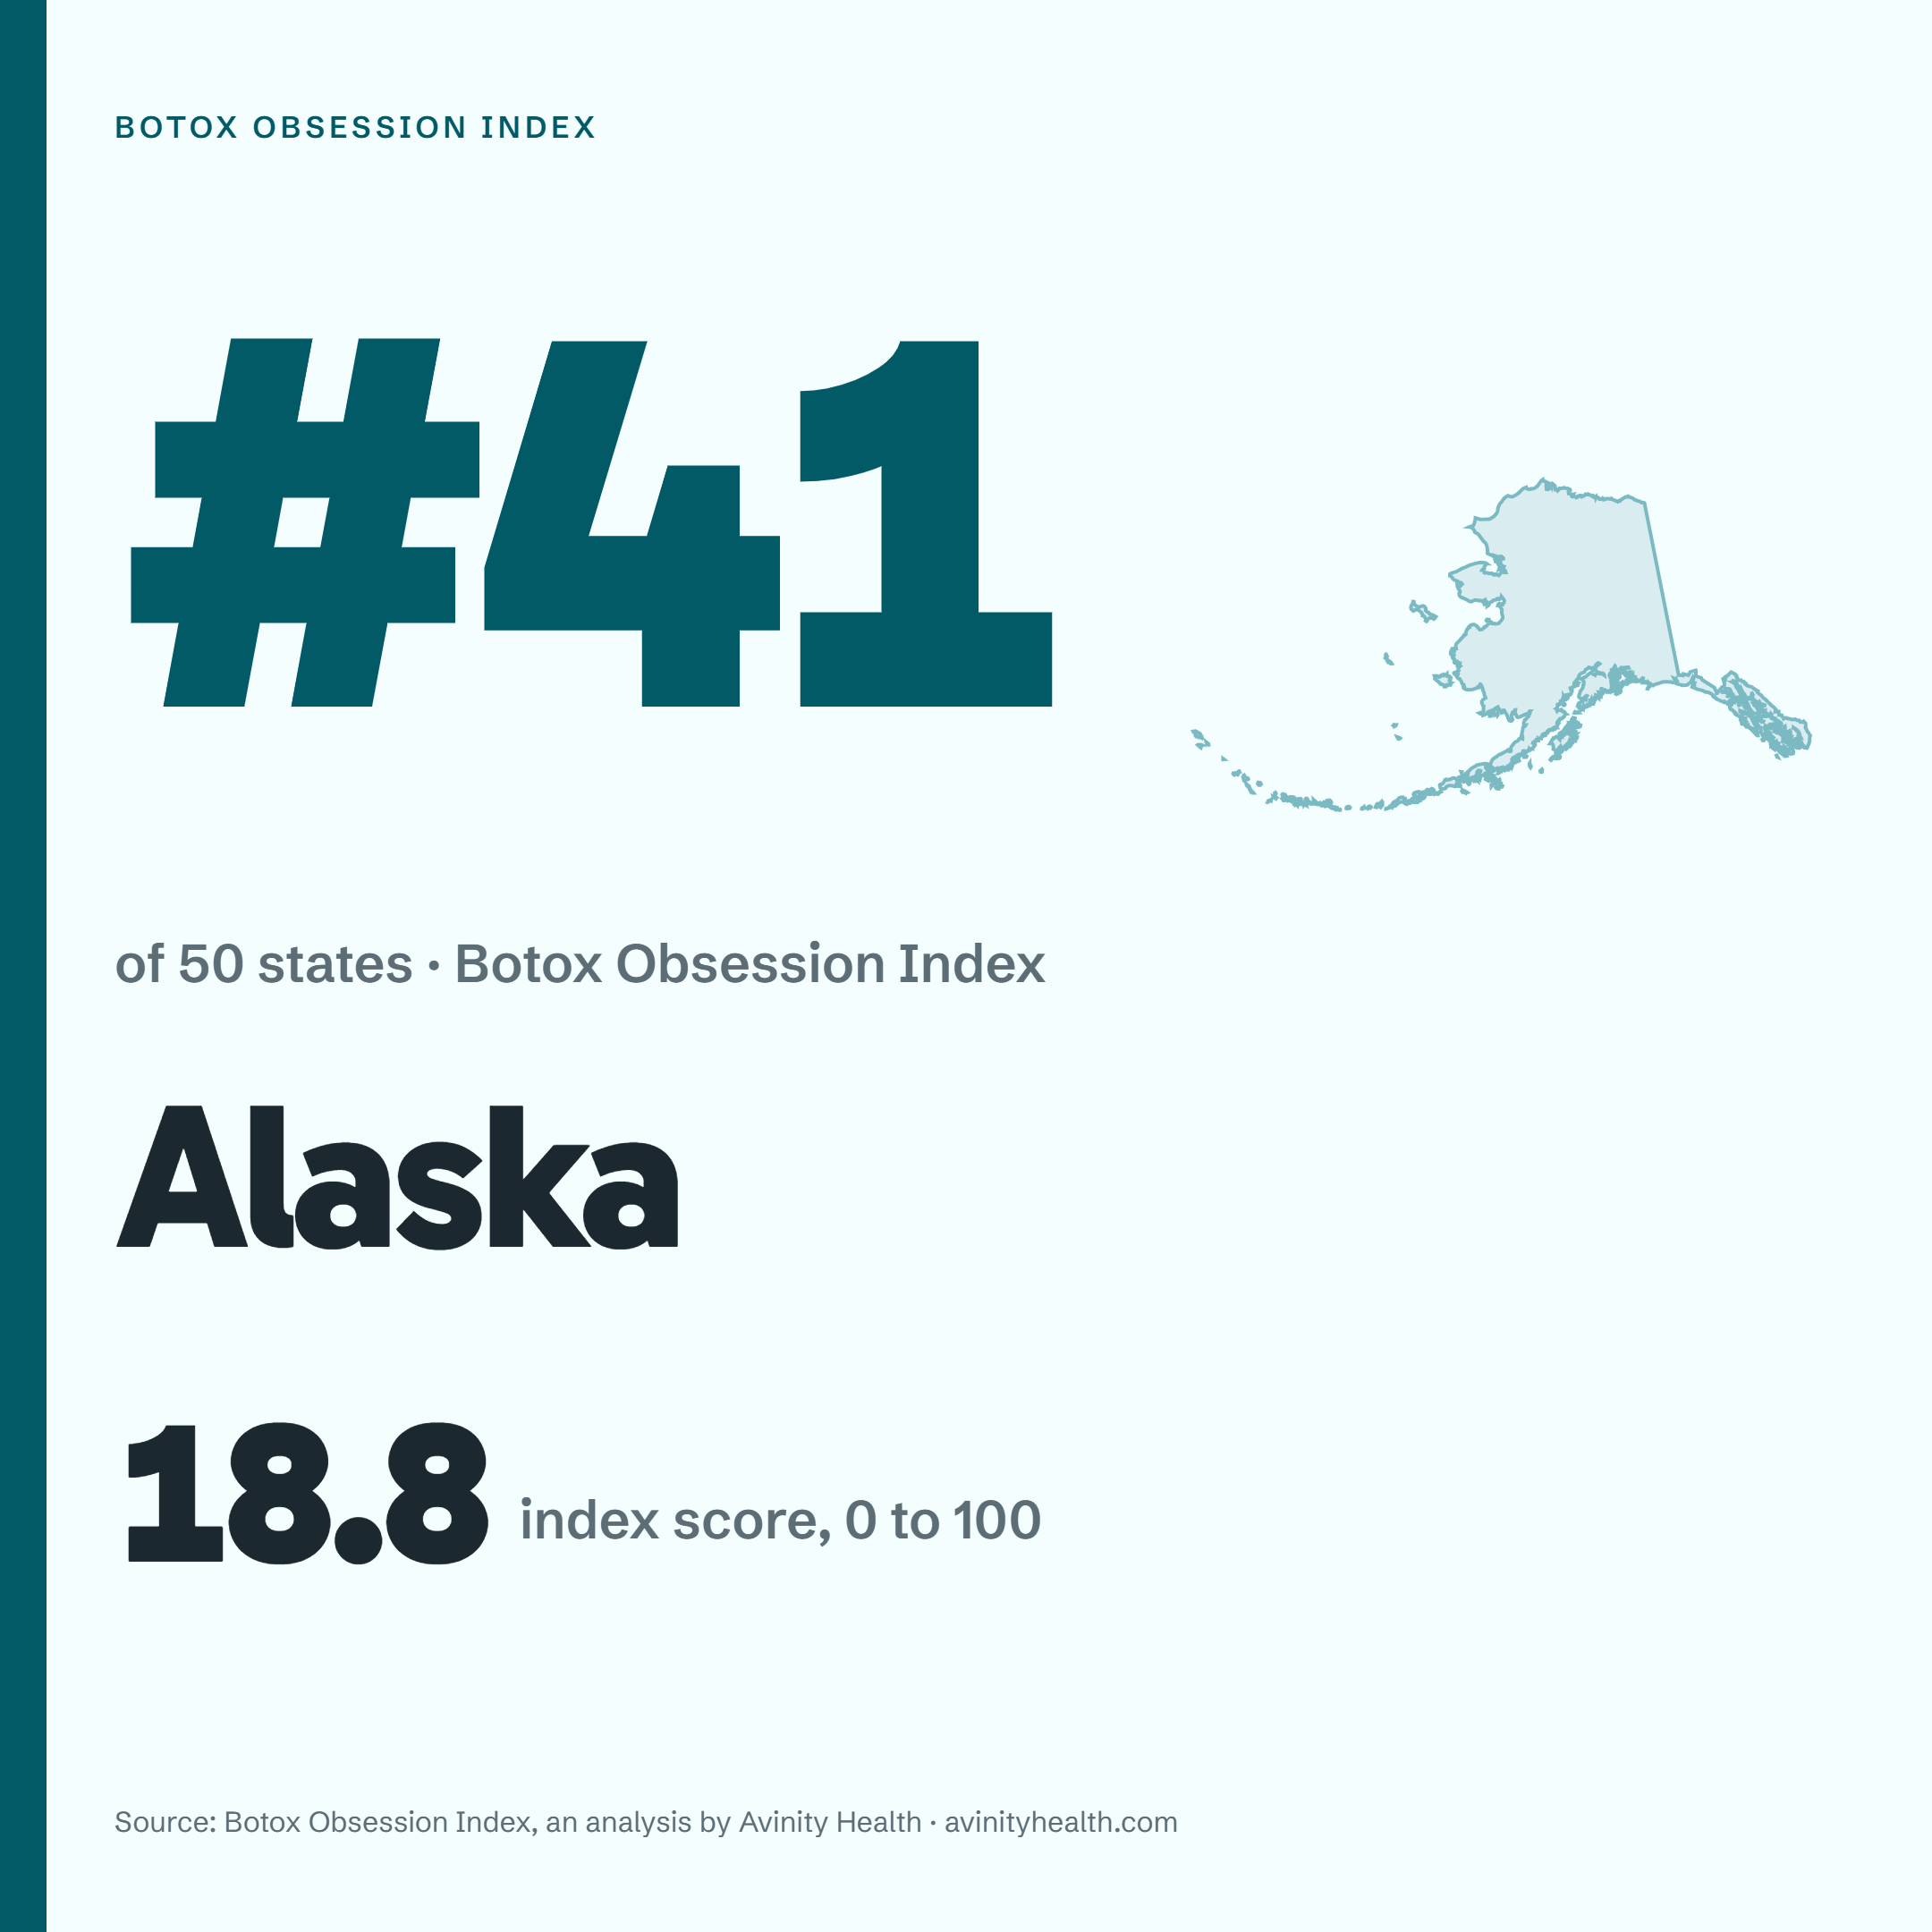
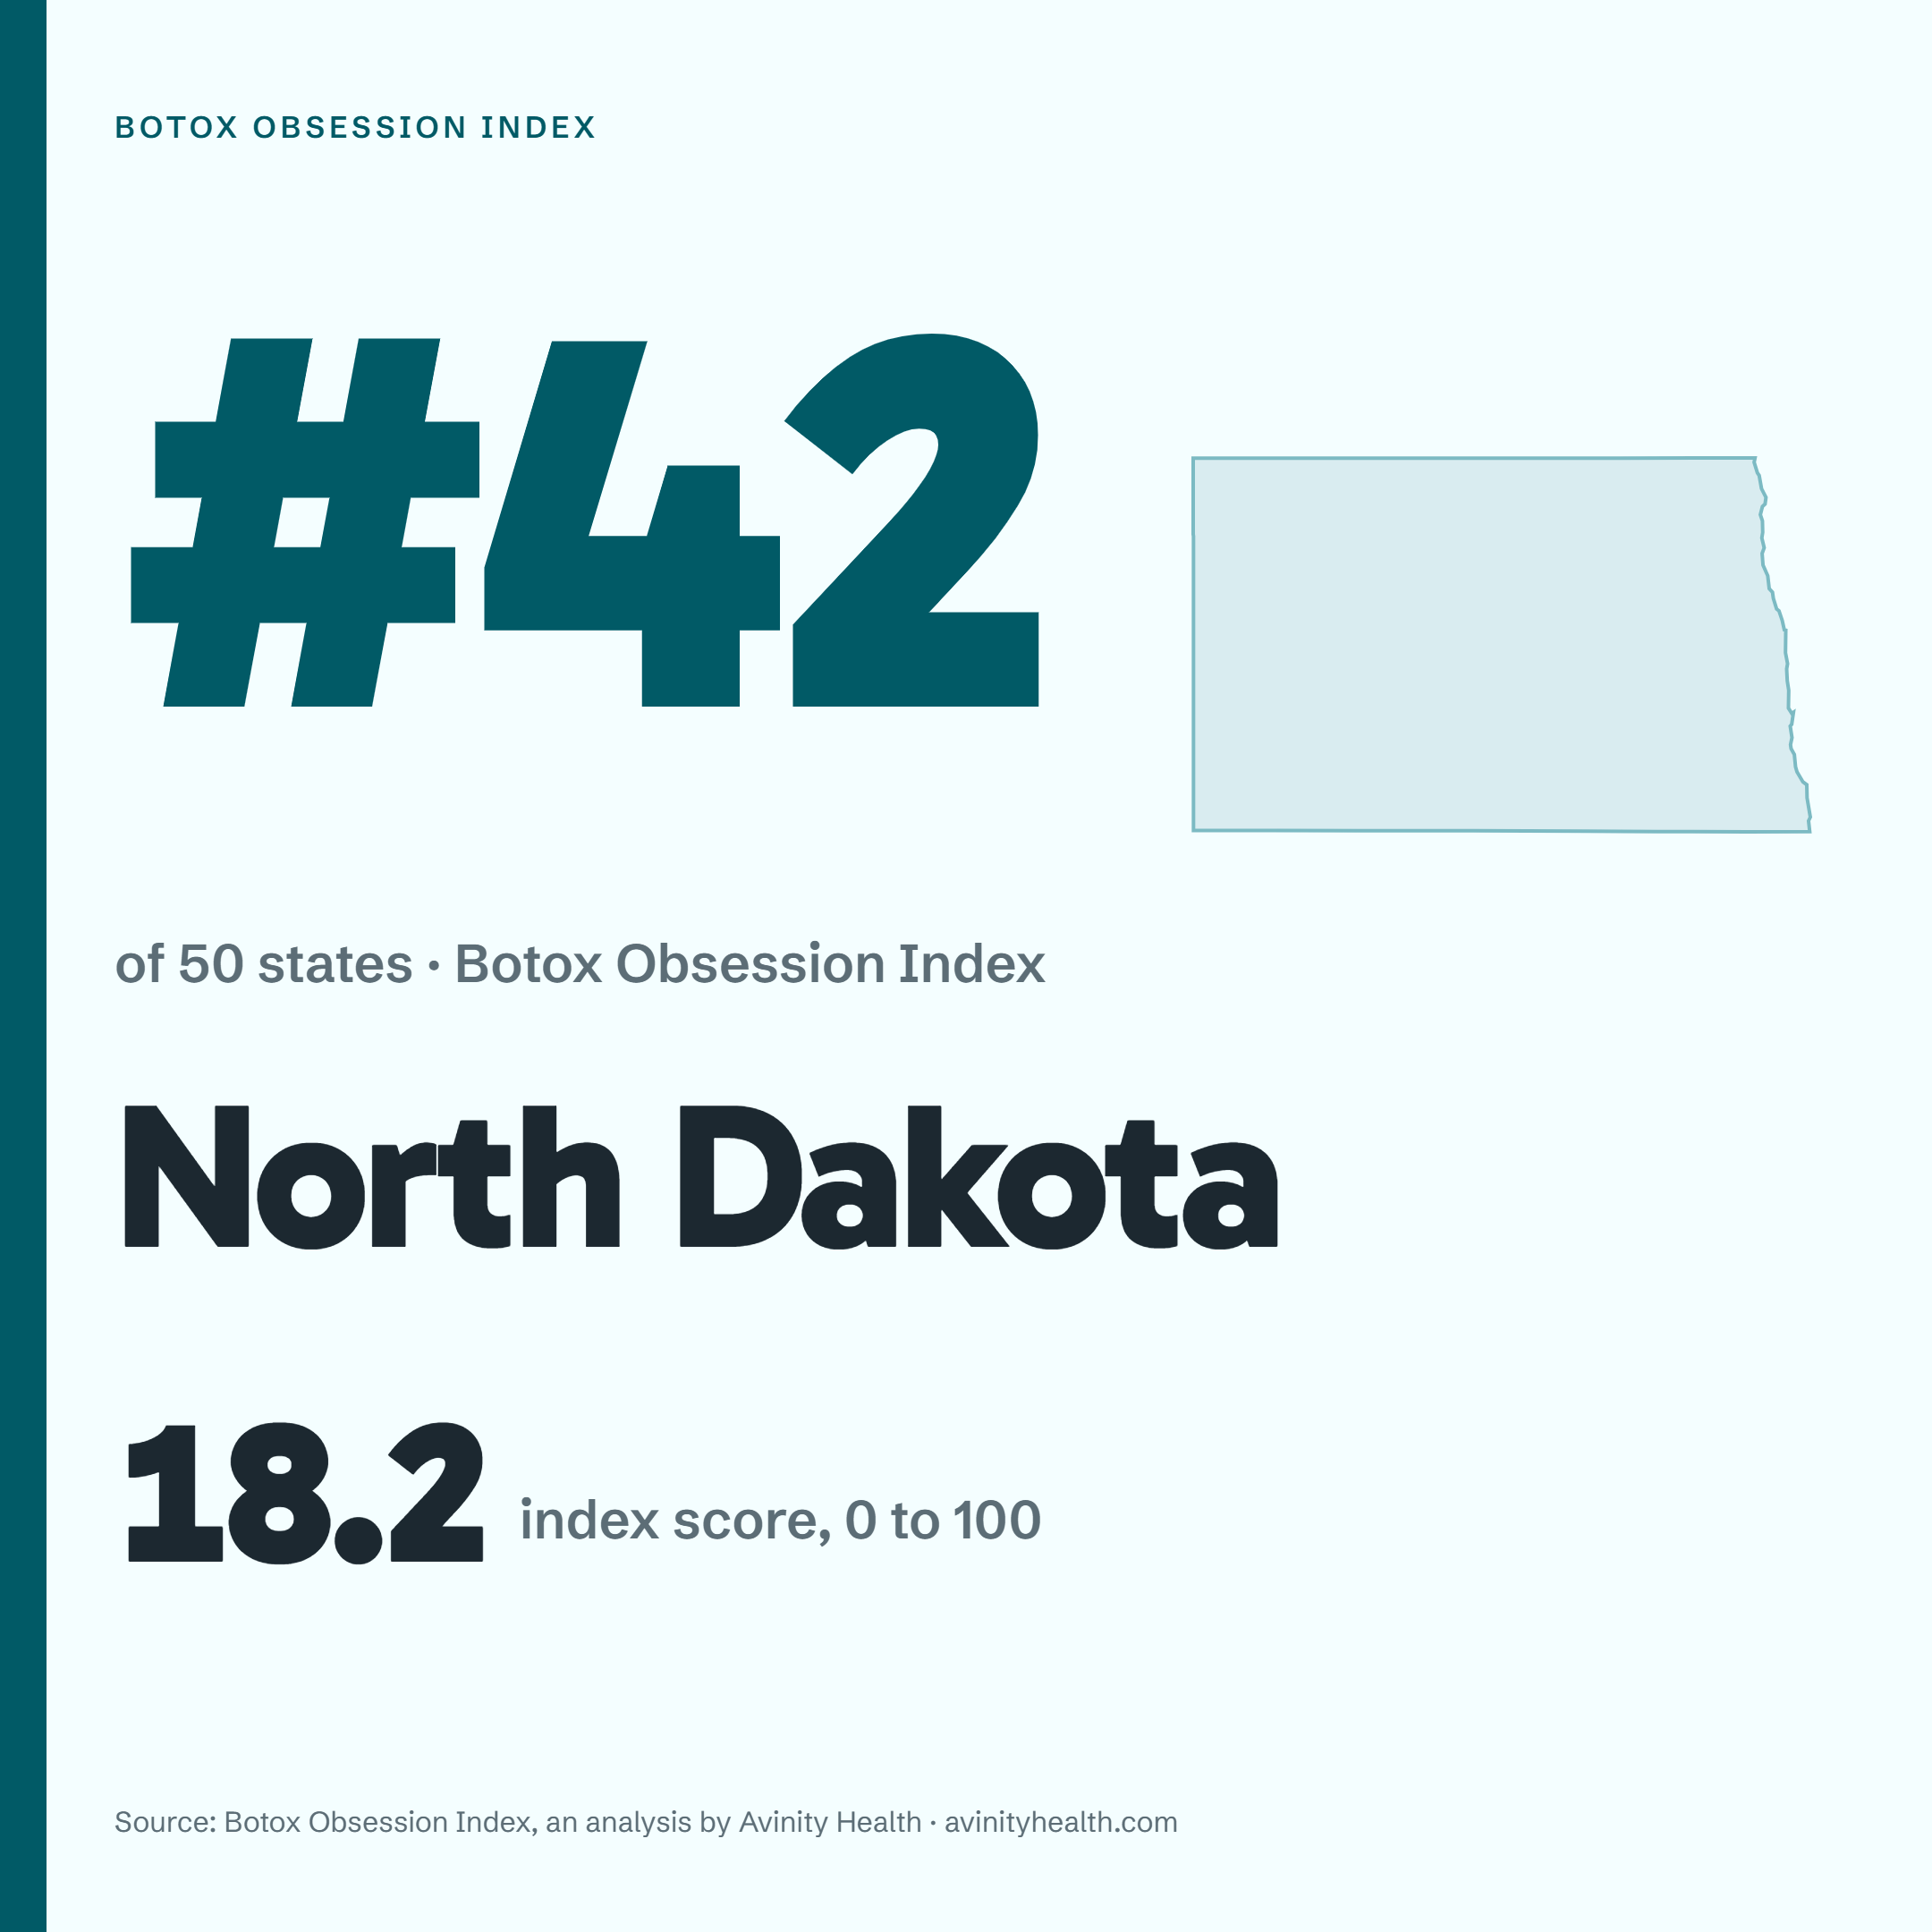
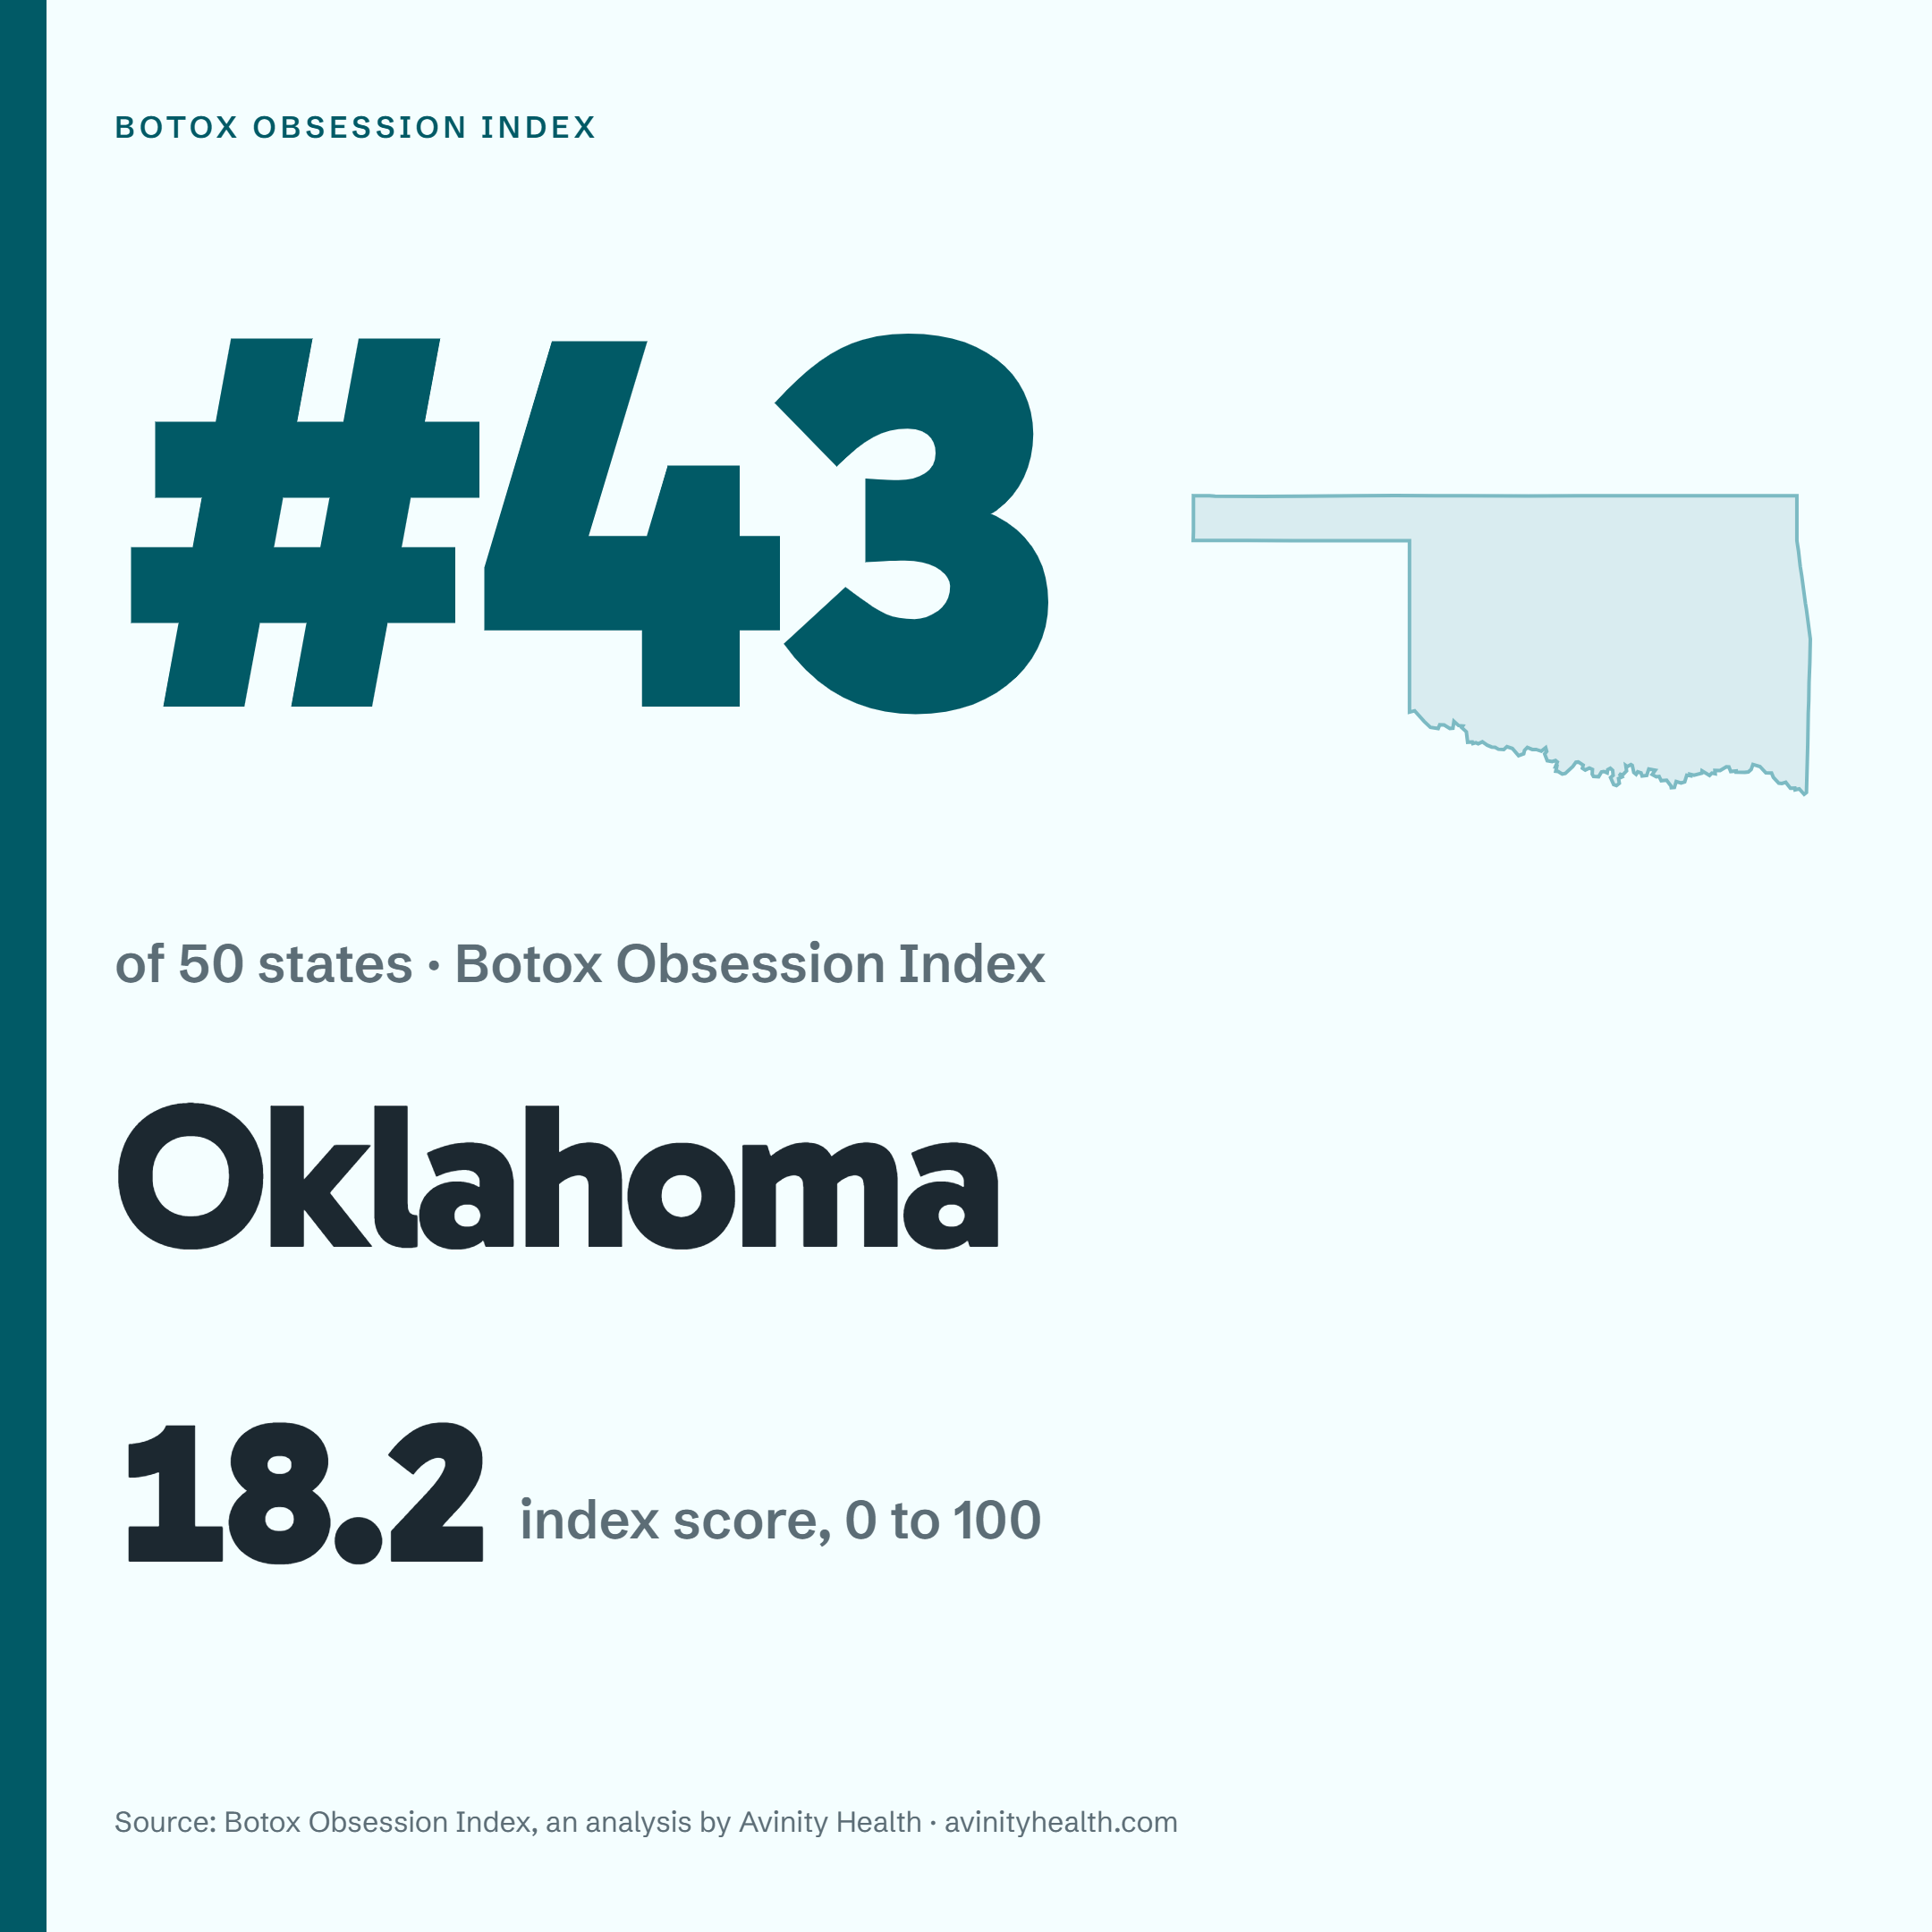
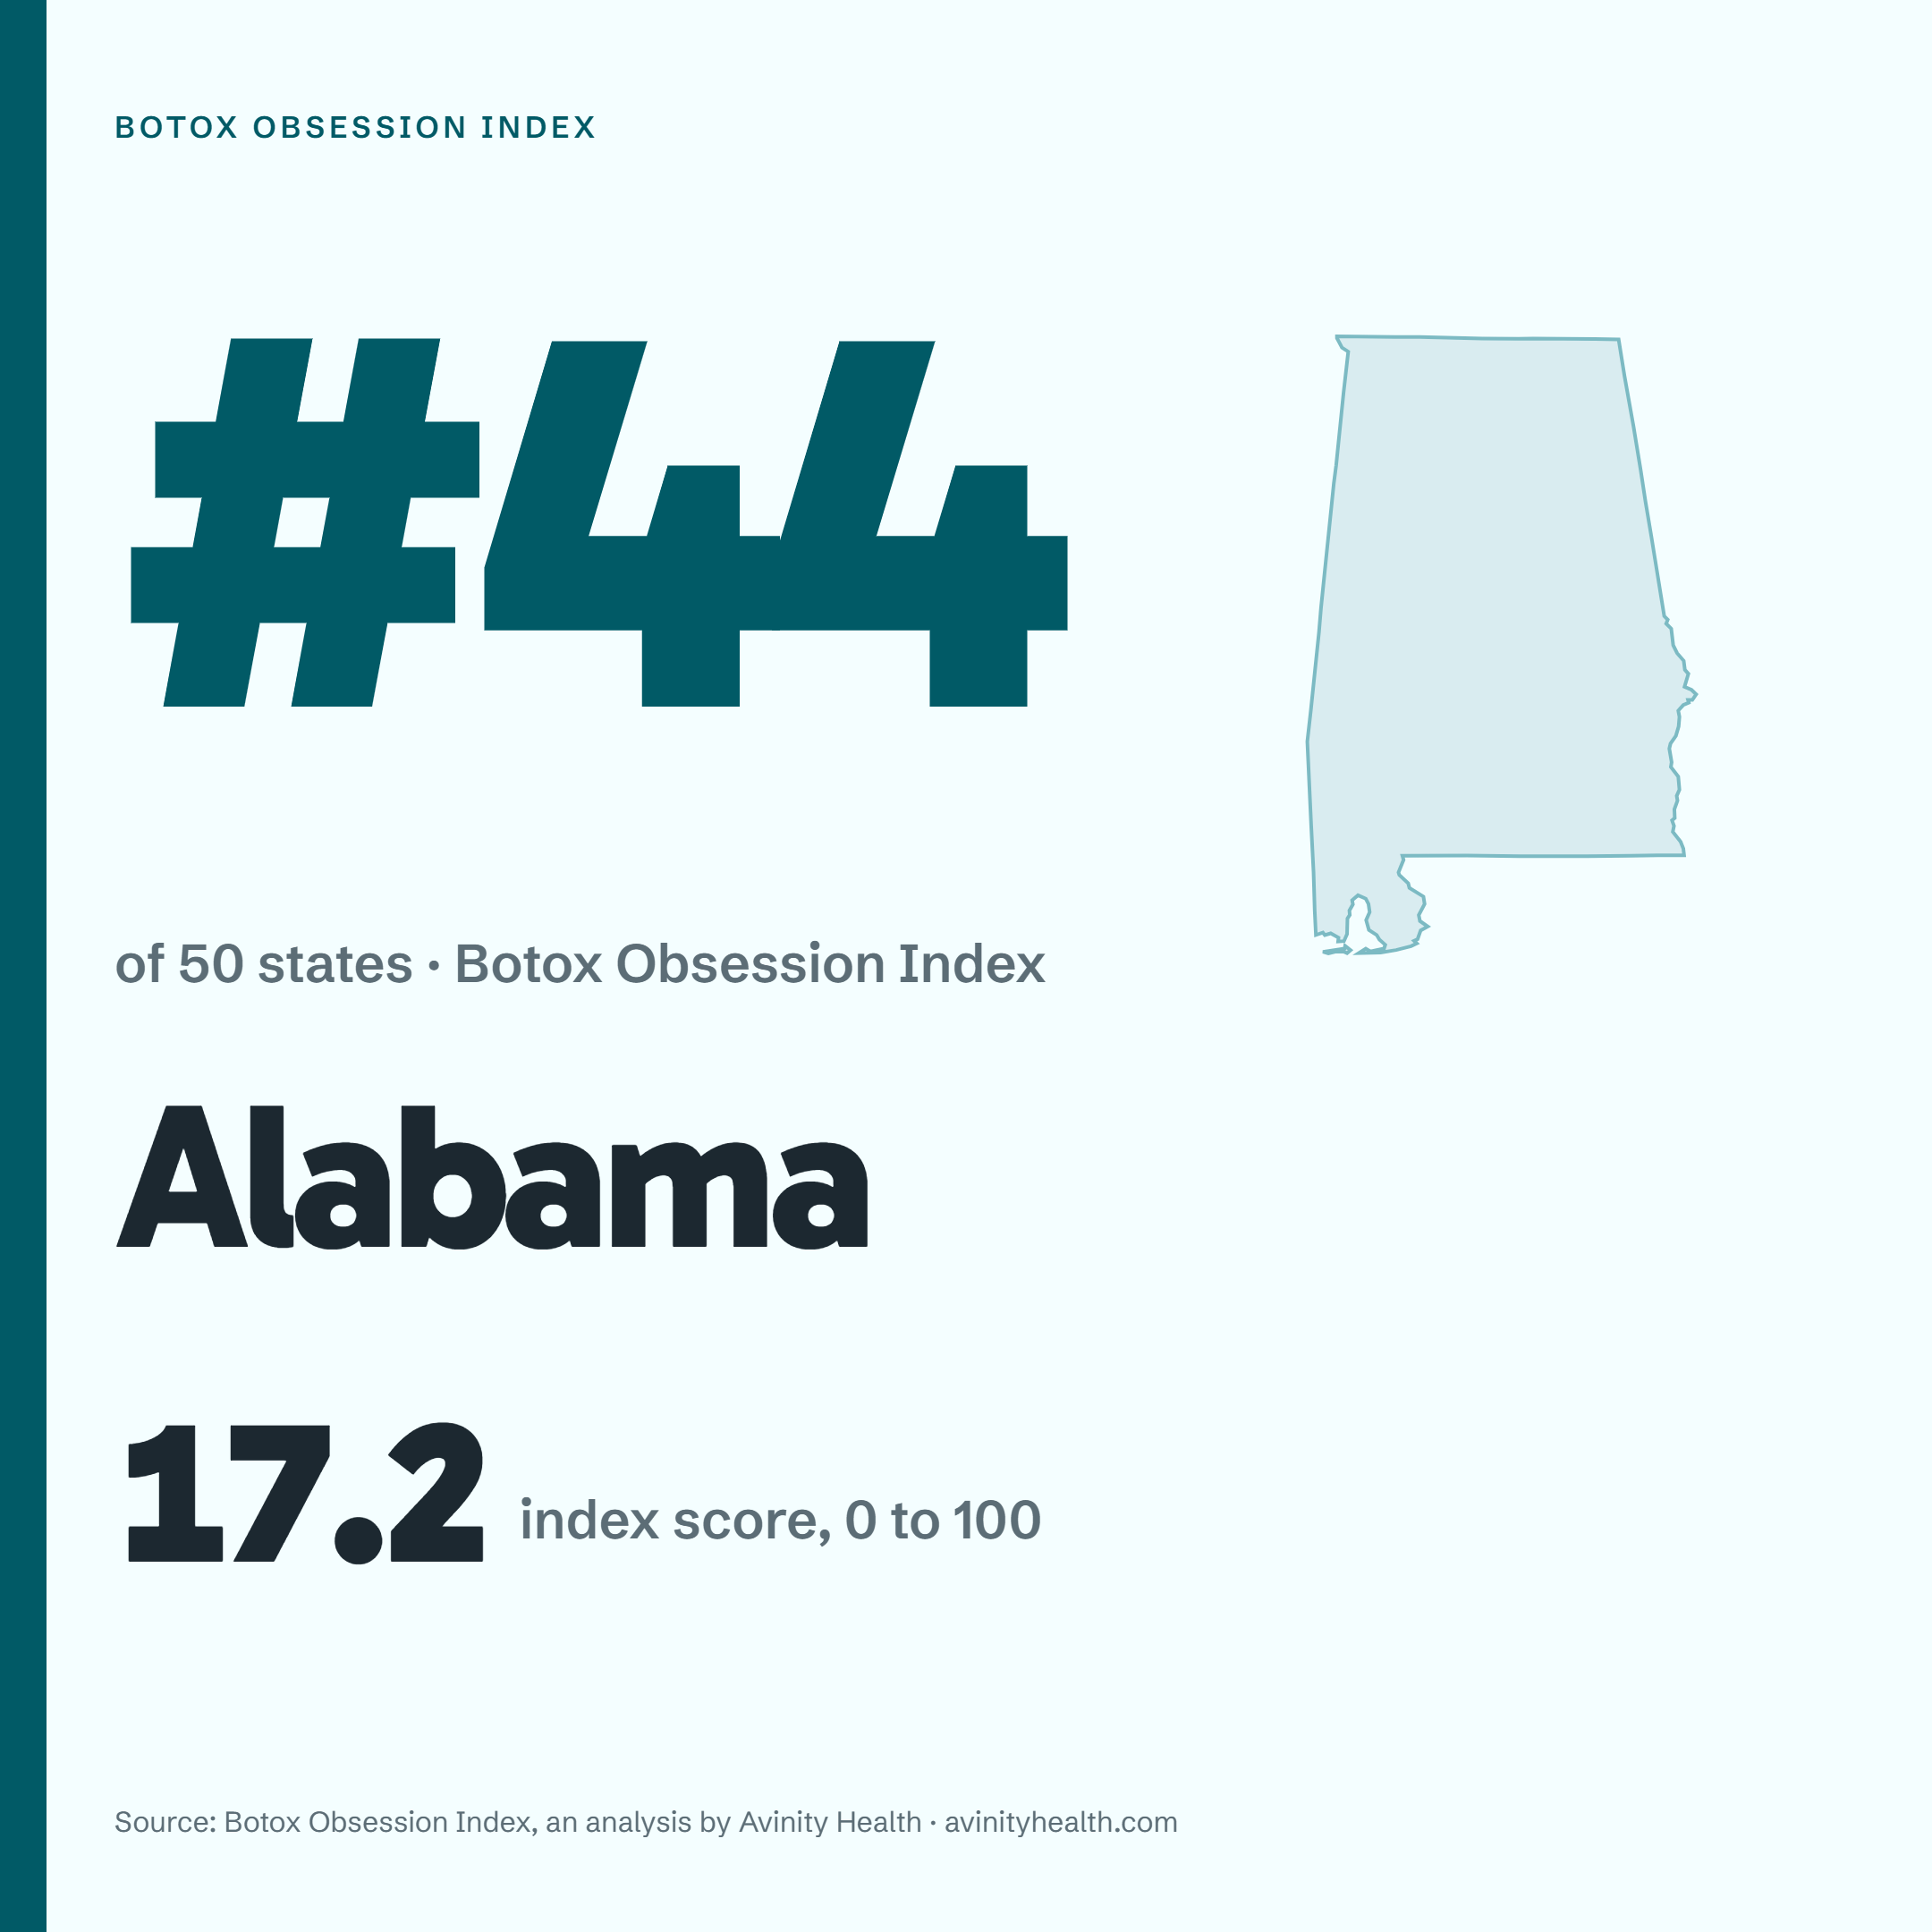
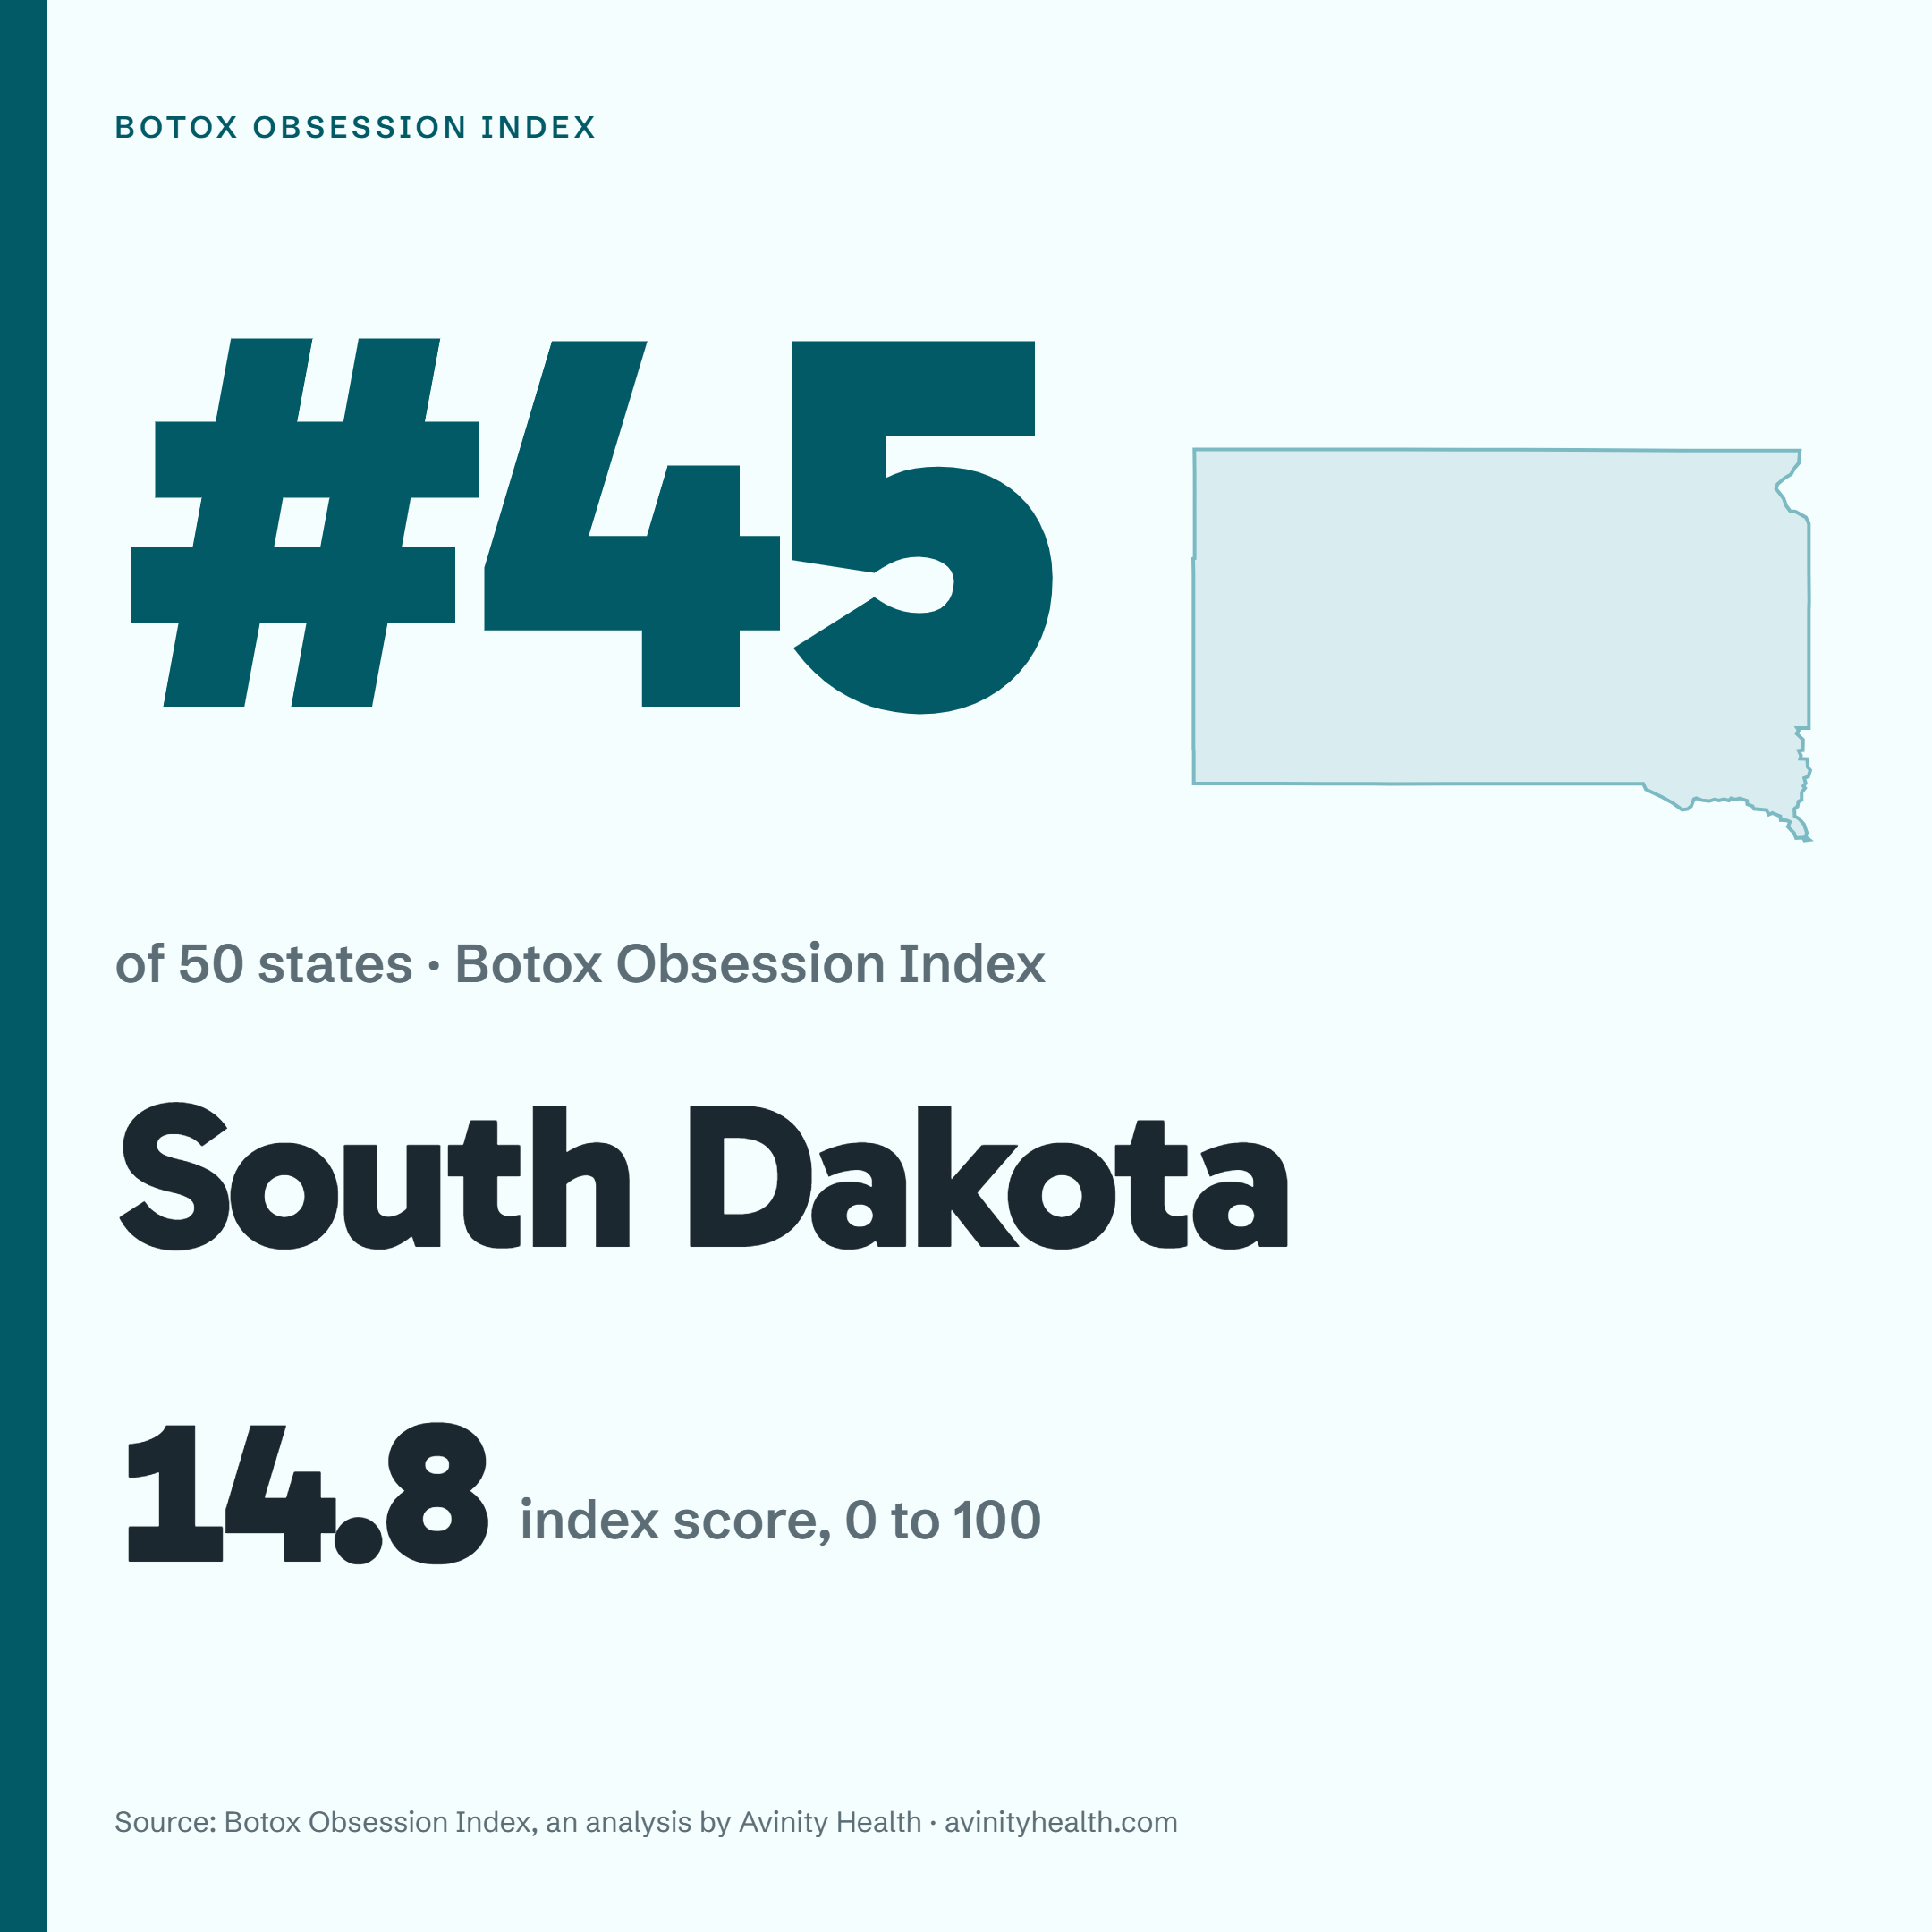
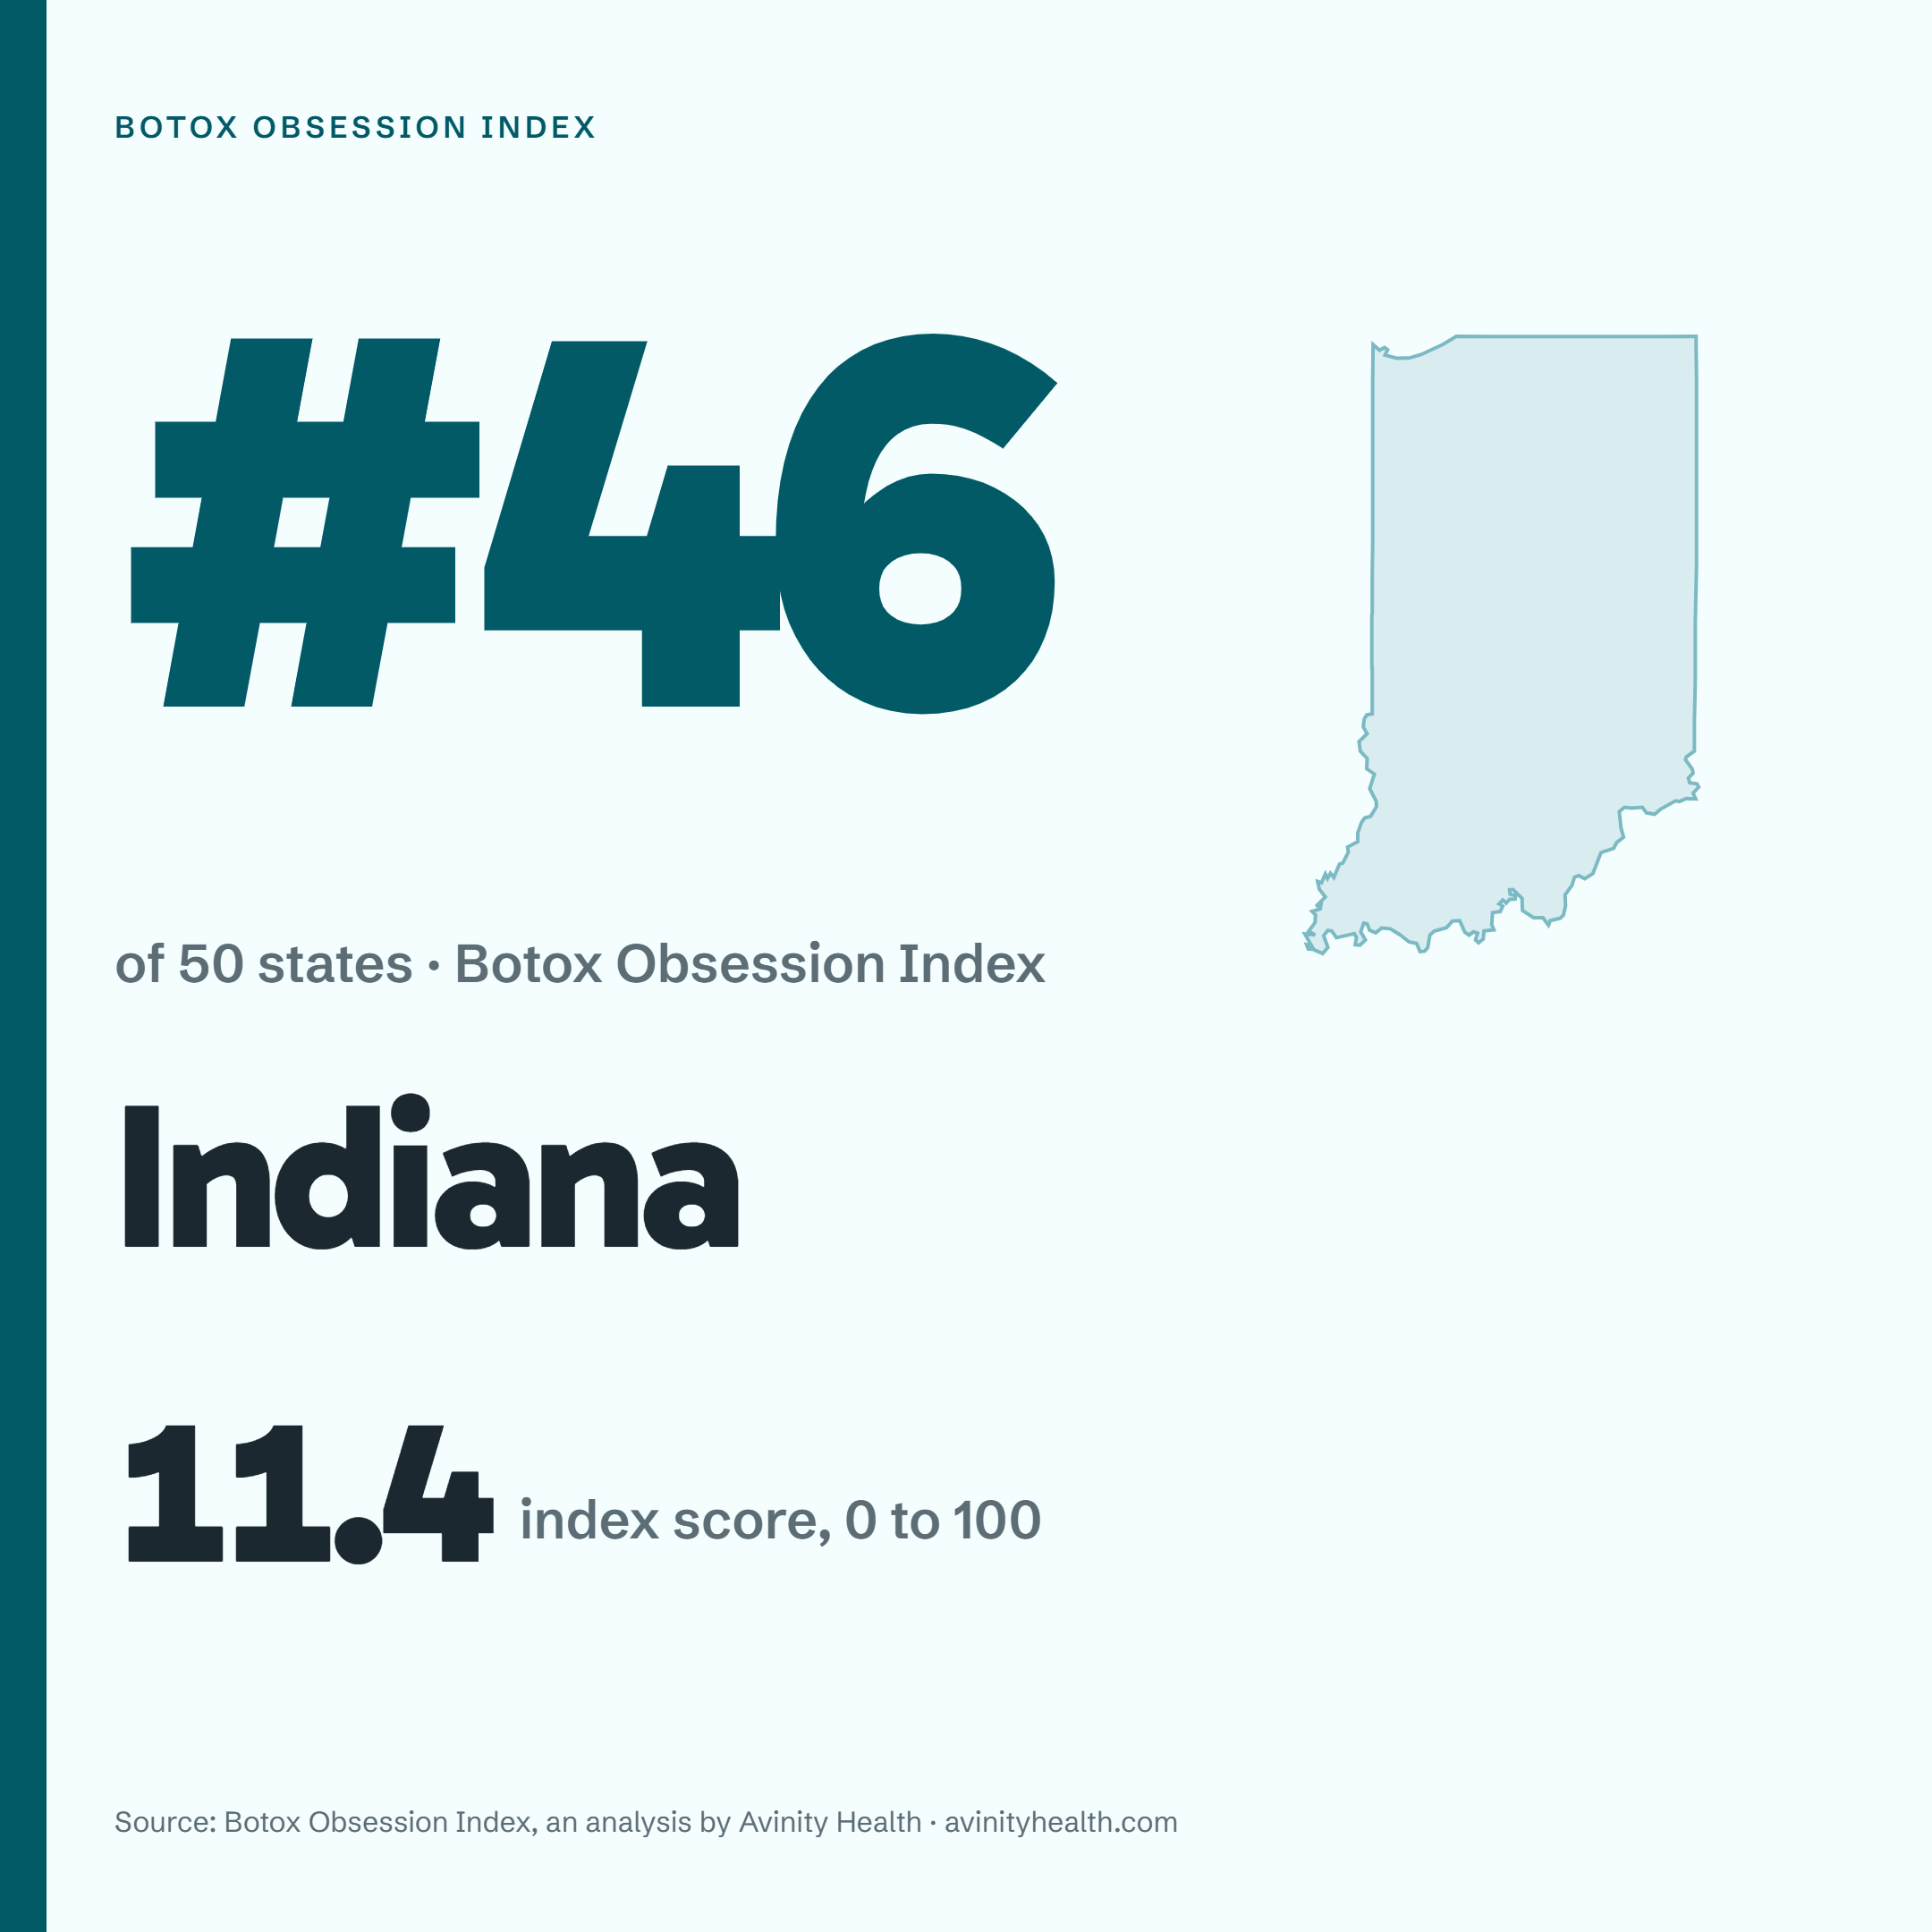
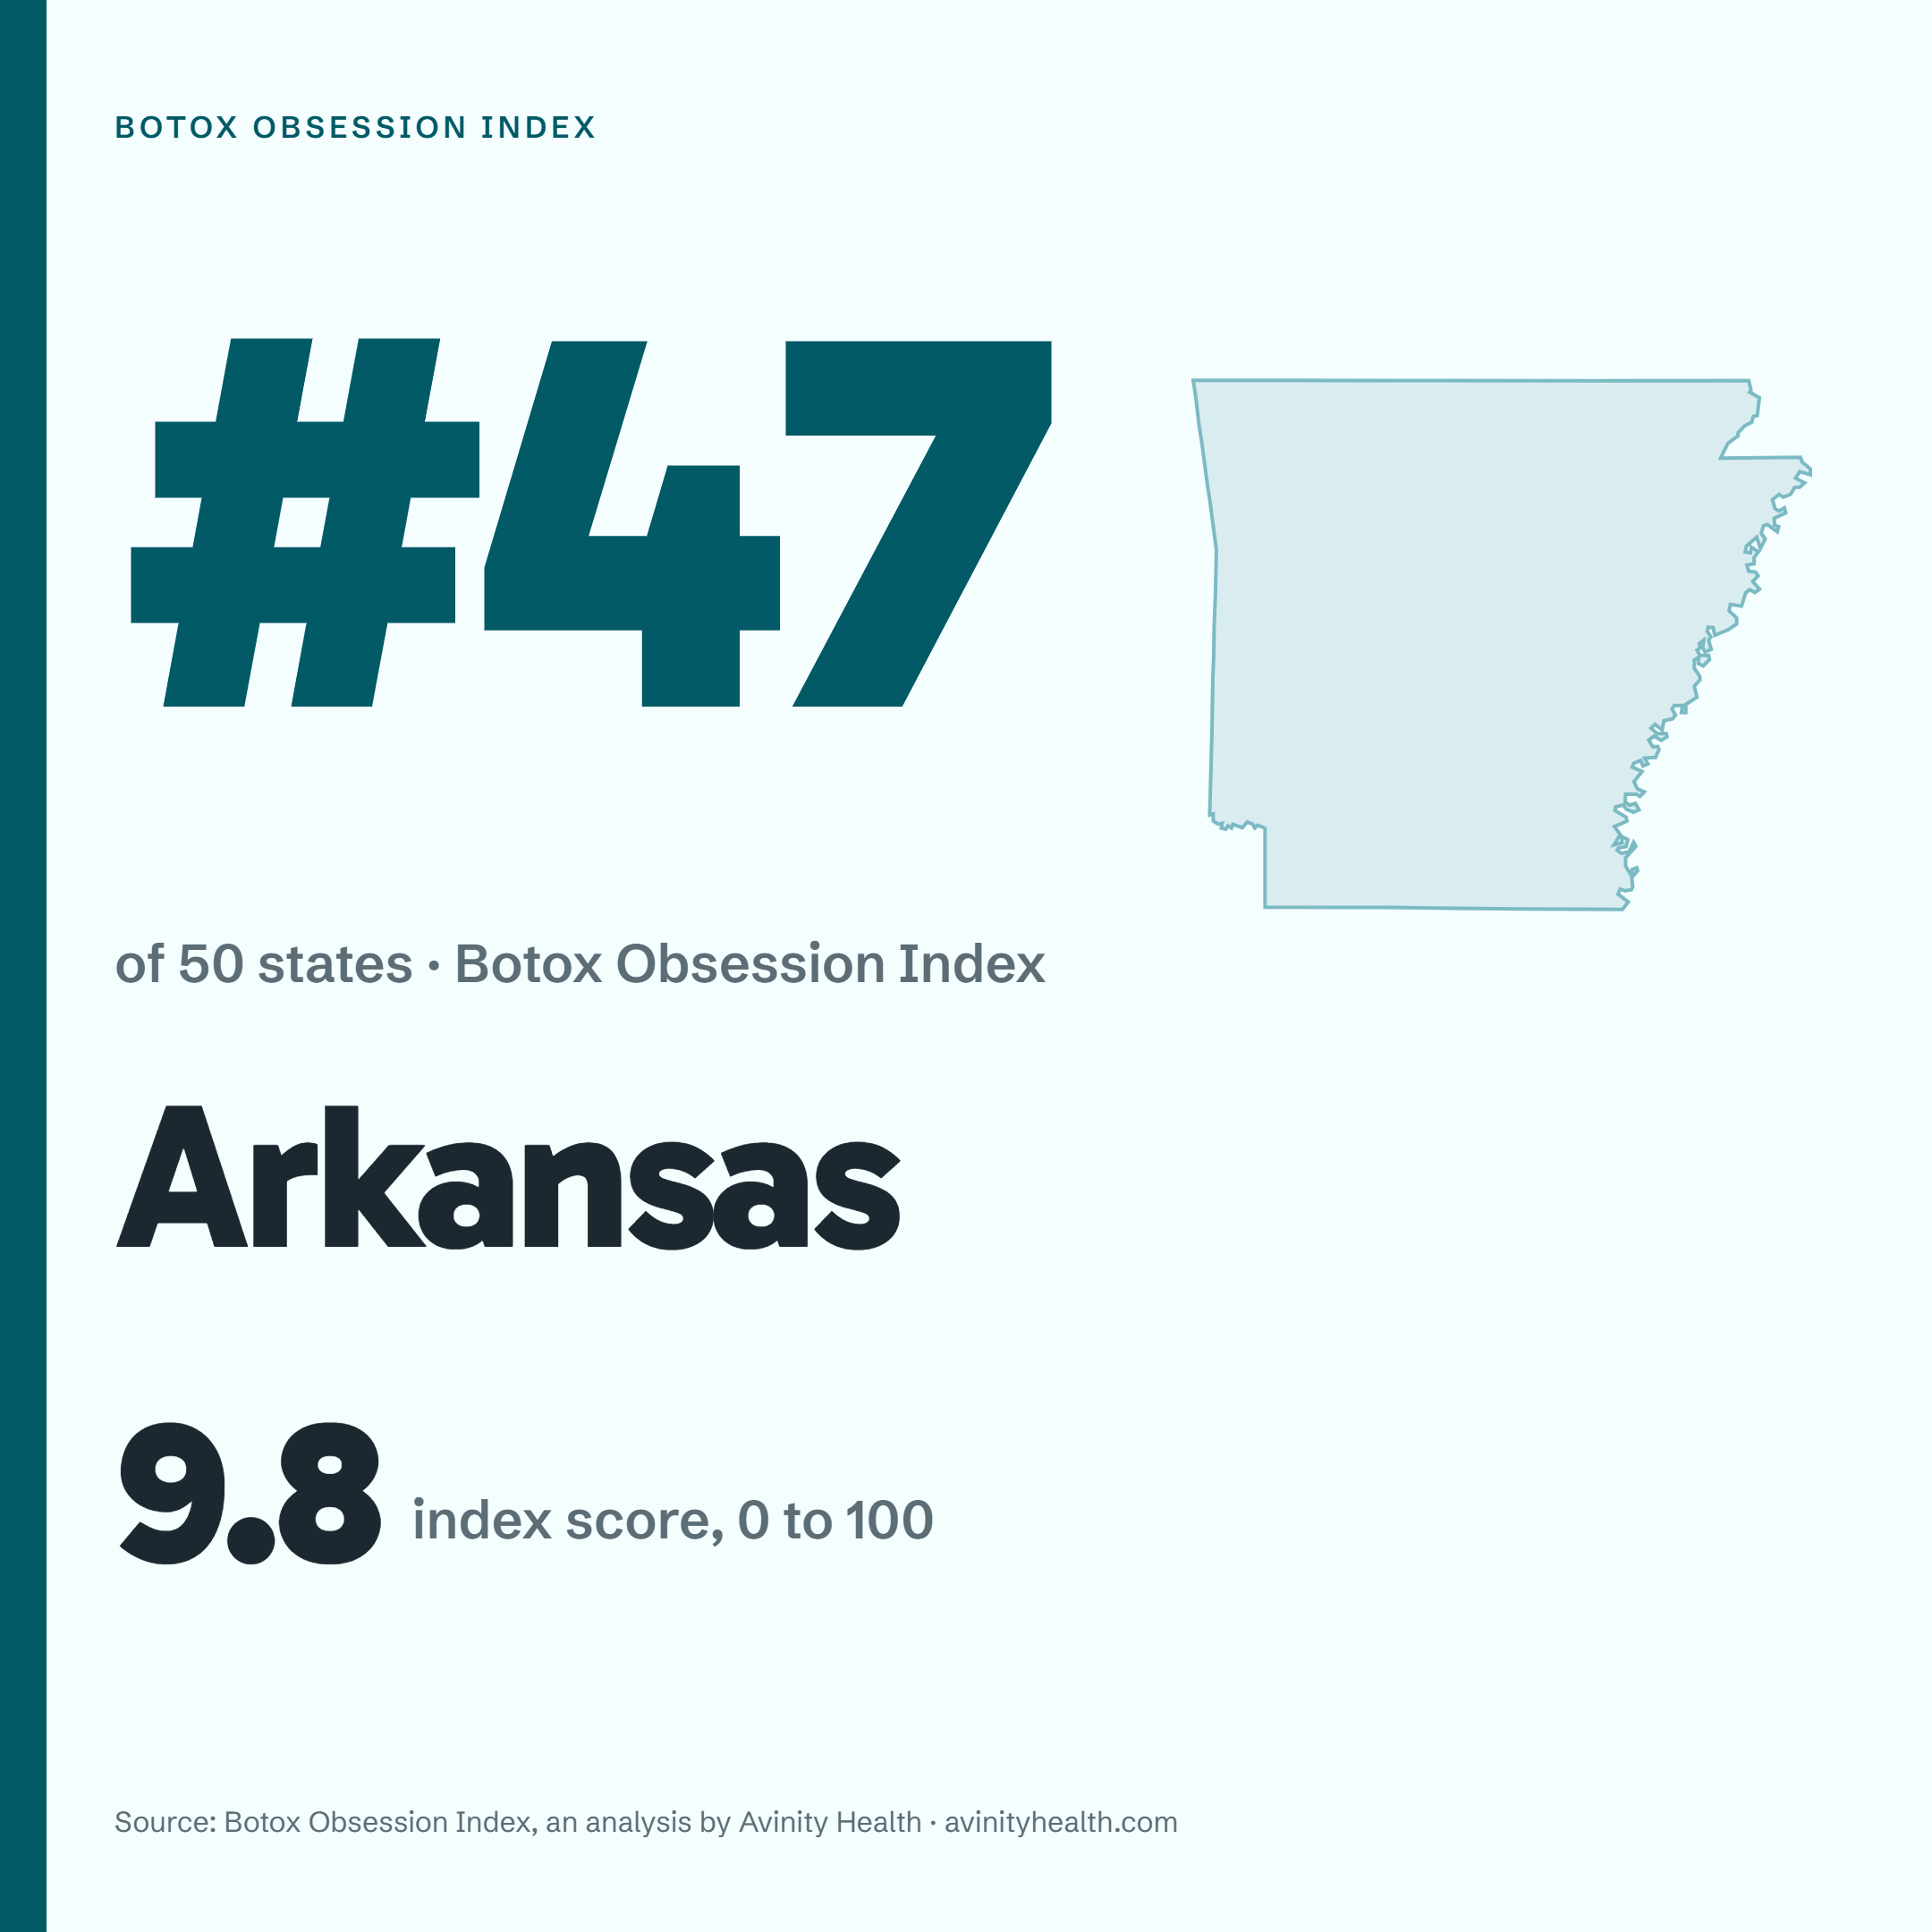
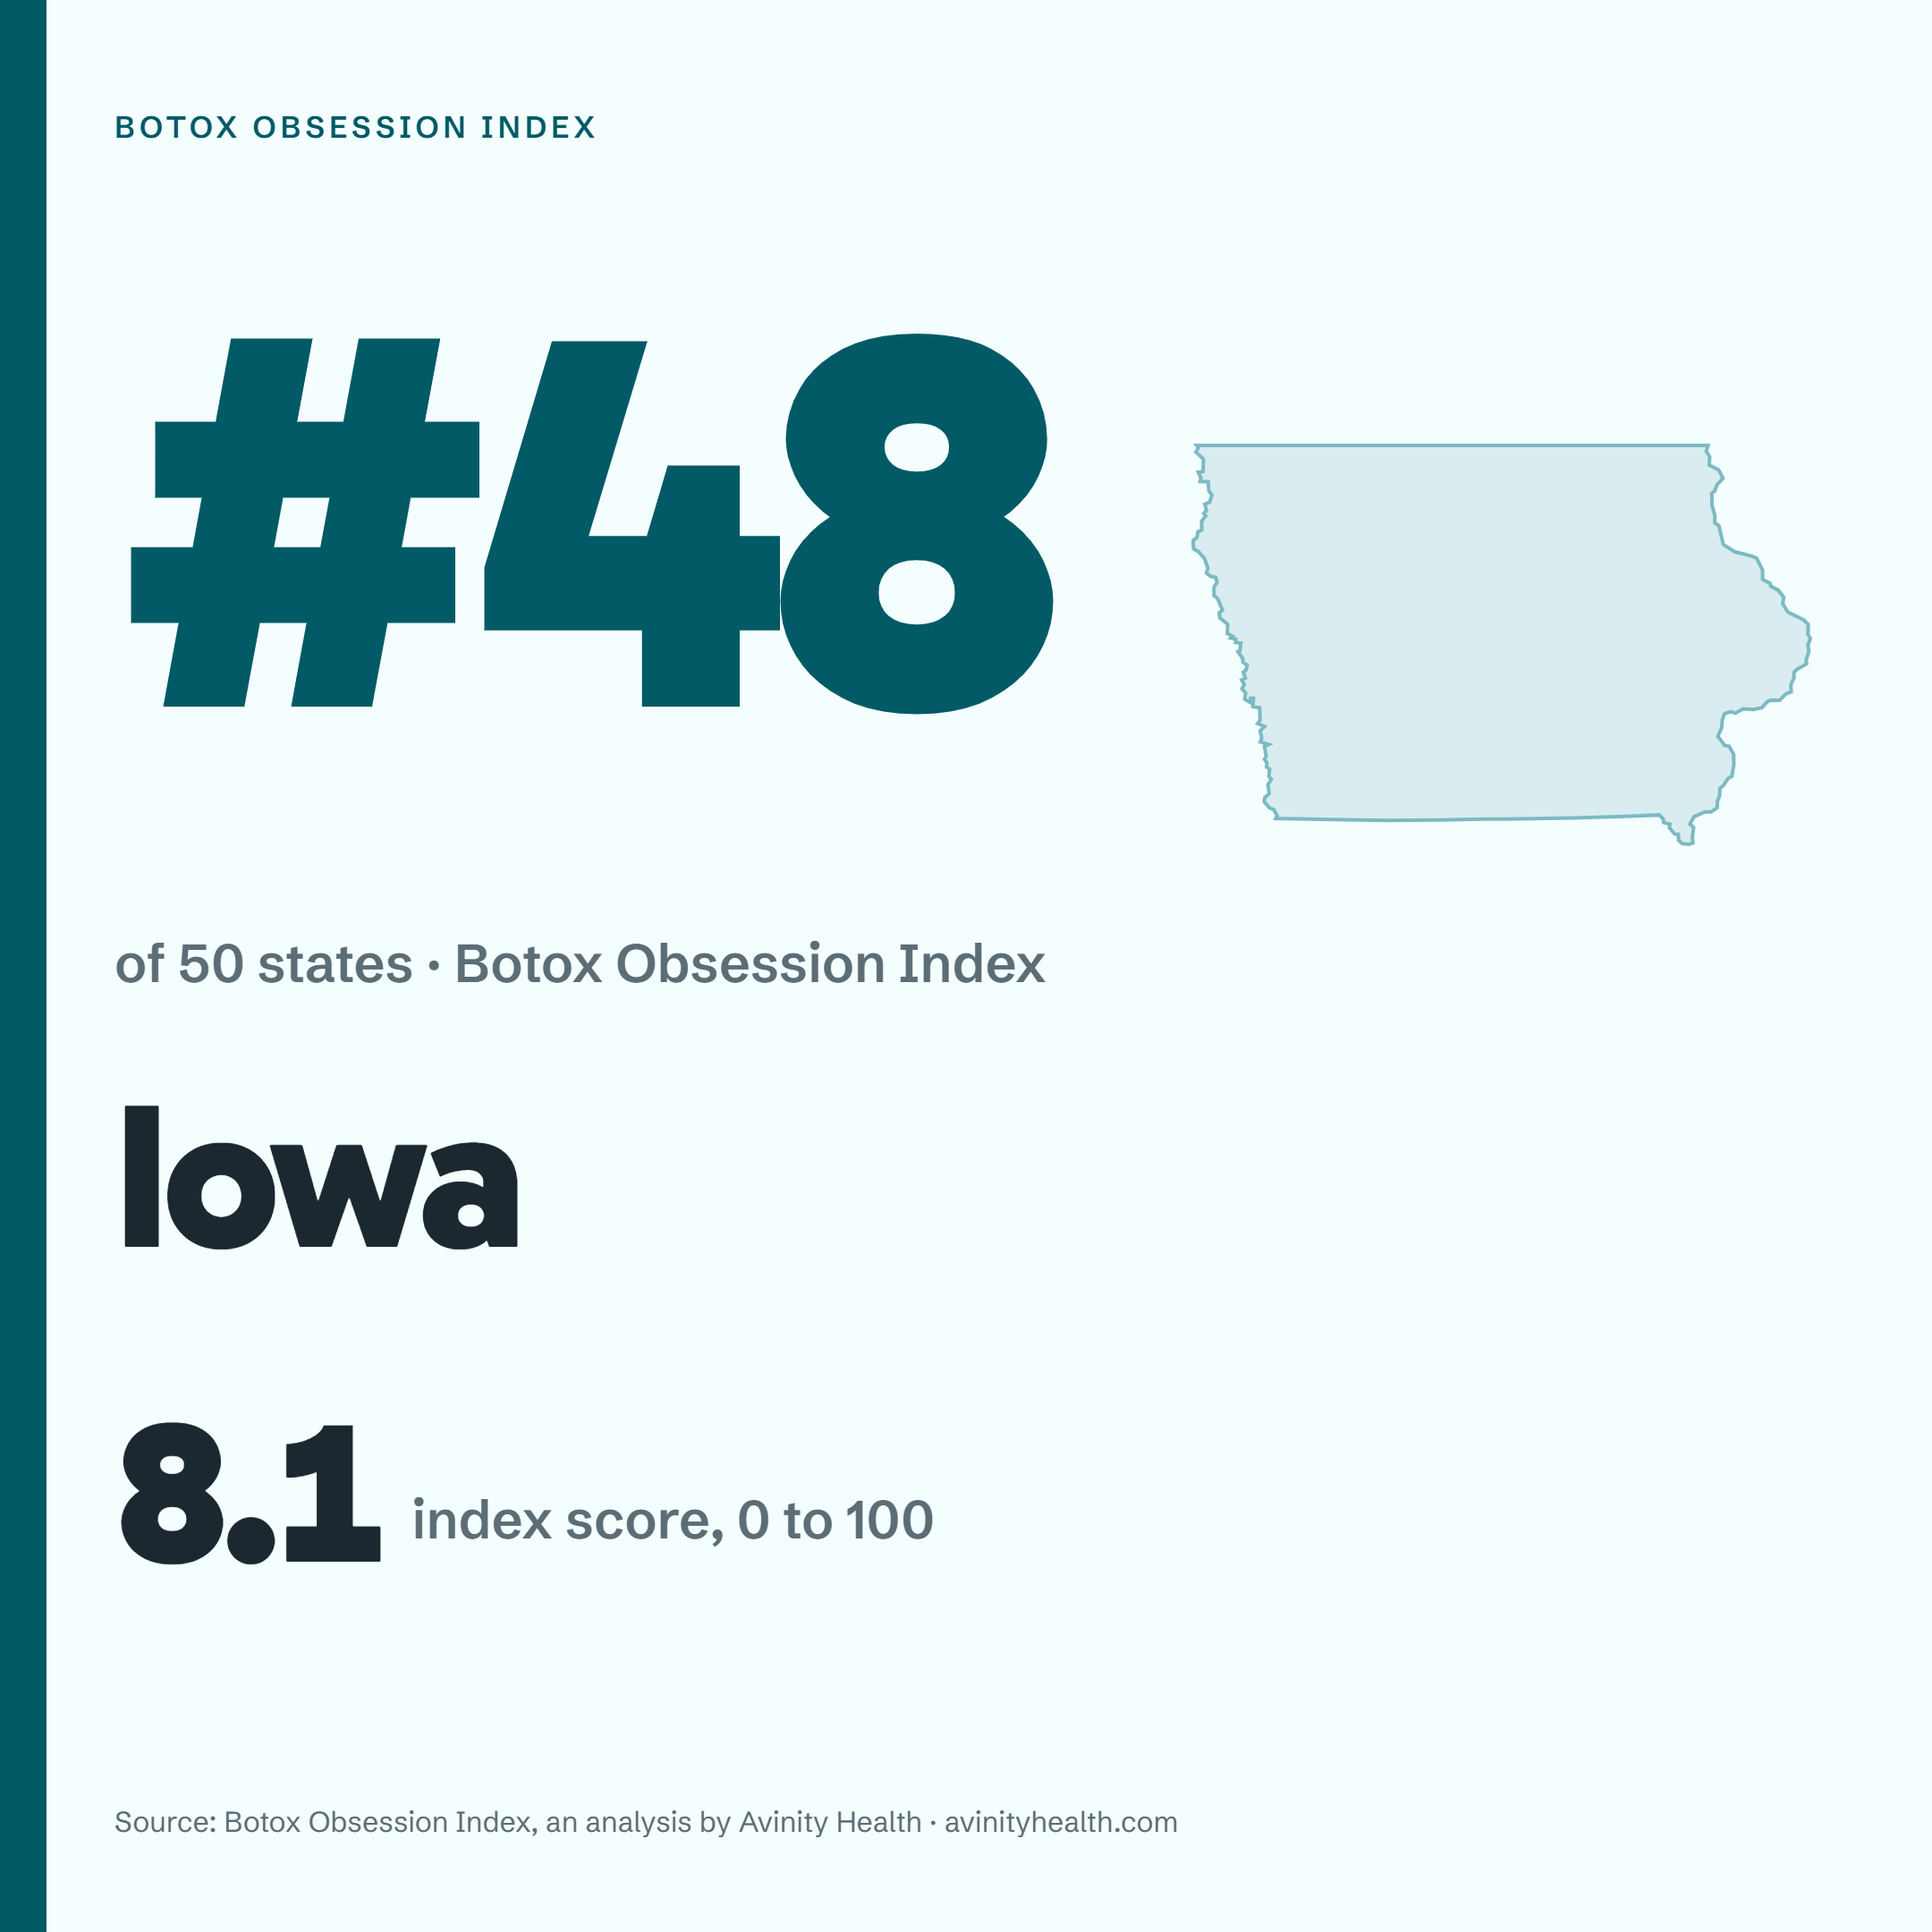
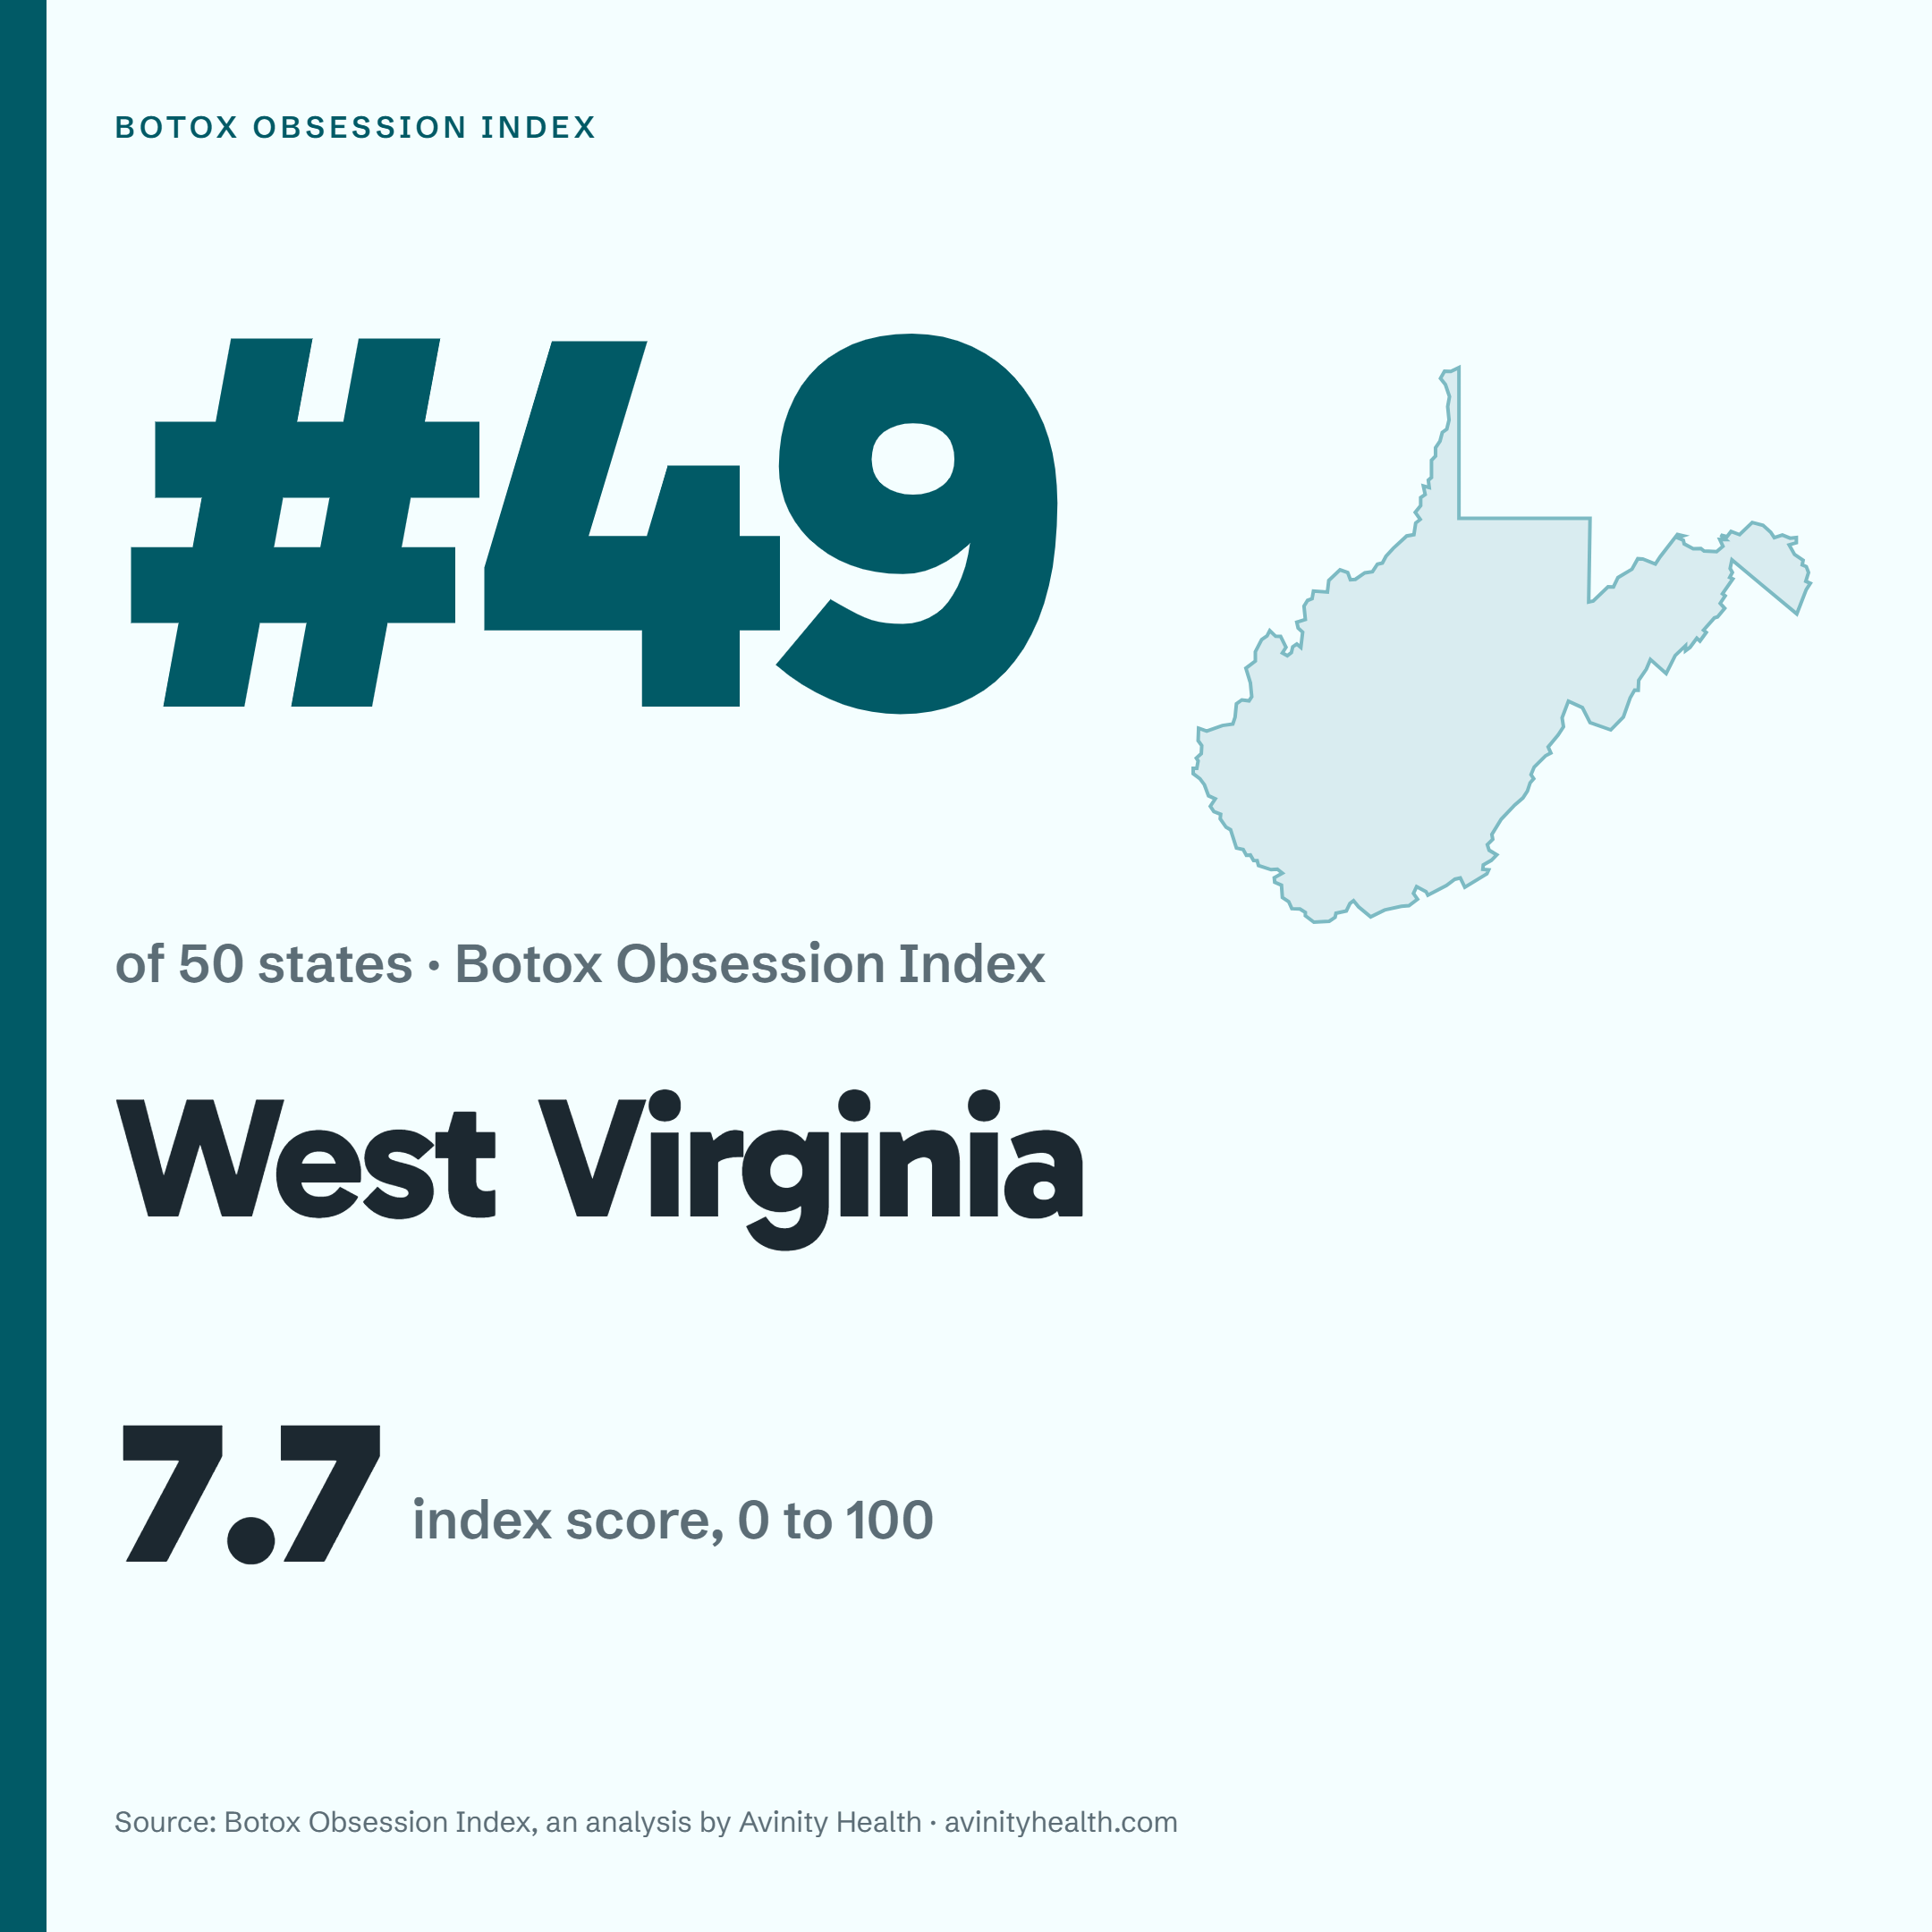
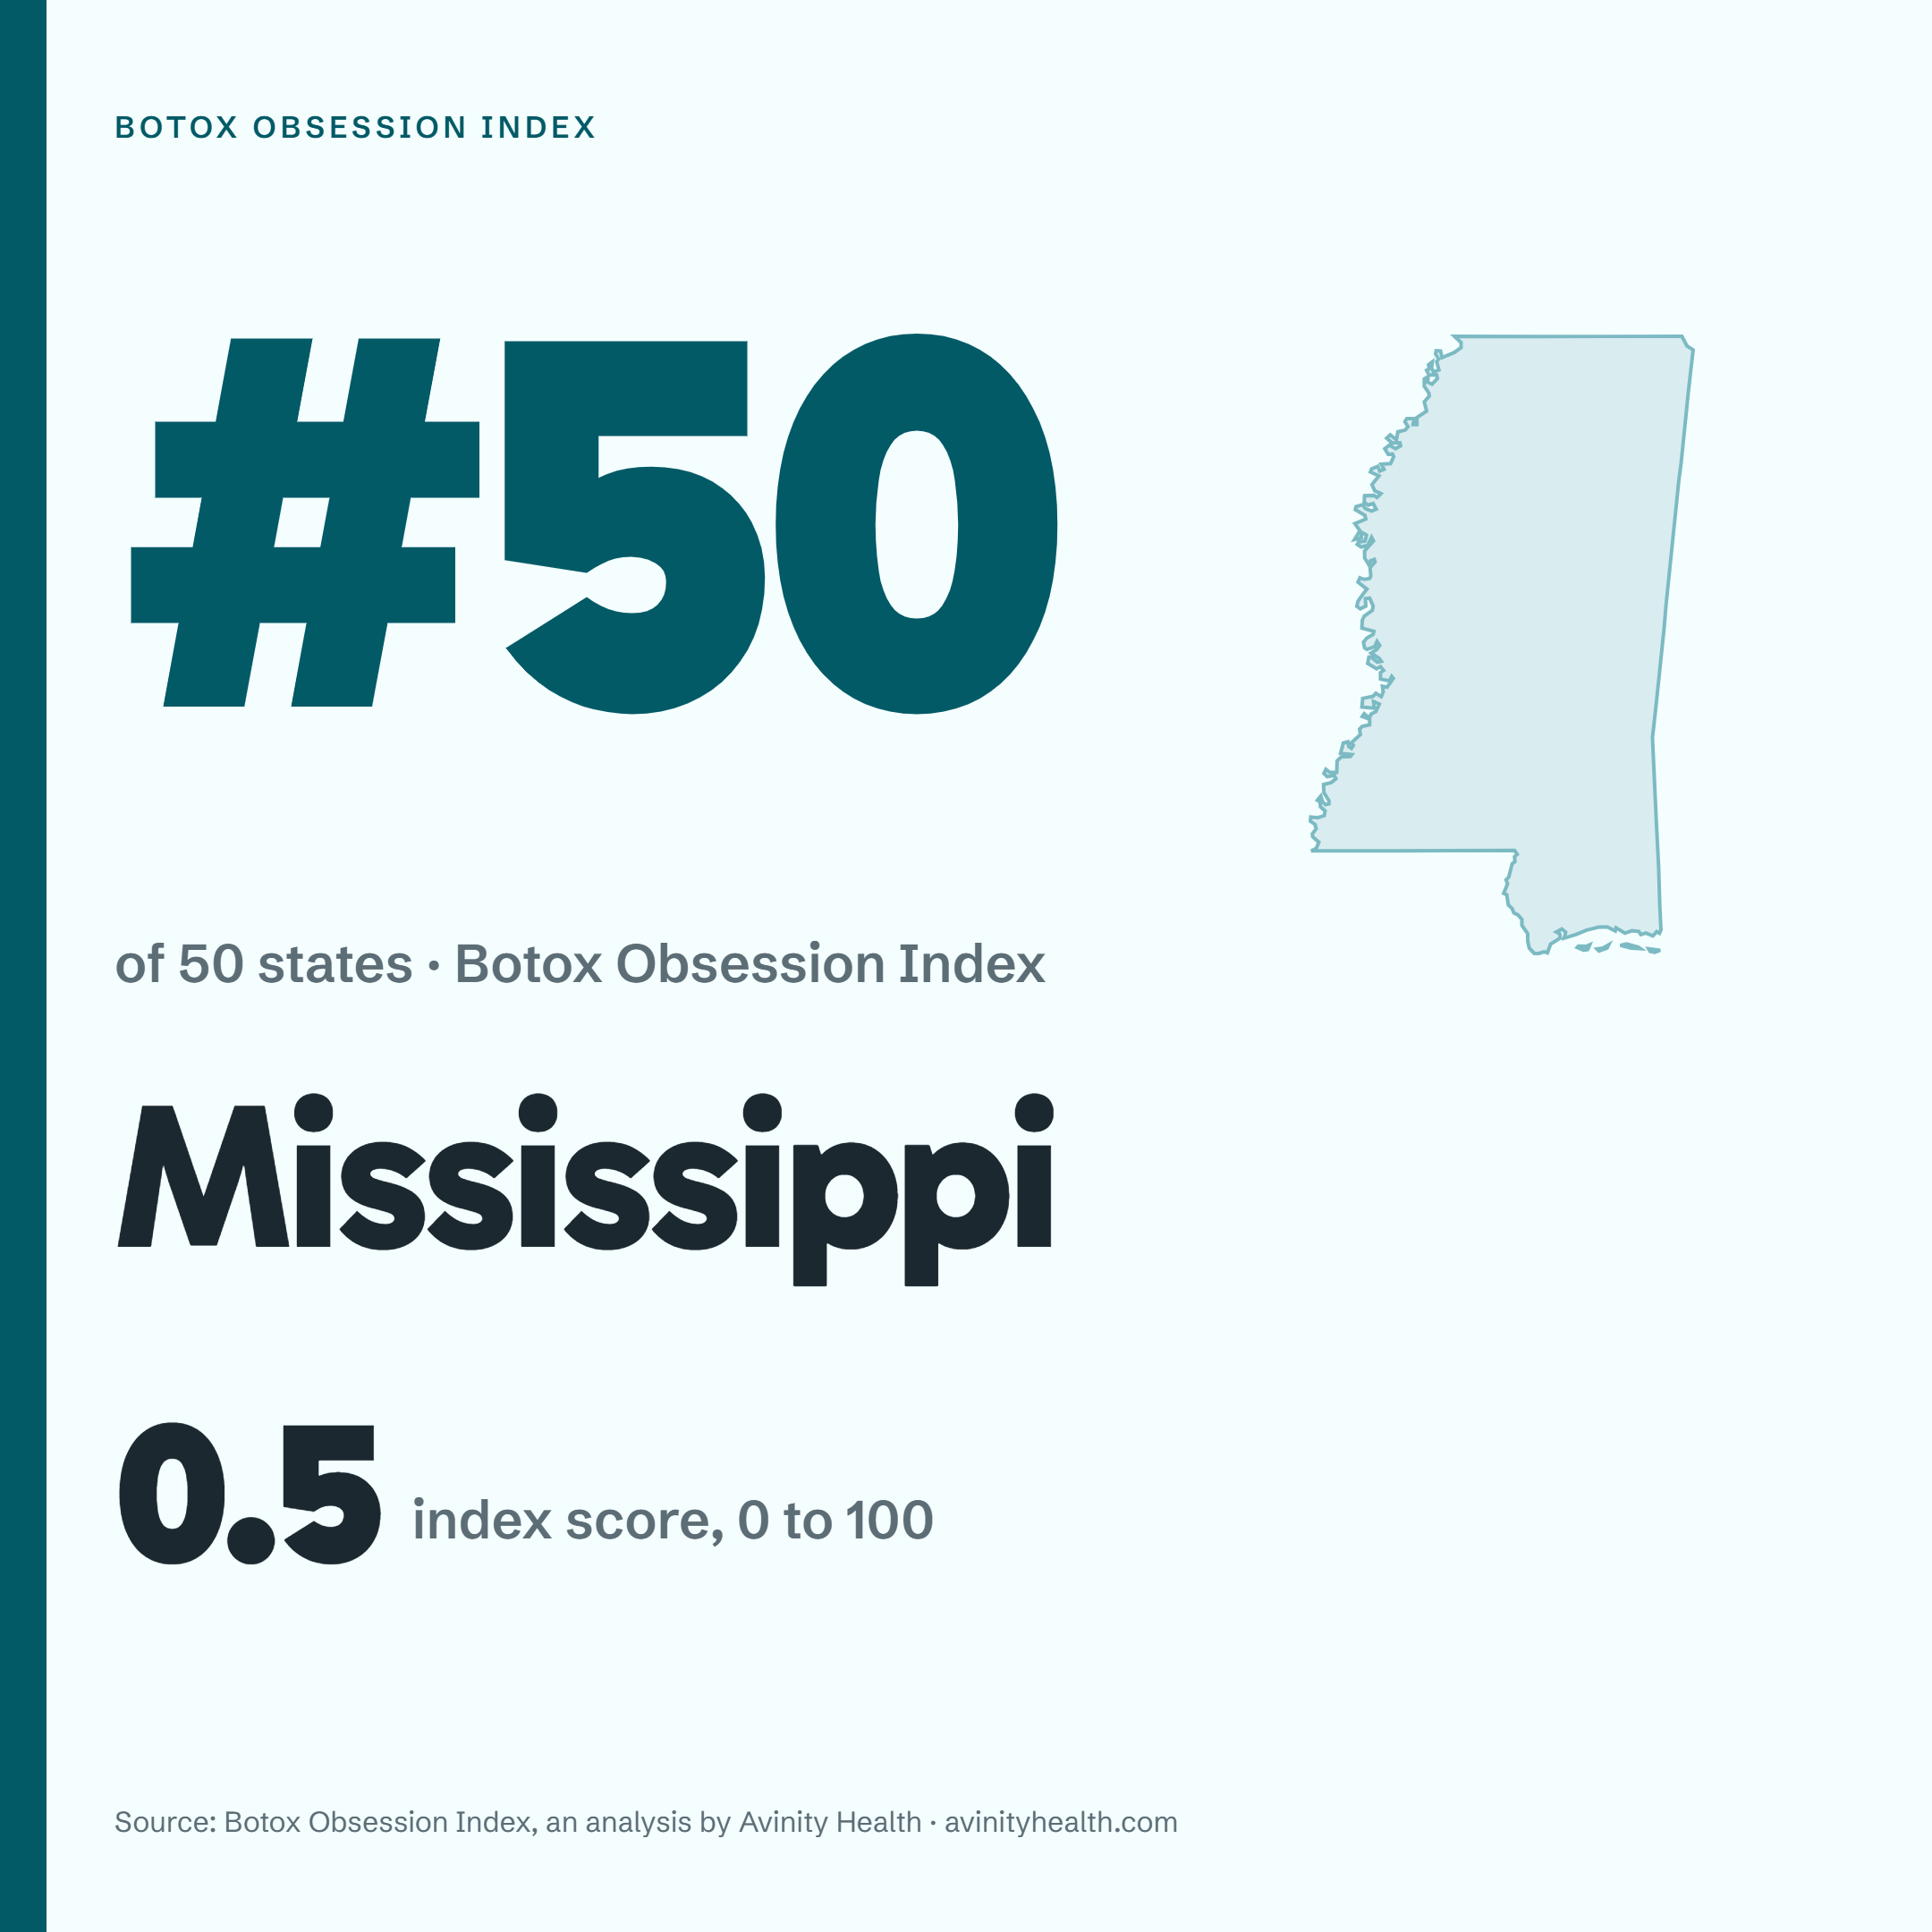
One card per state, 1080 × 1080, carrying that state's rank, score and component figures. Pick the state your story is about and download it.
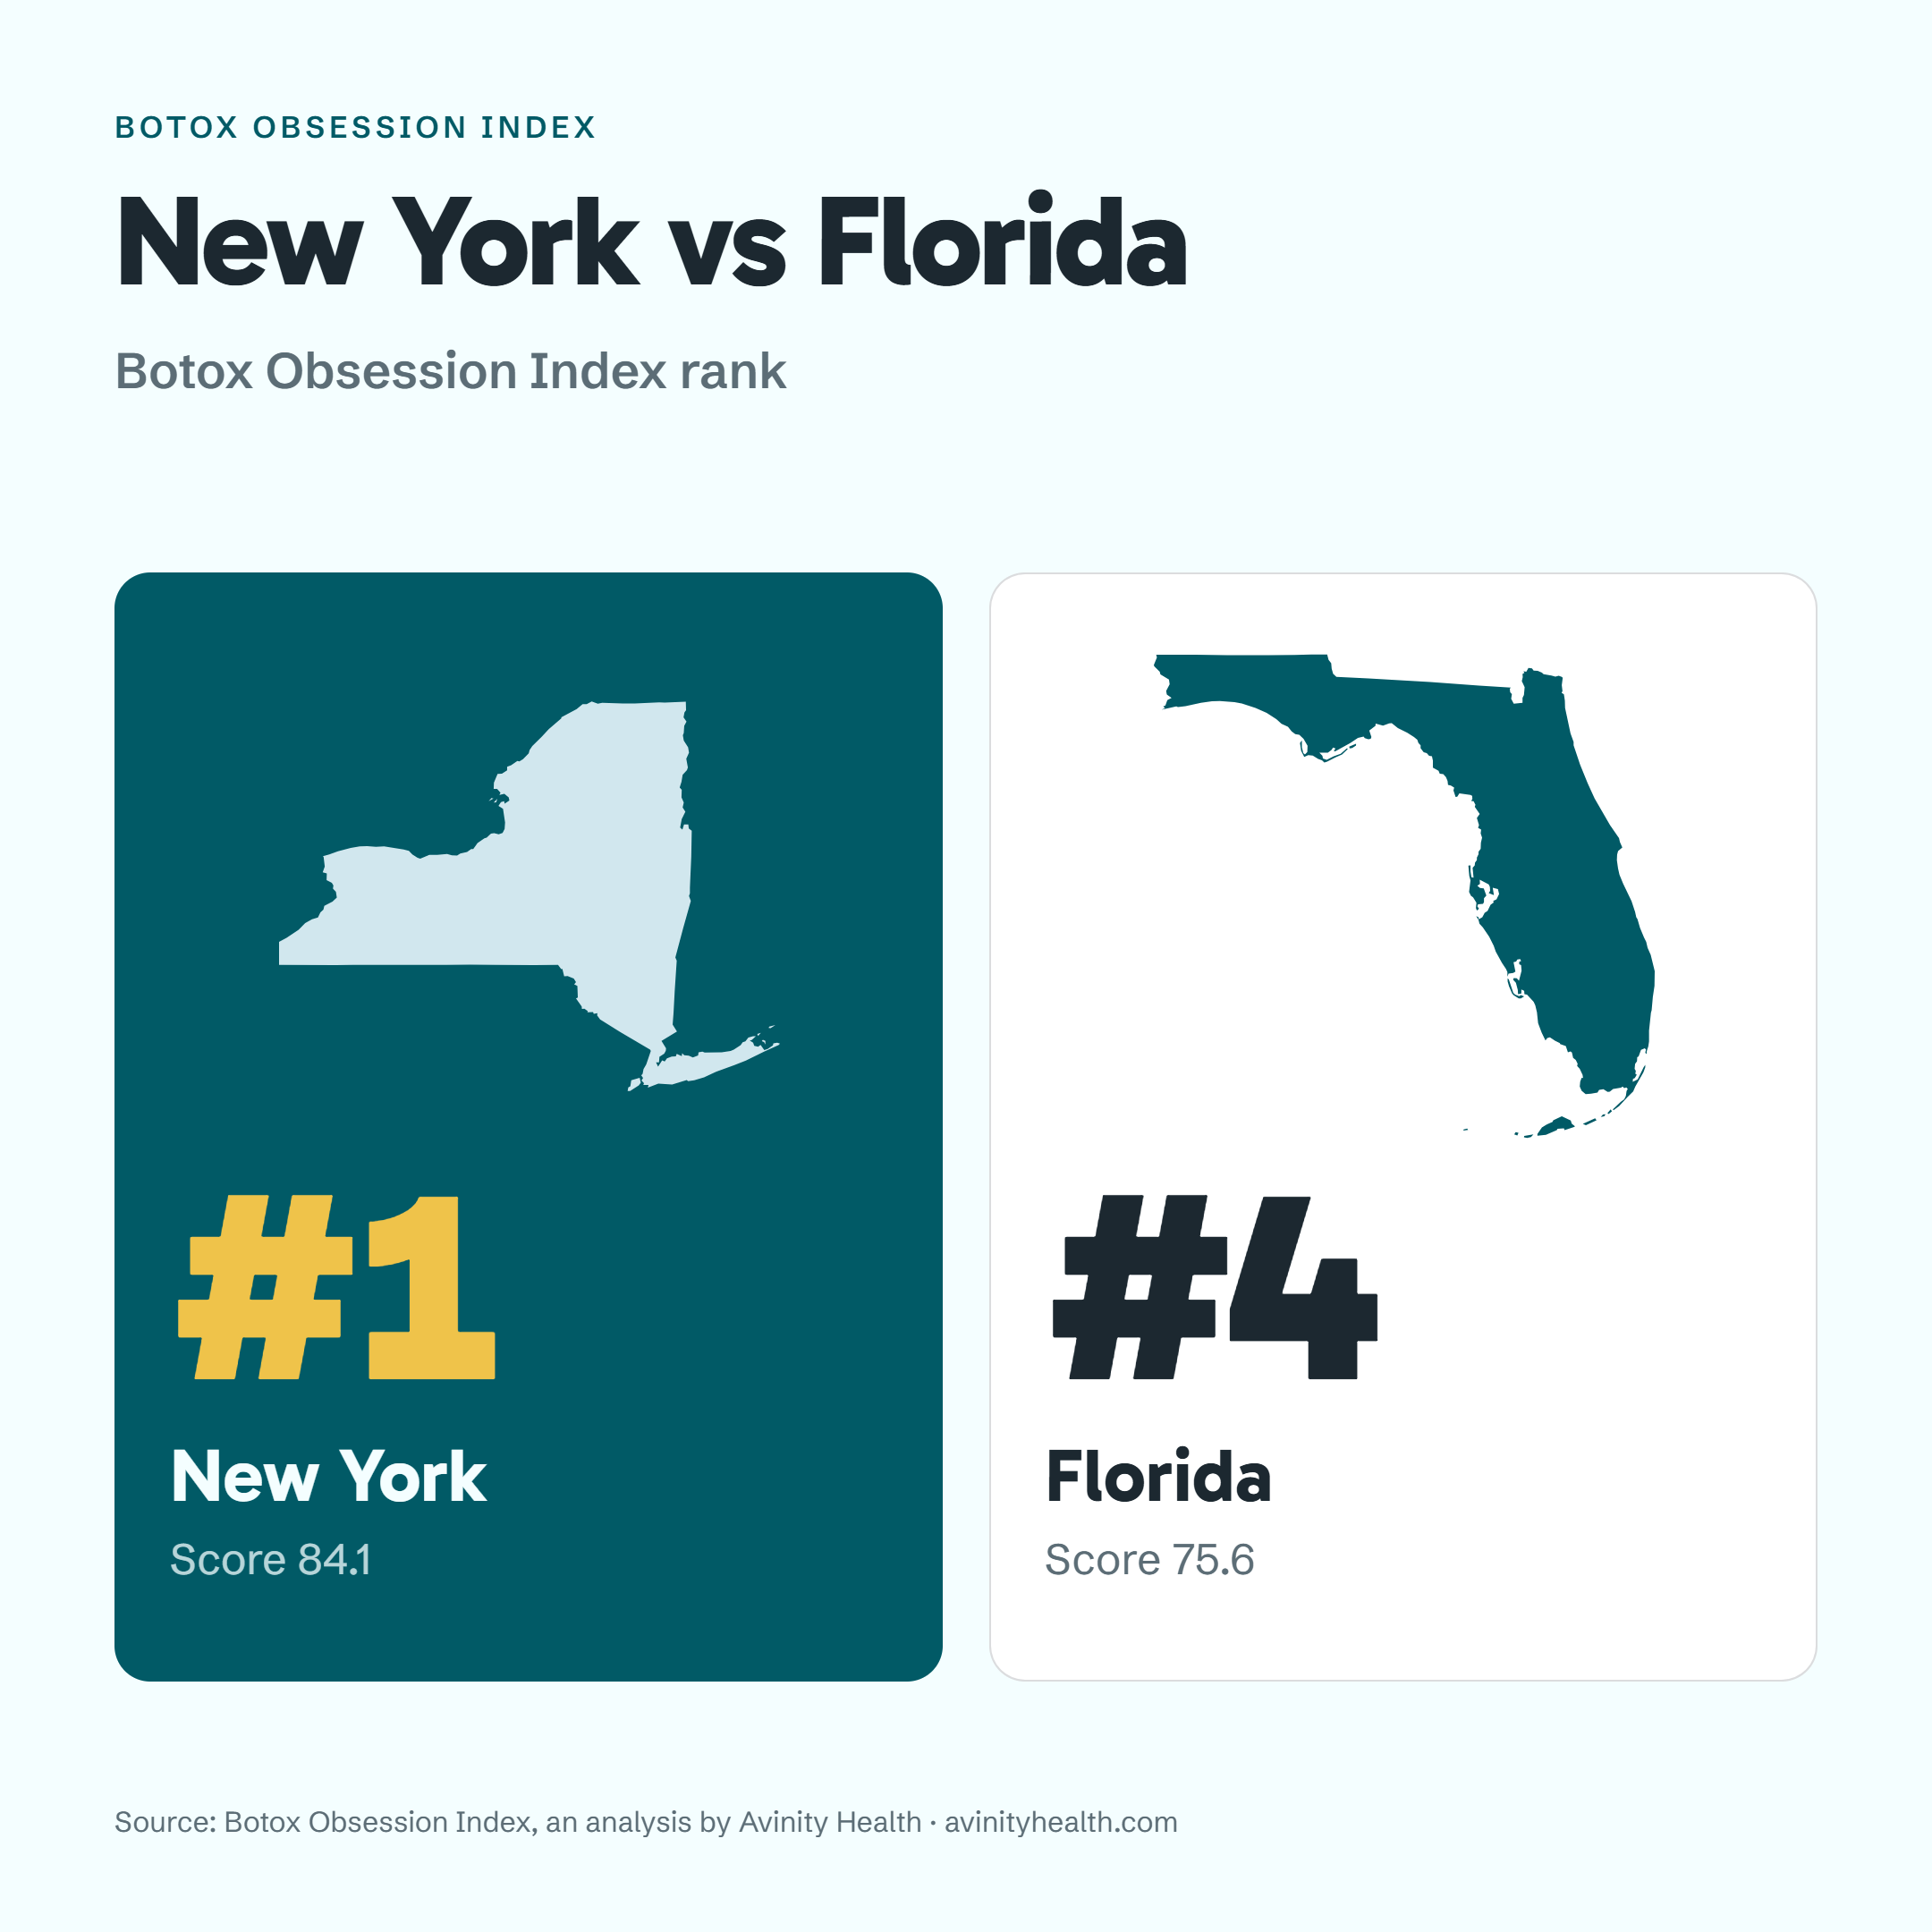
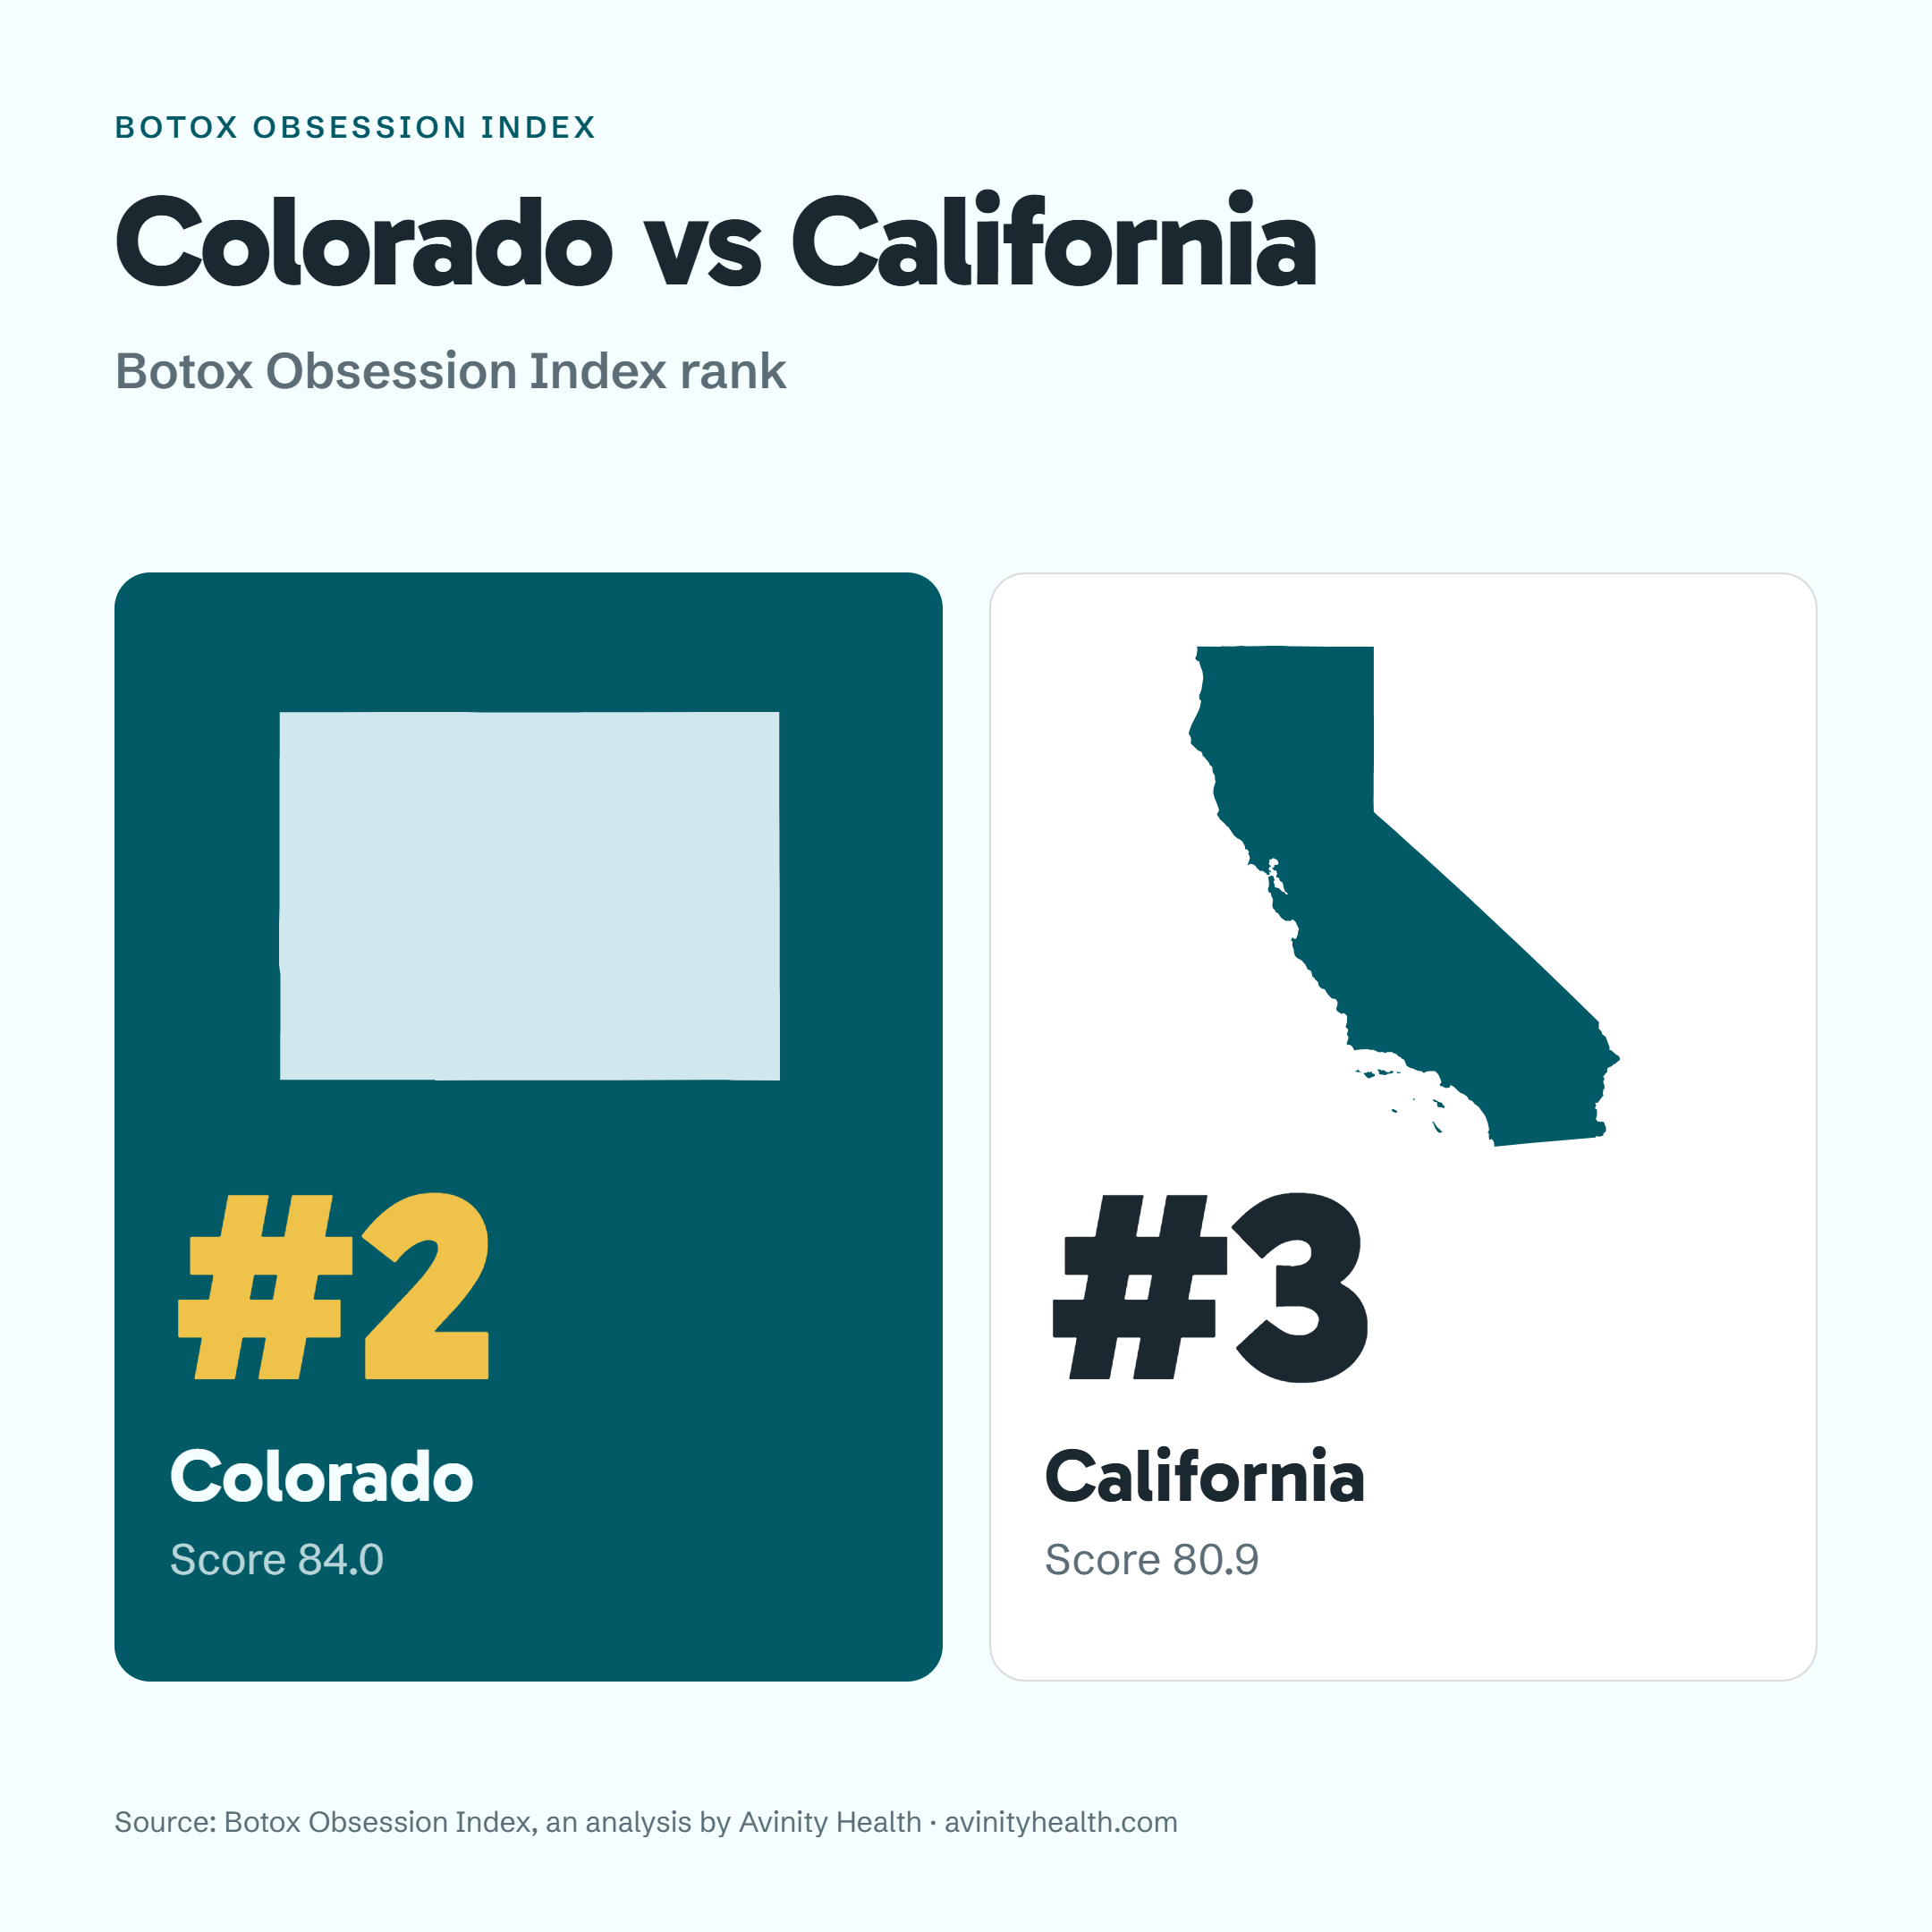
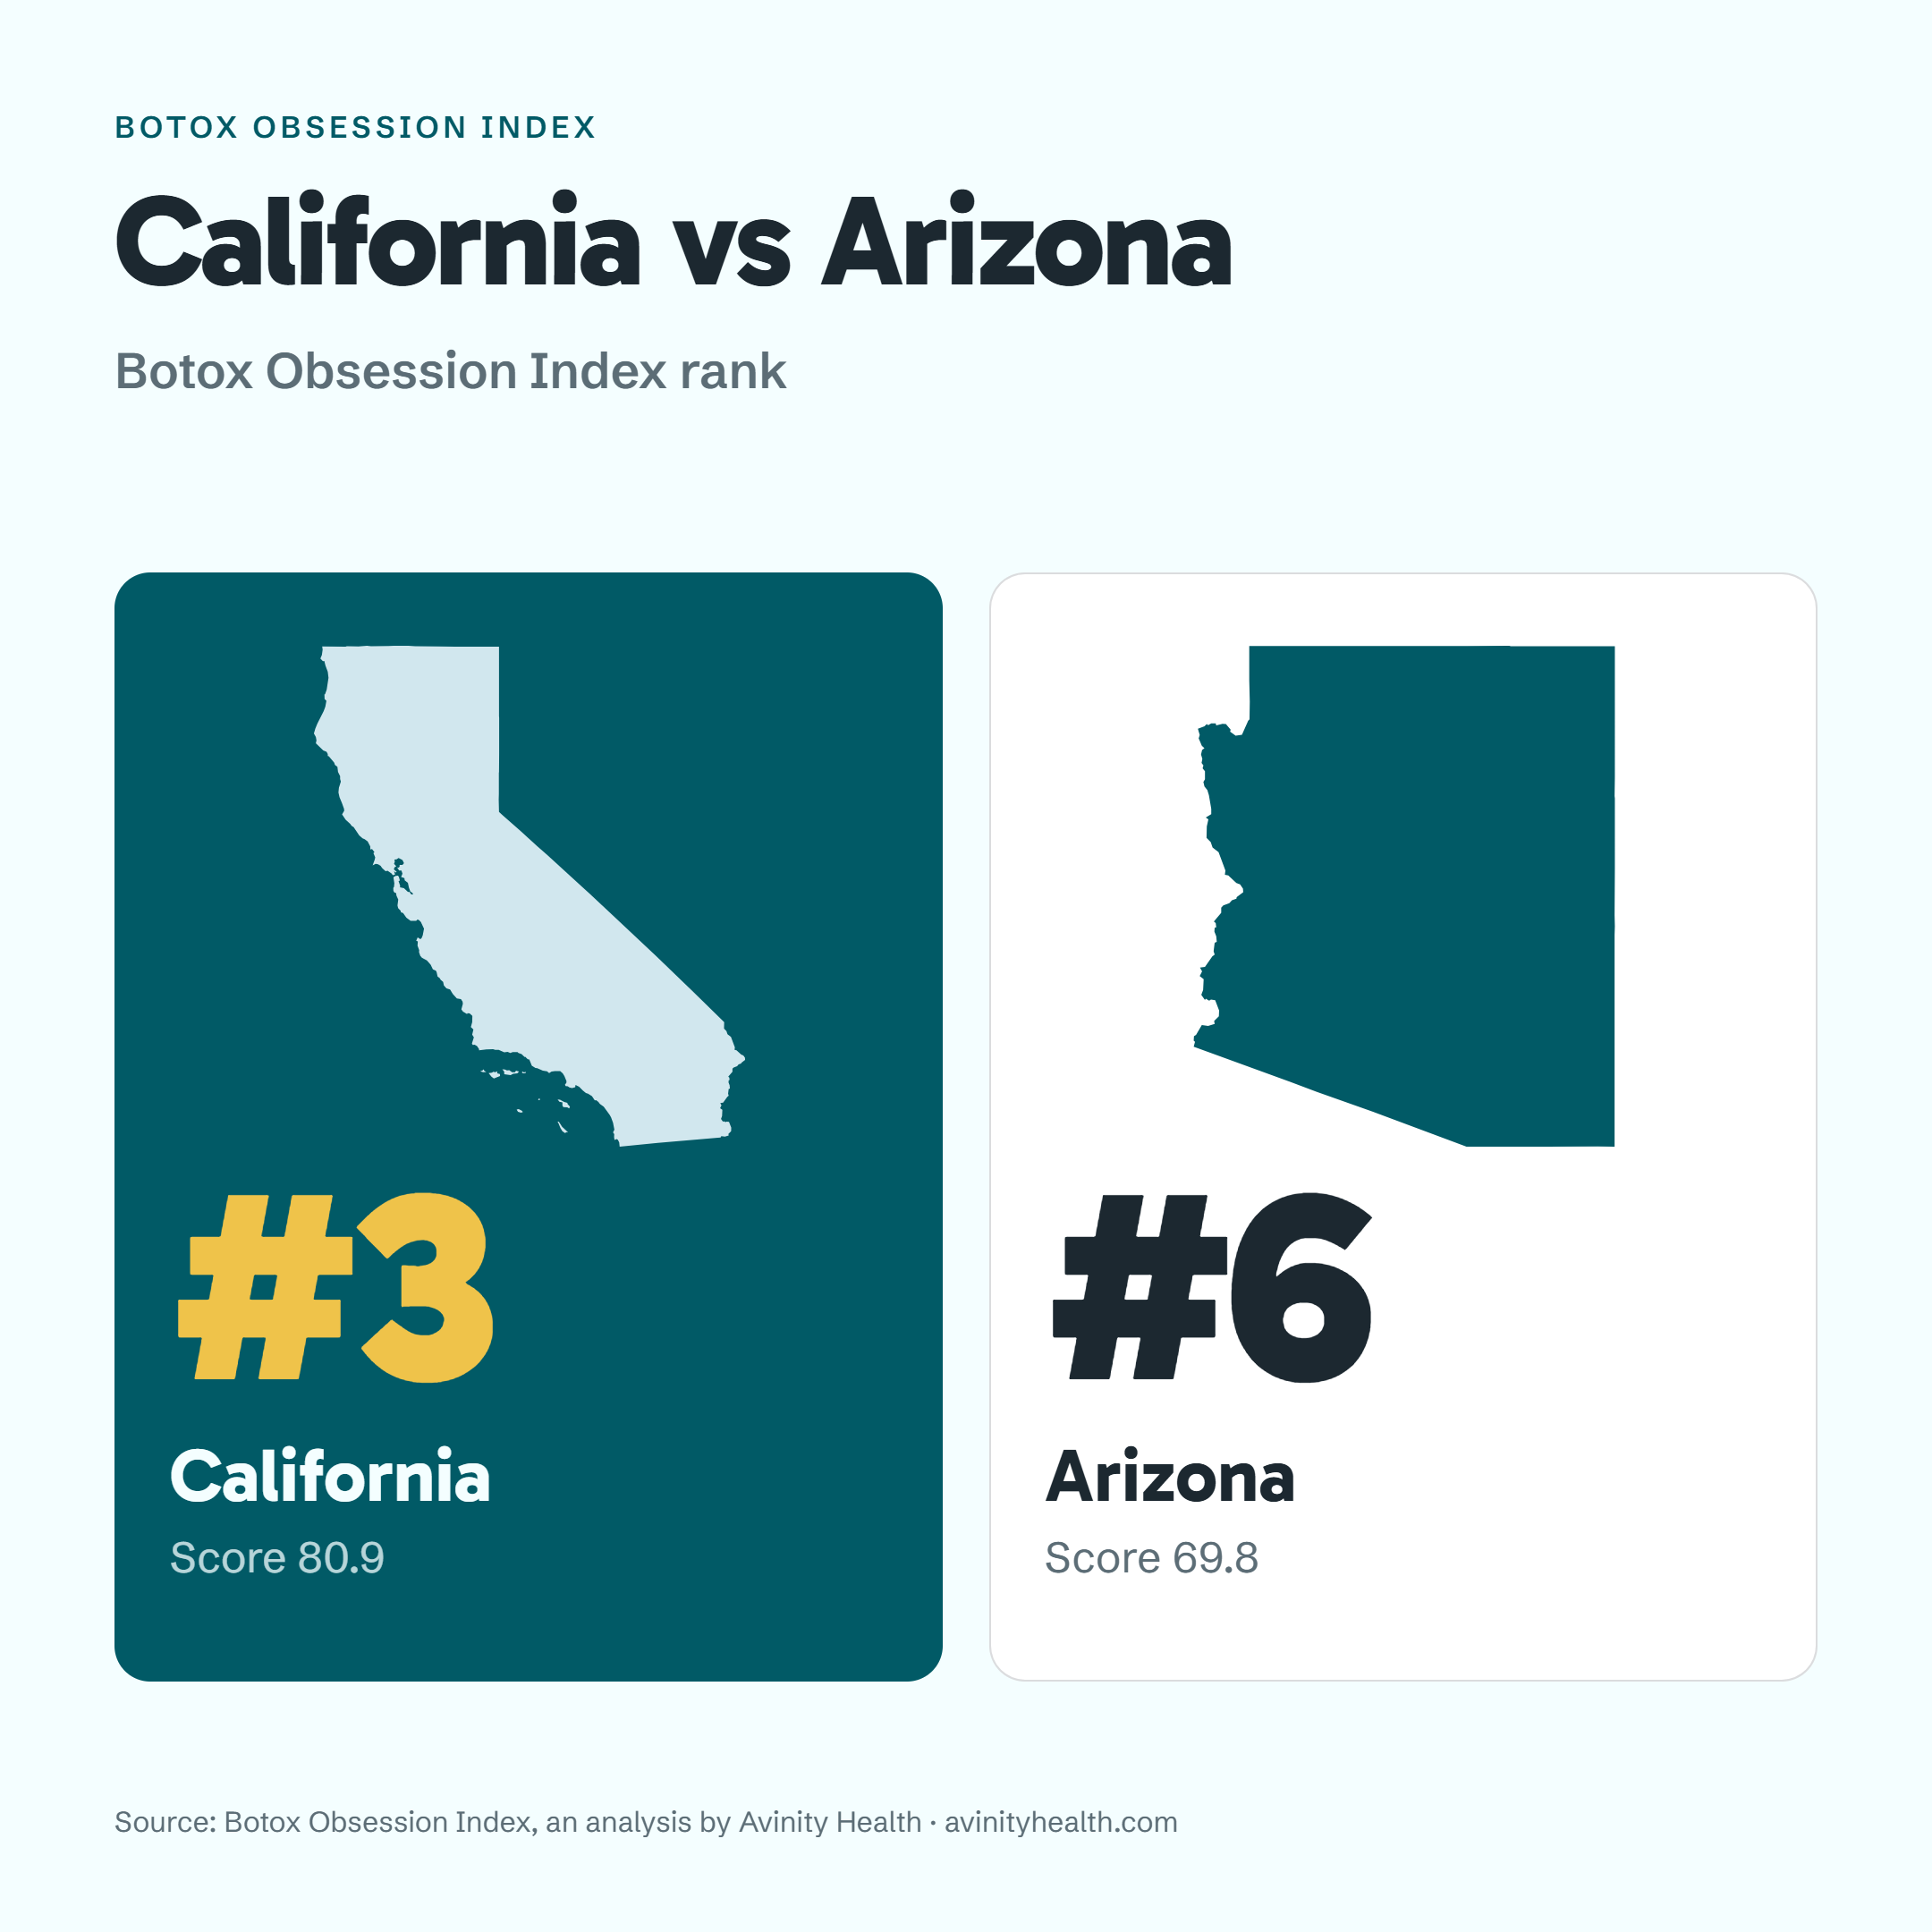
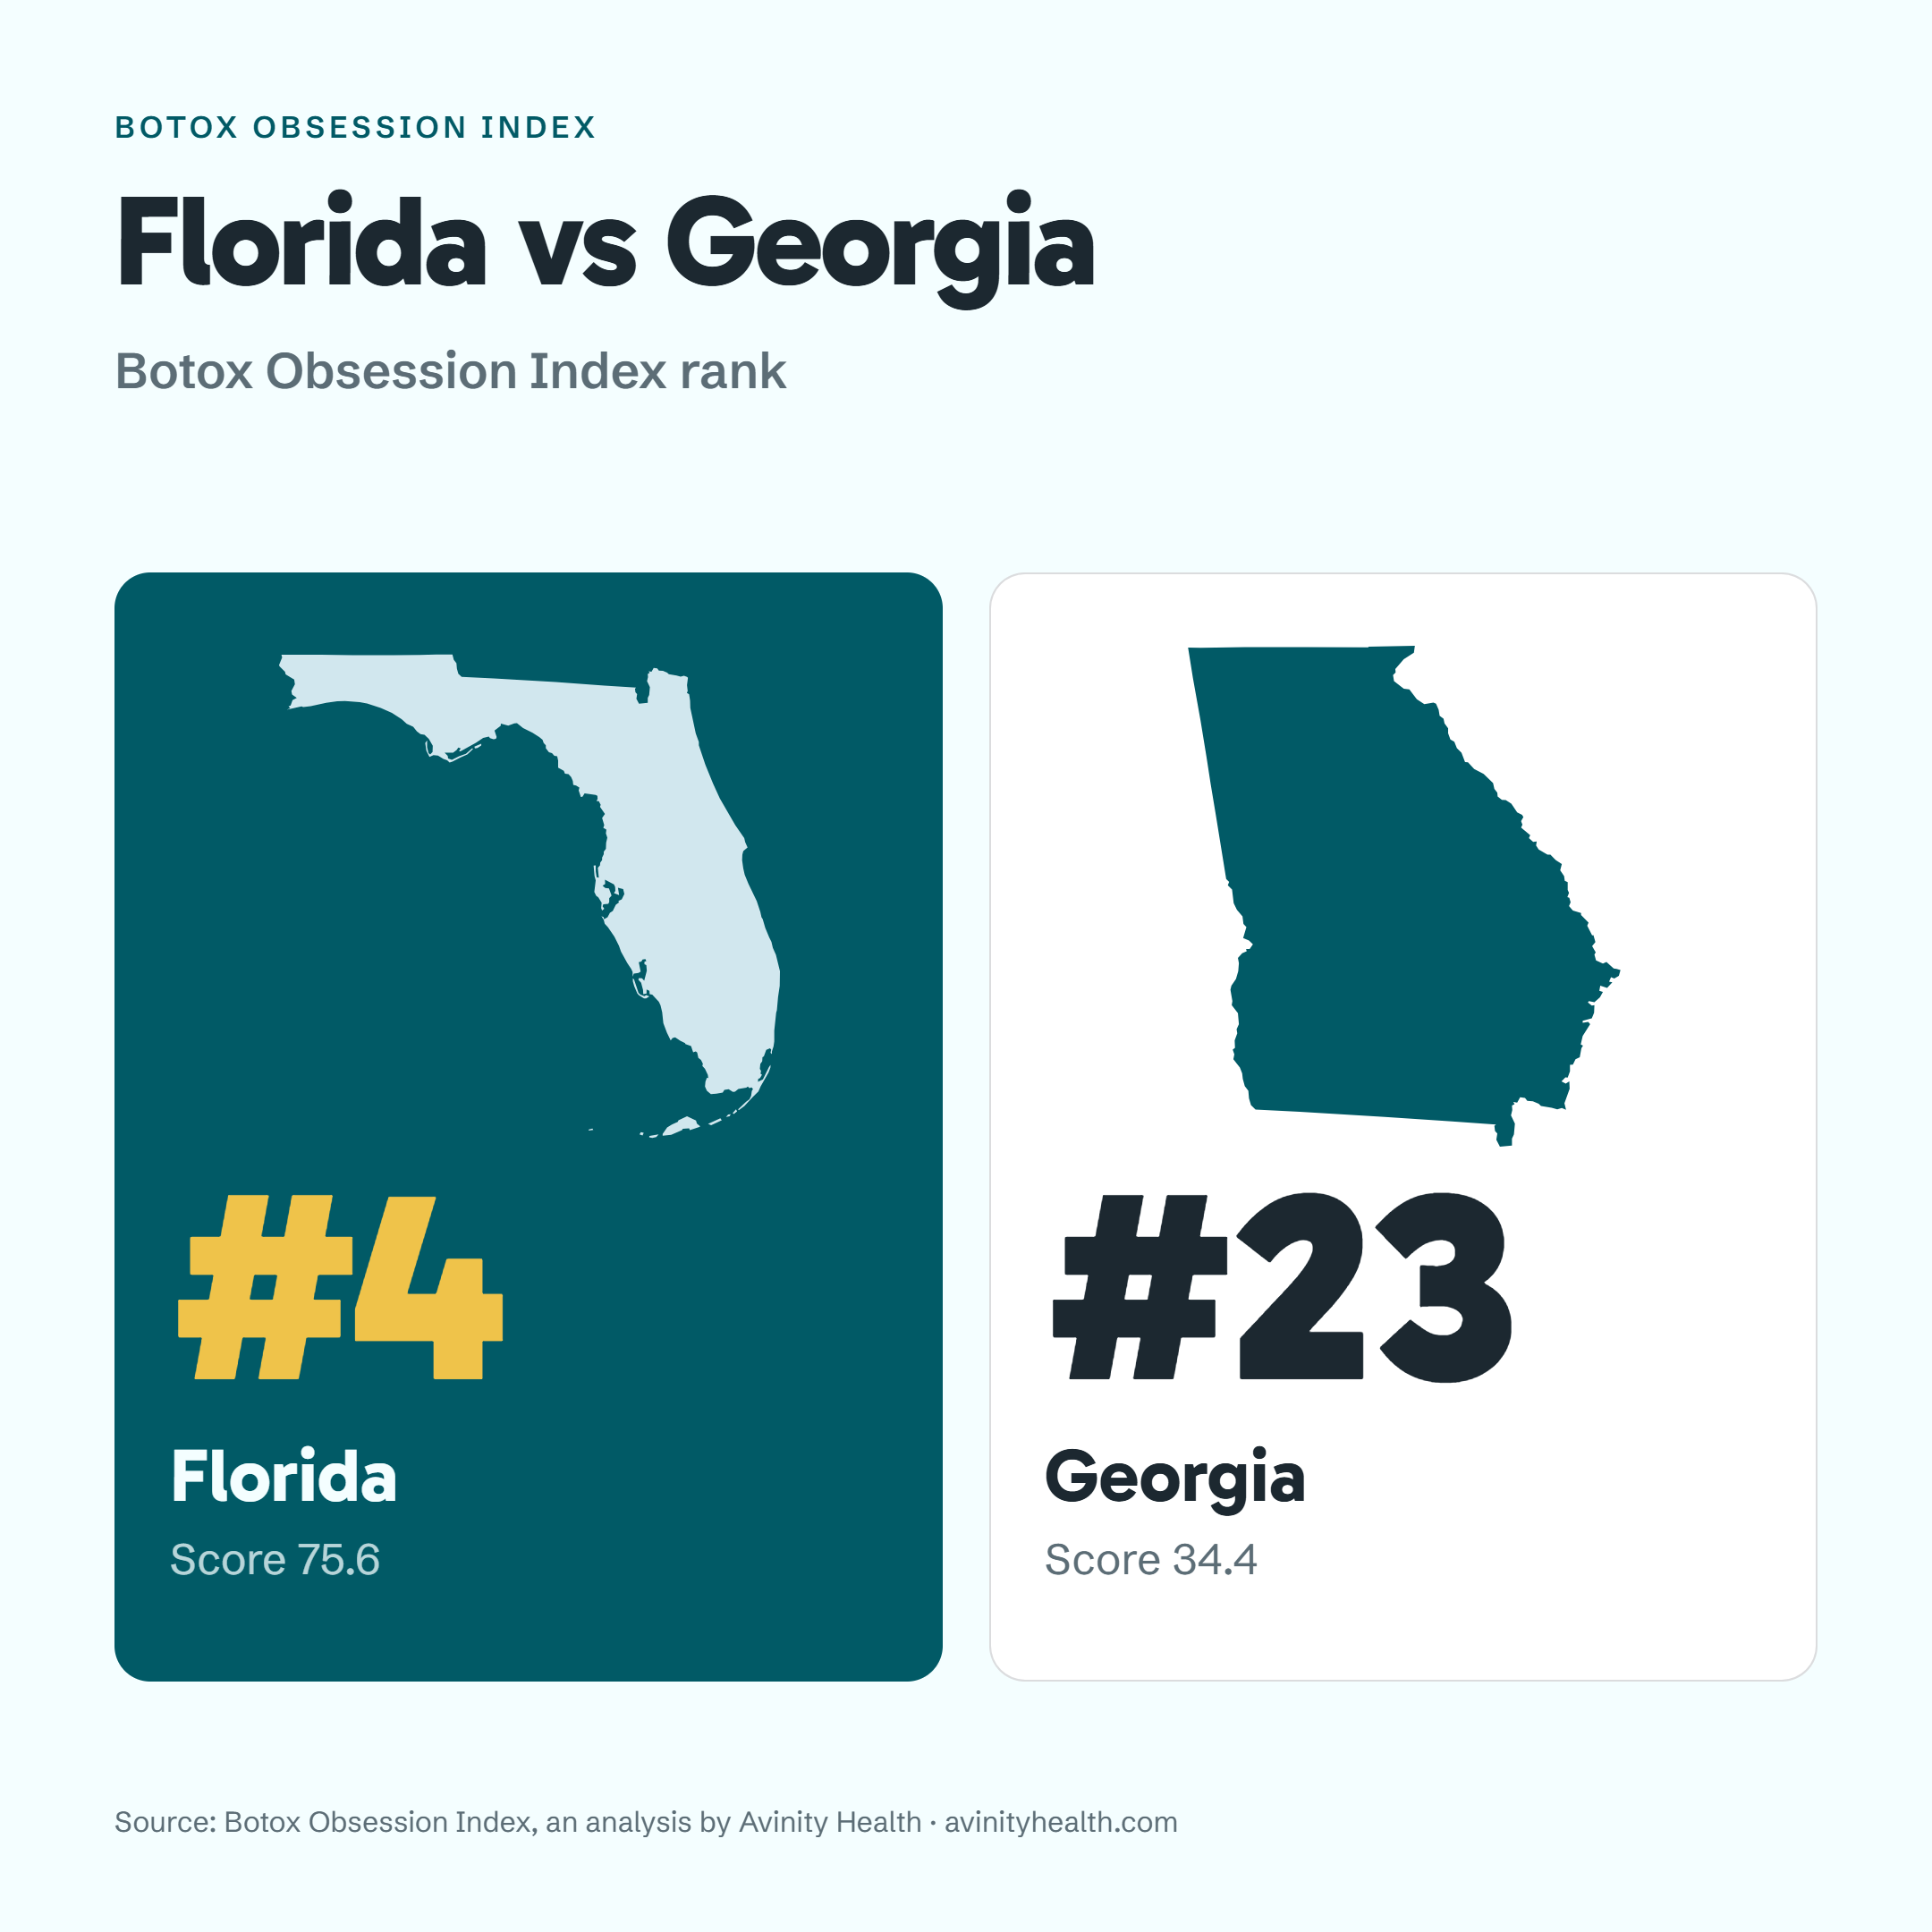
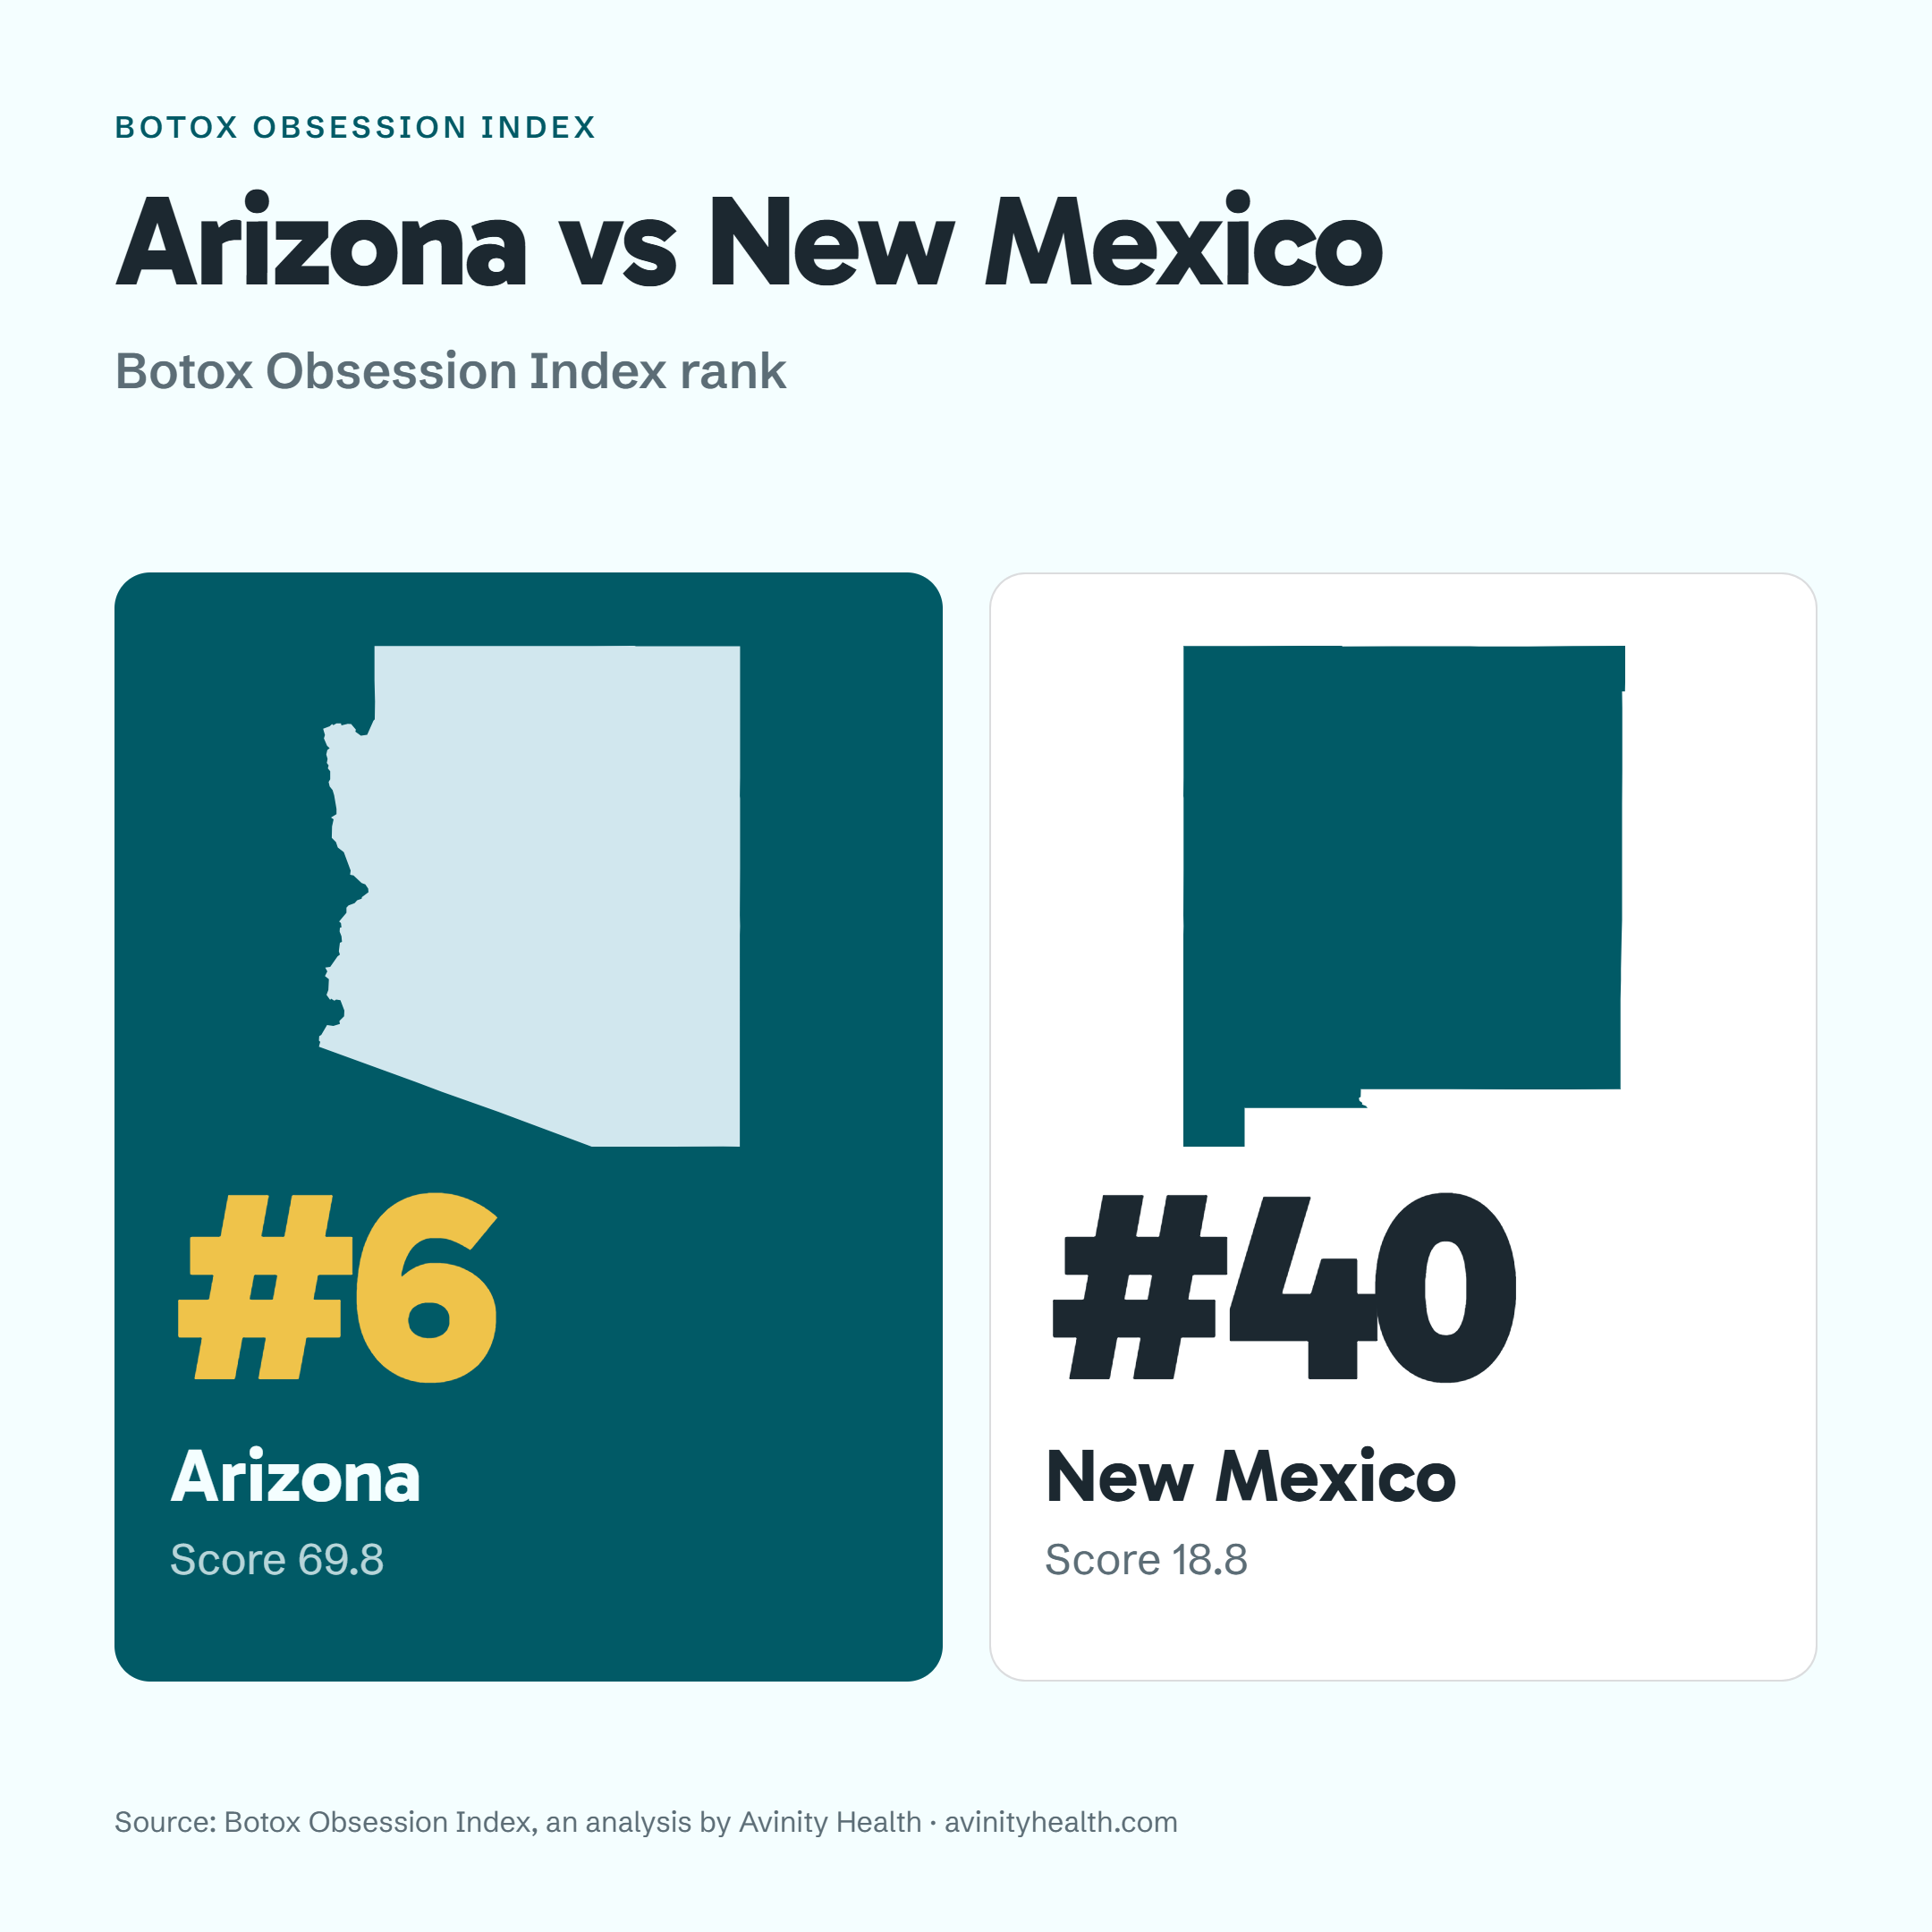
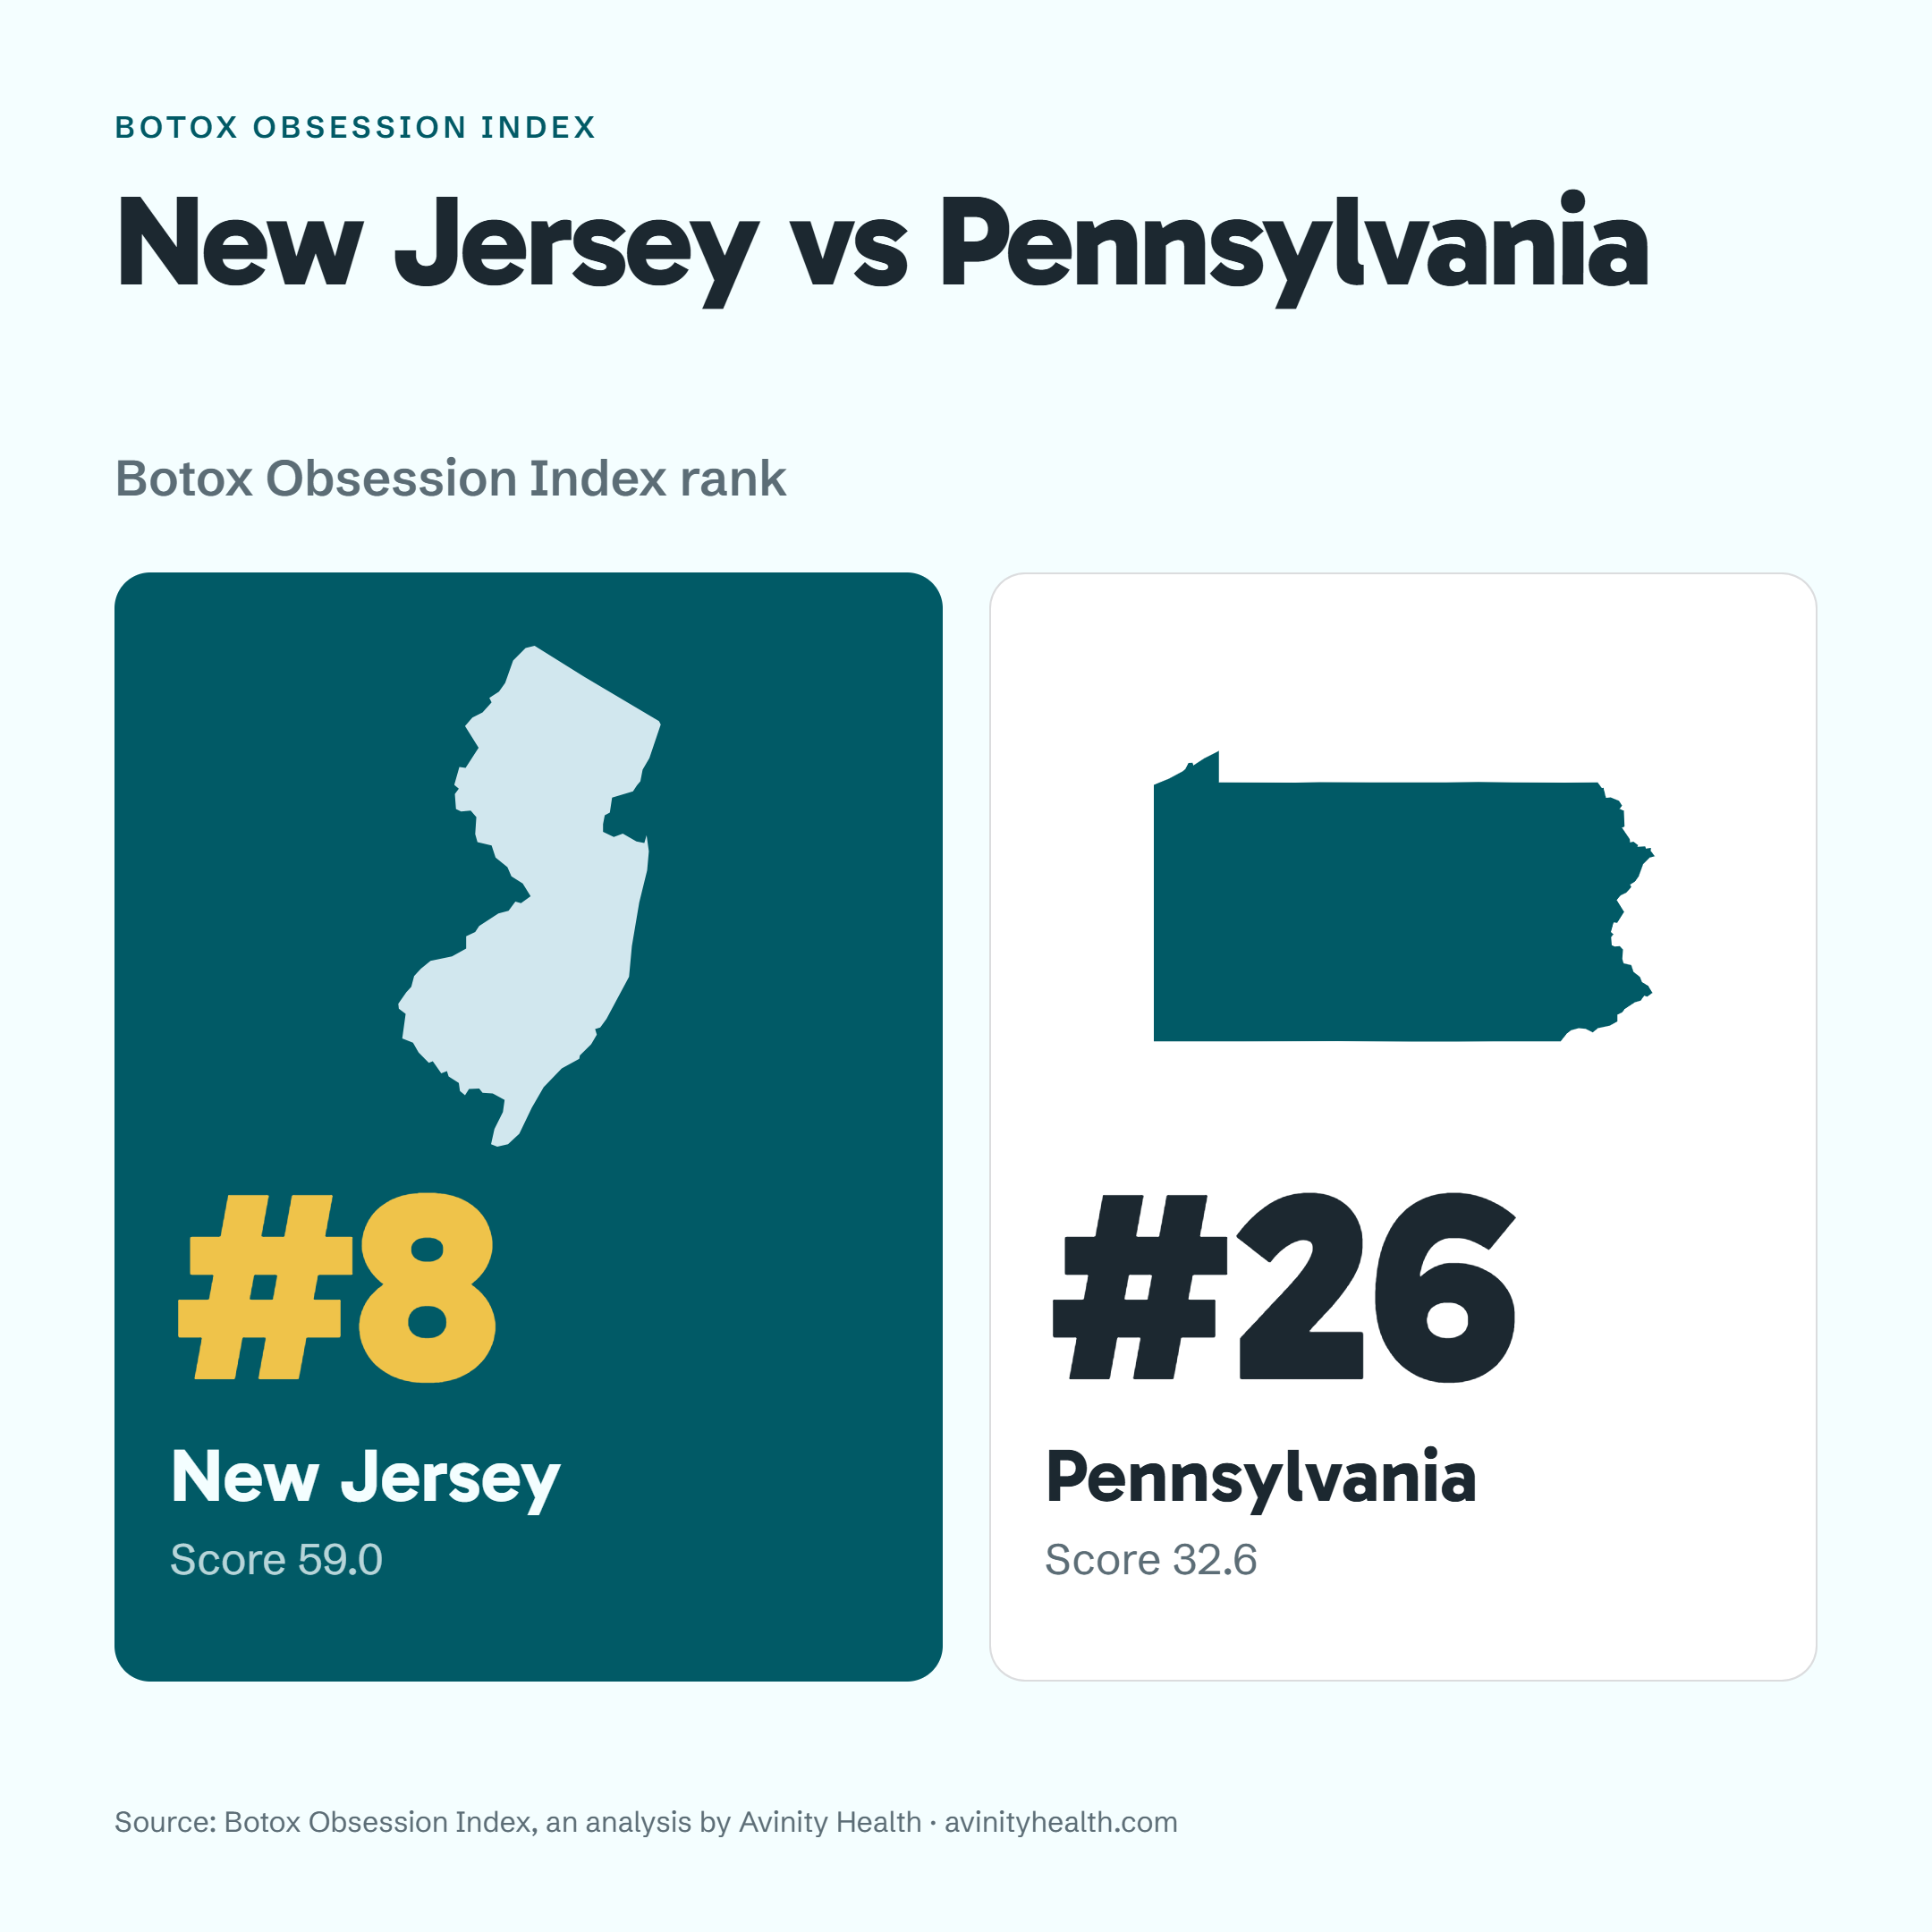
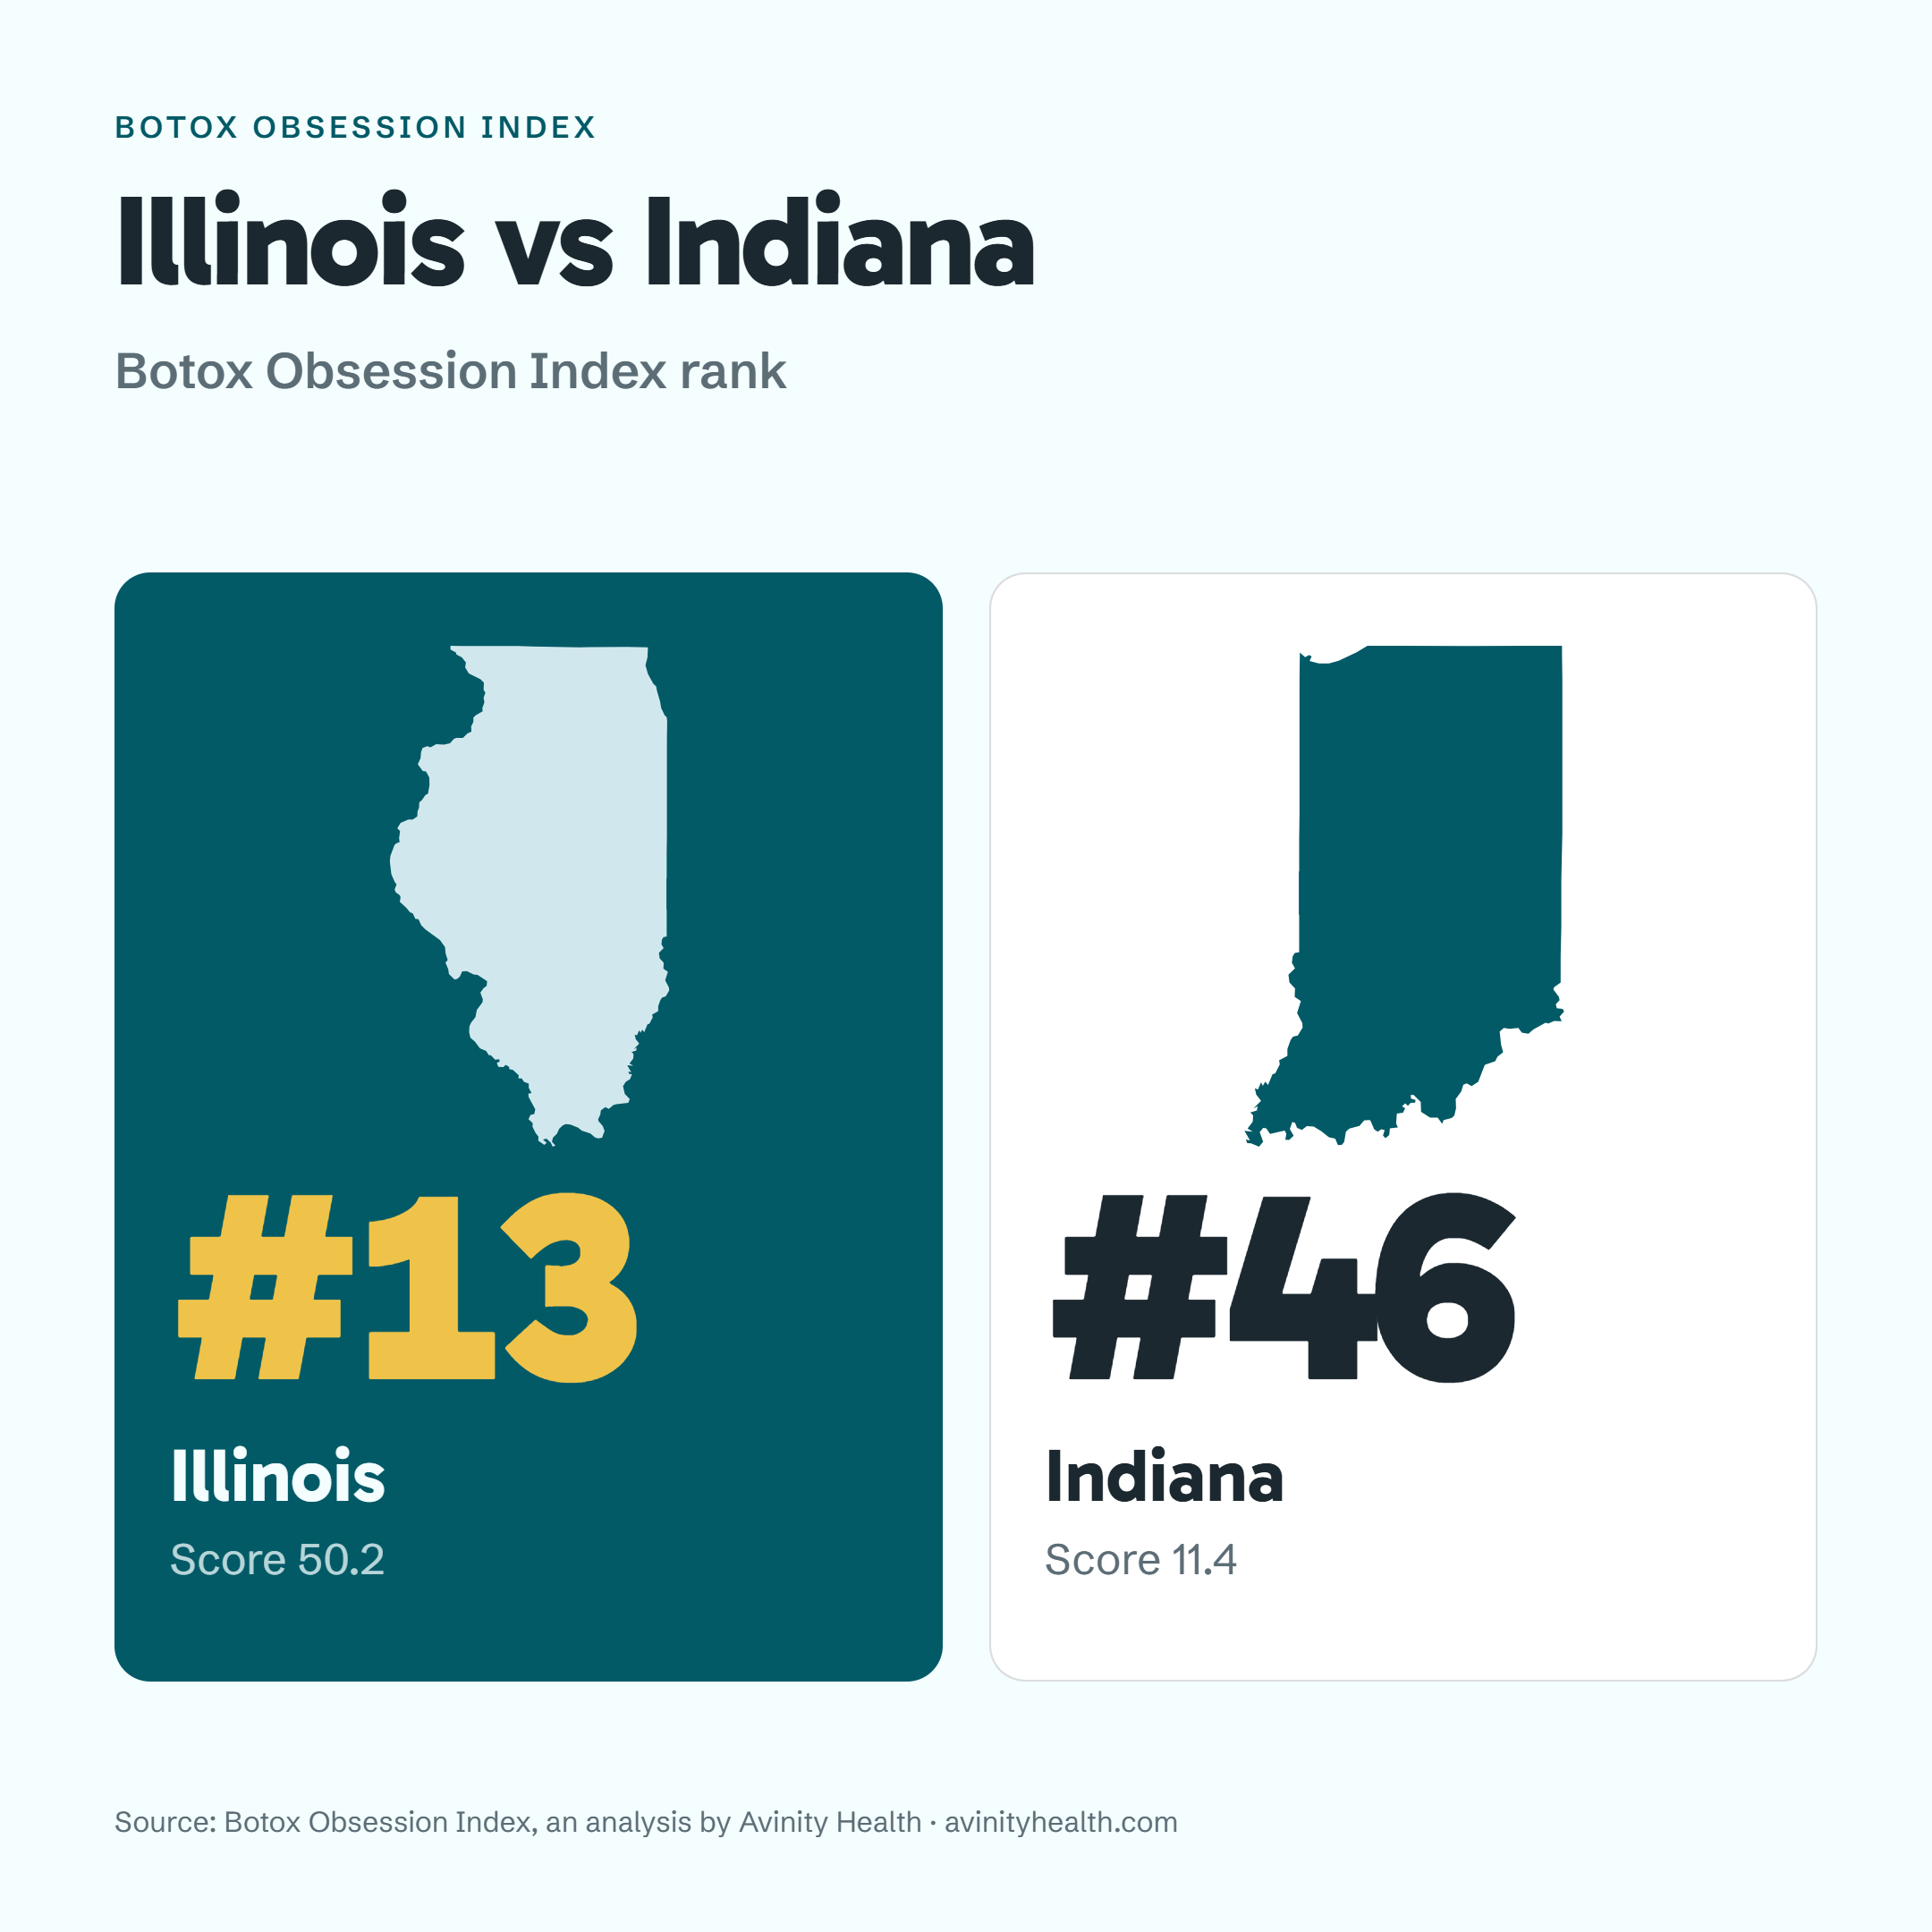
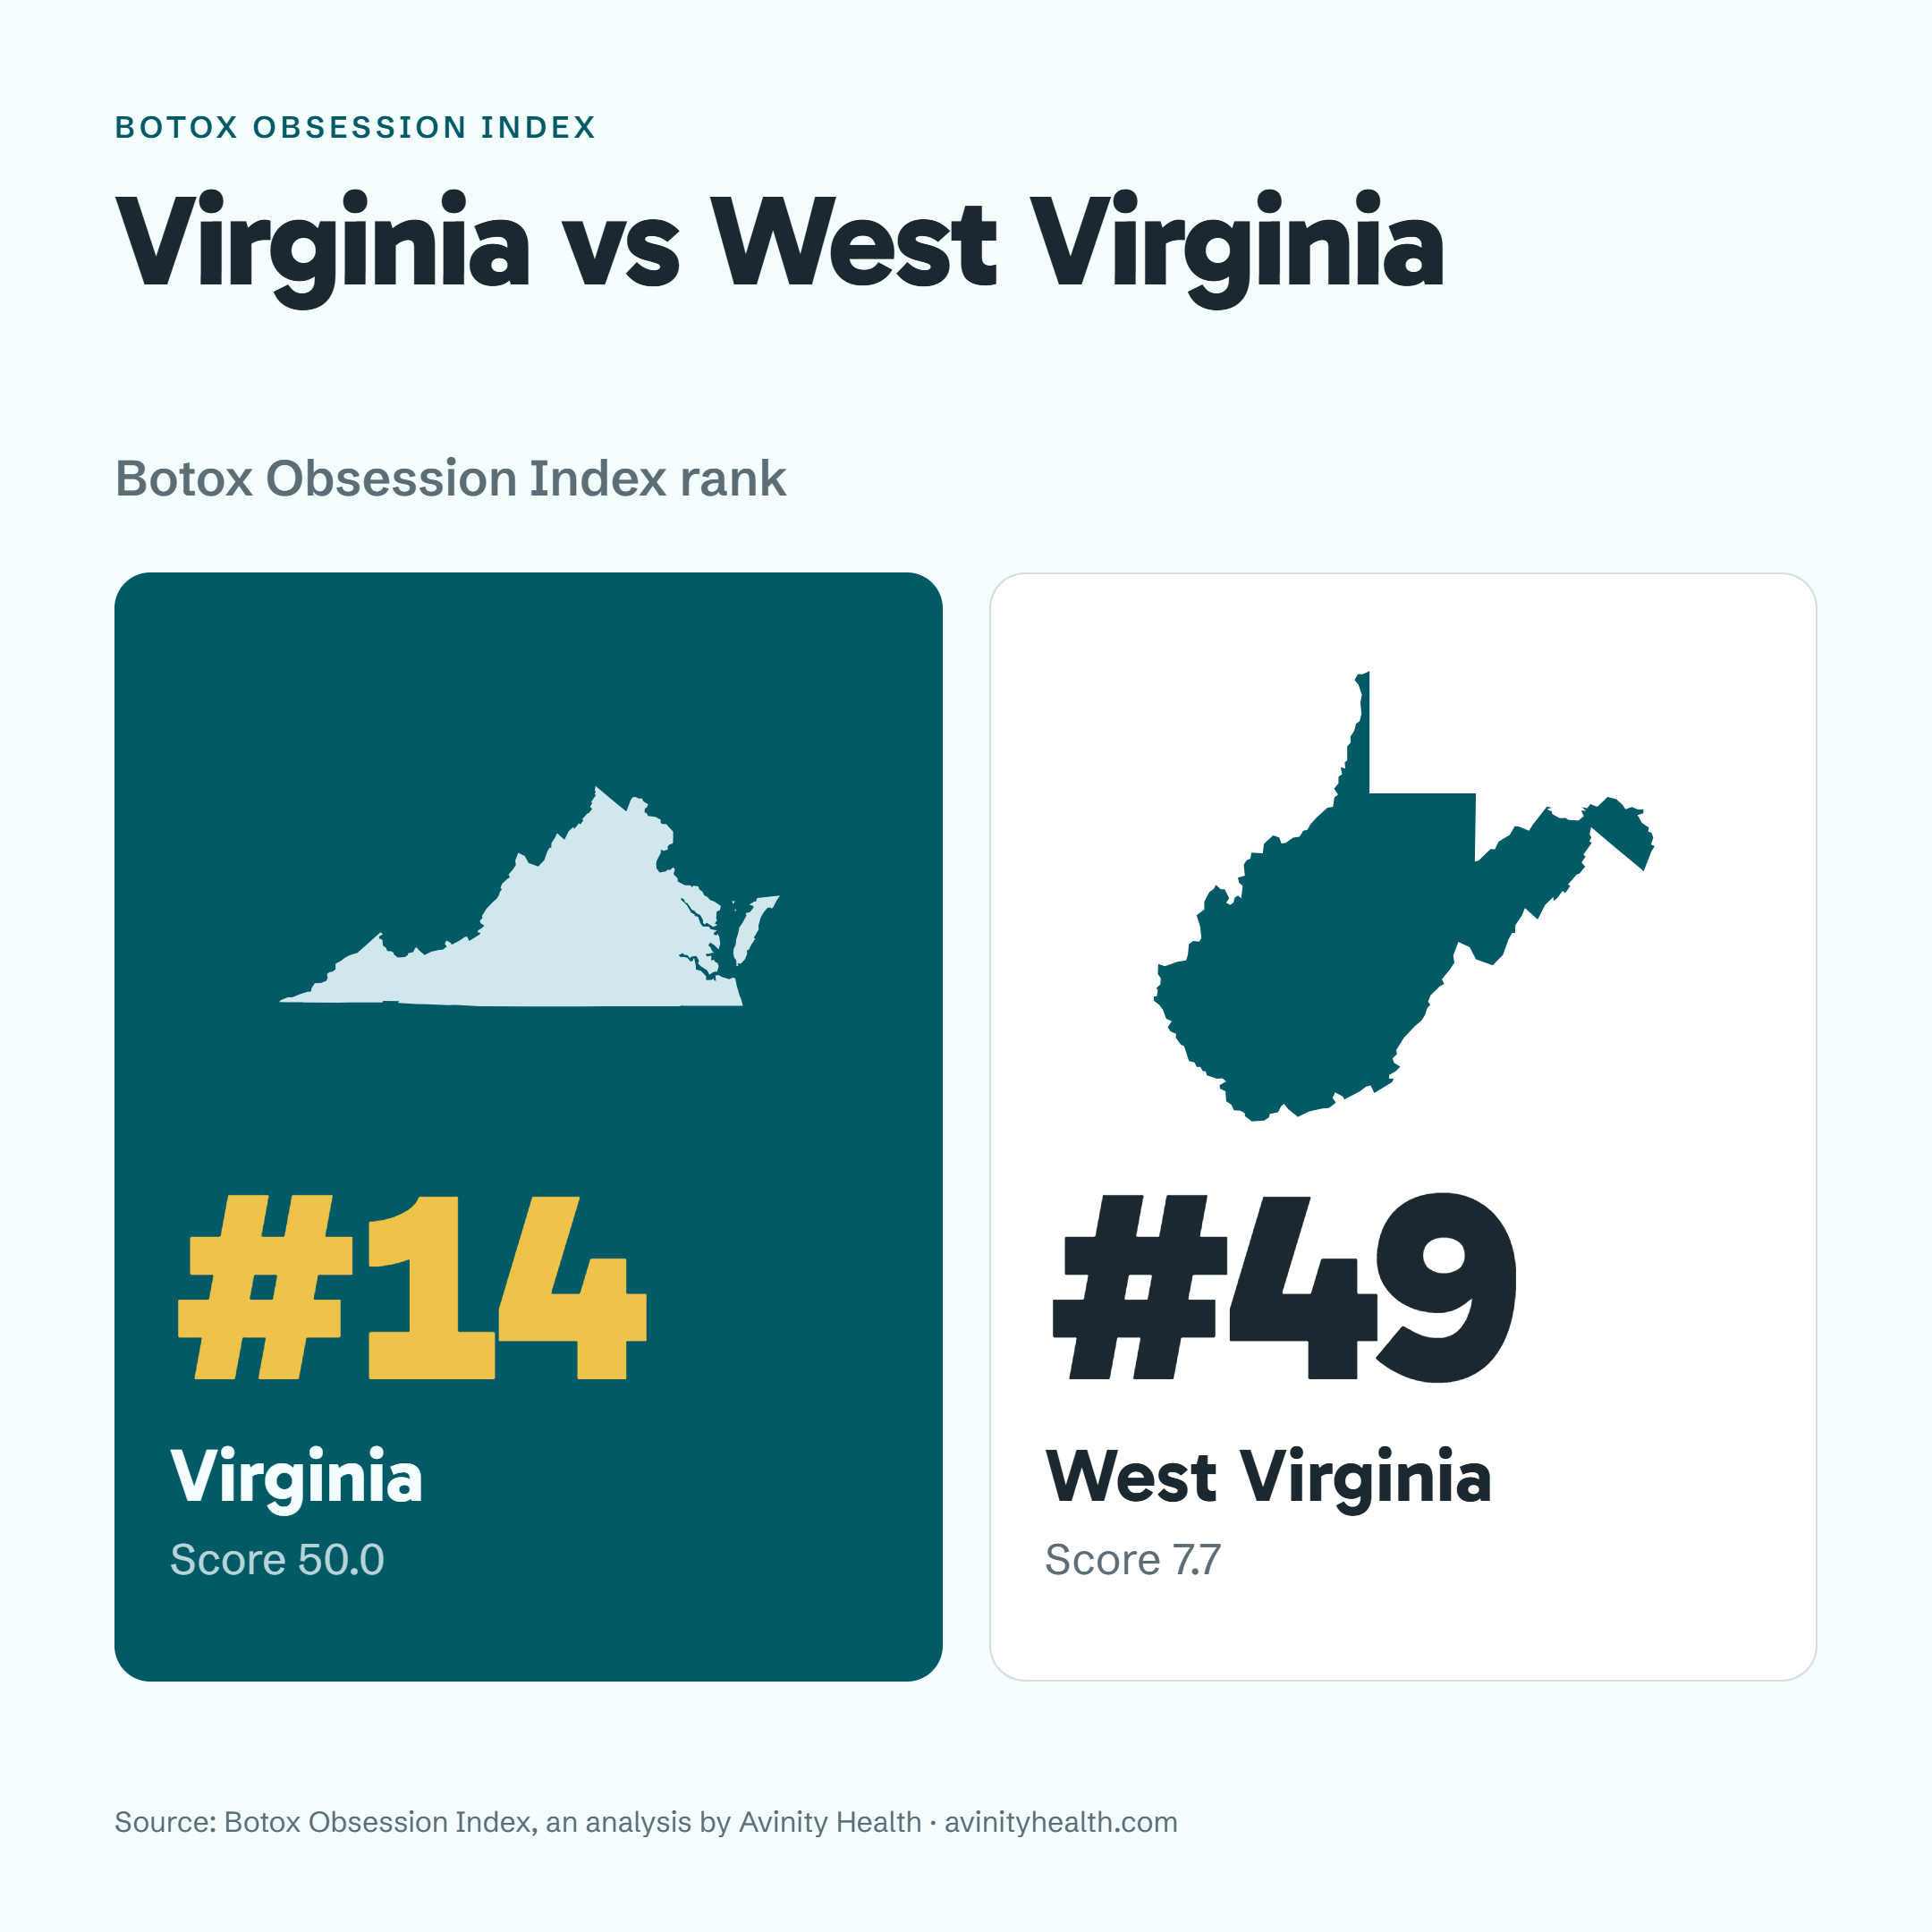
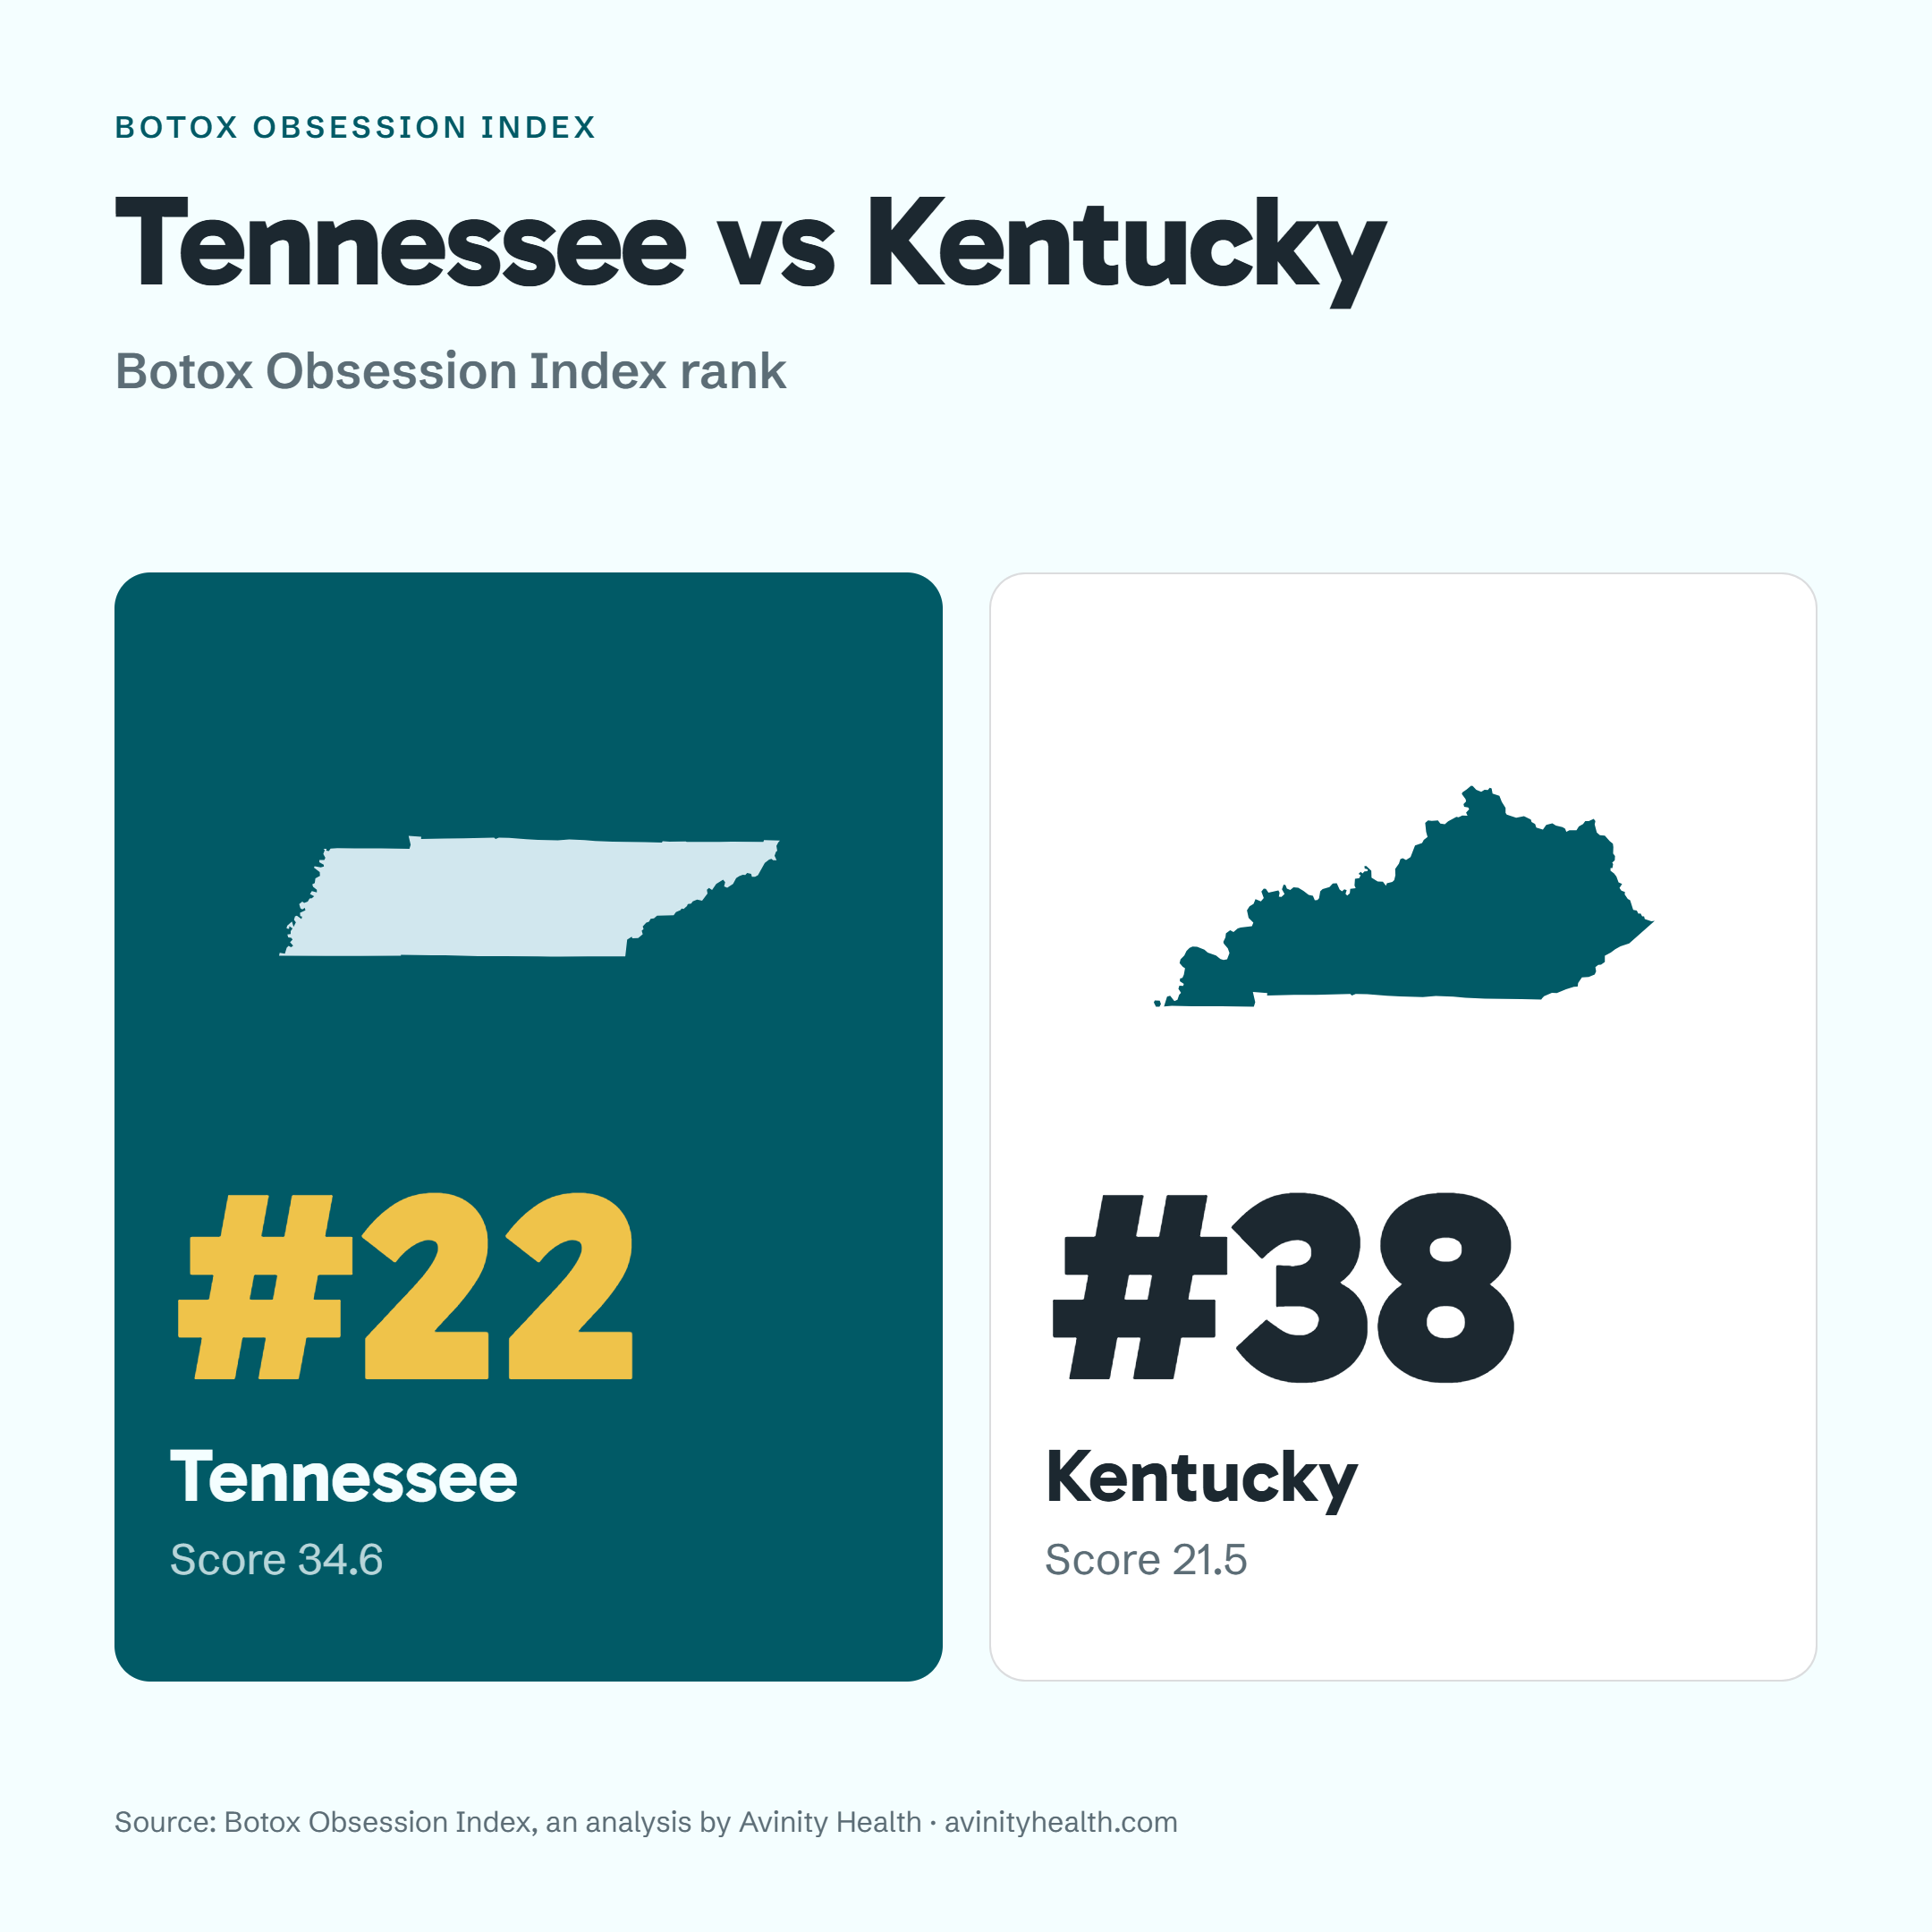
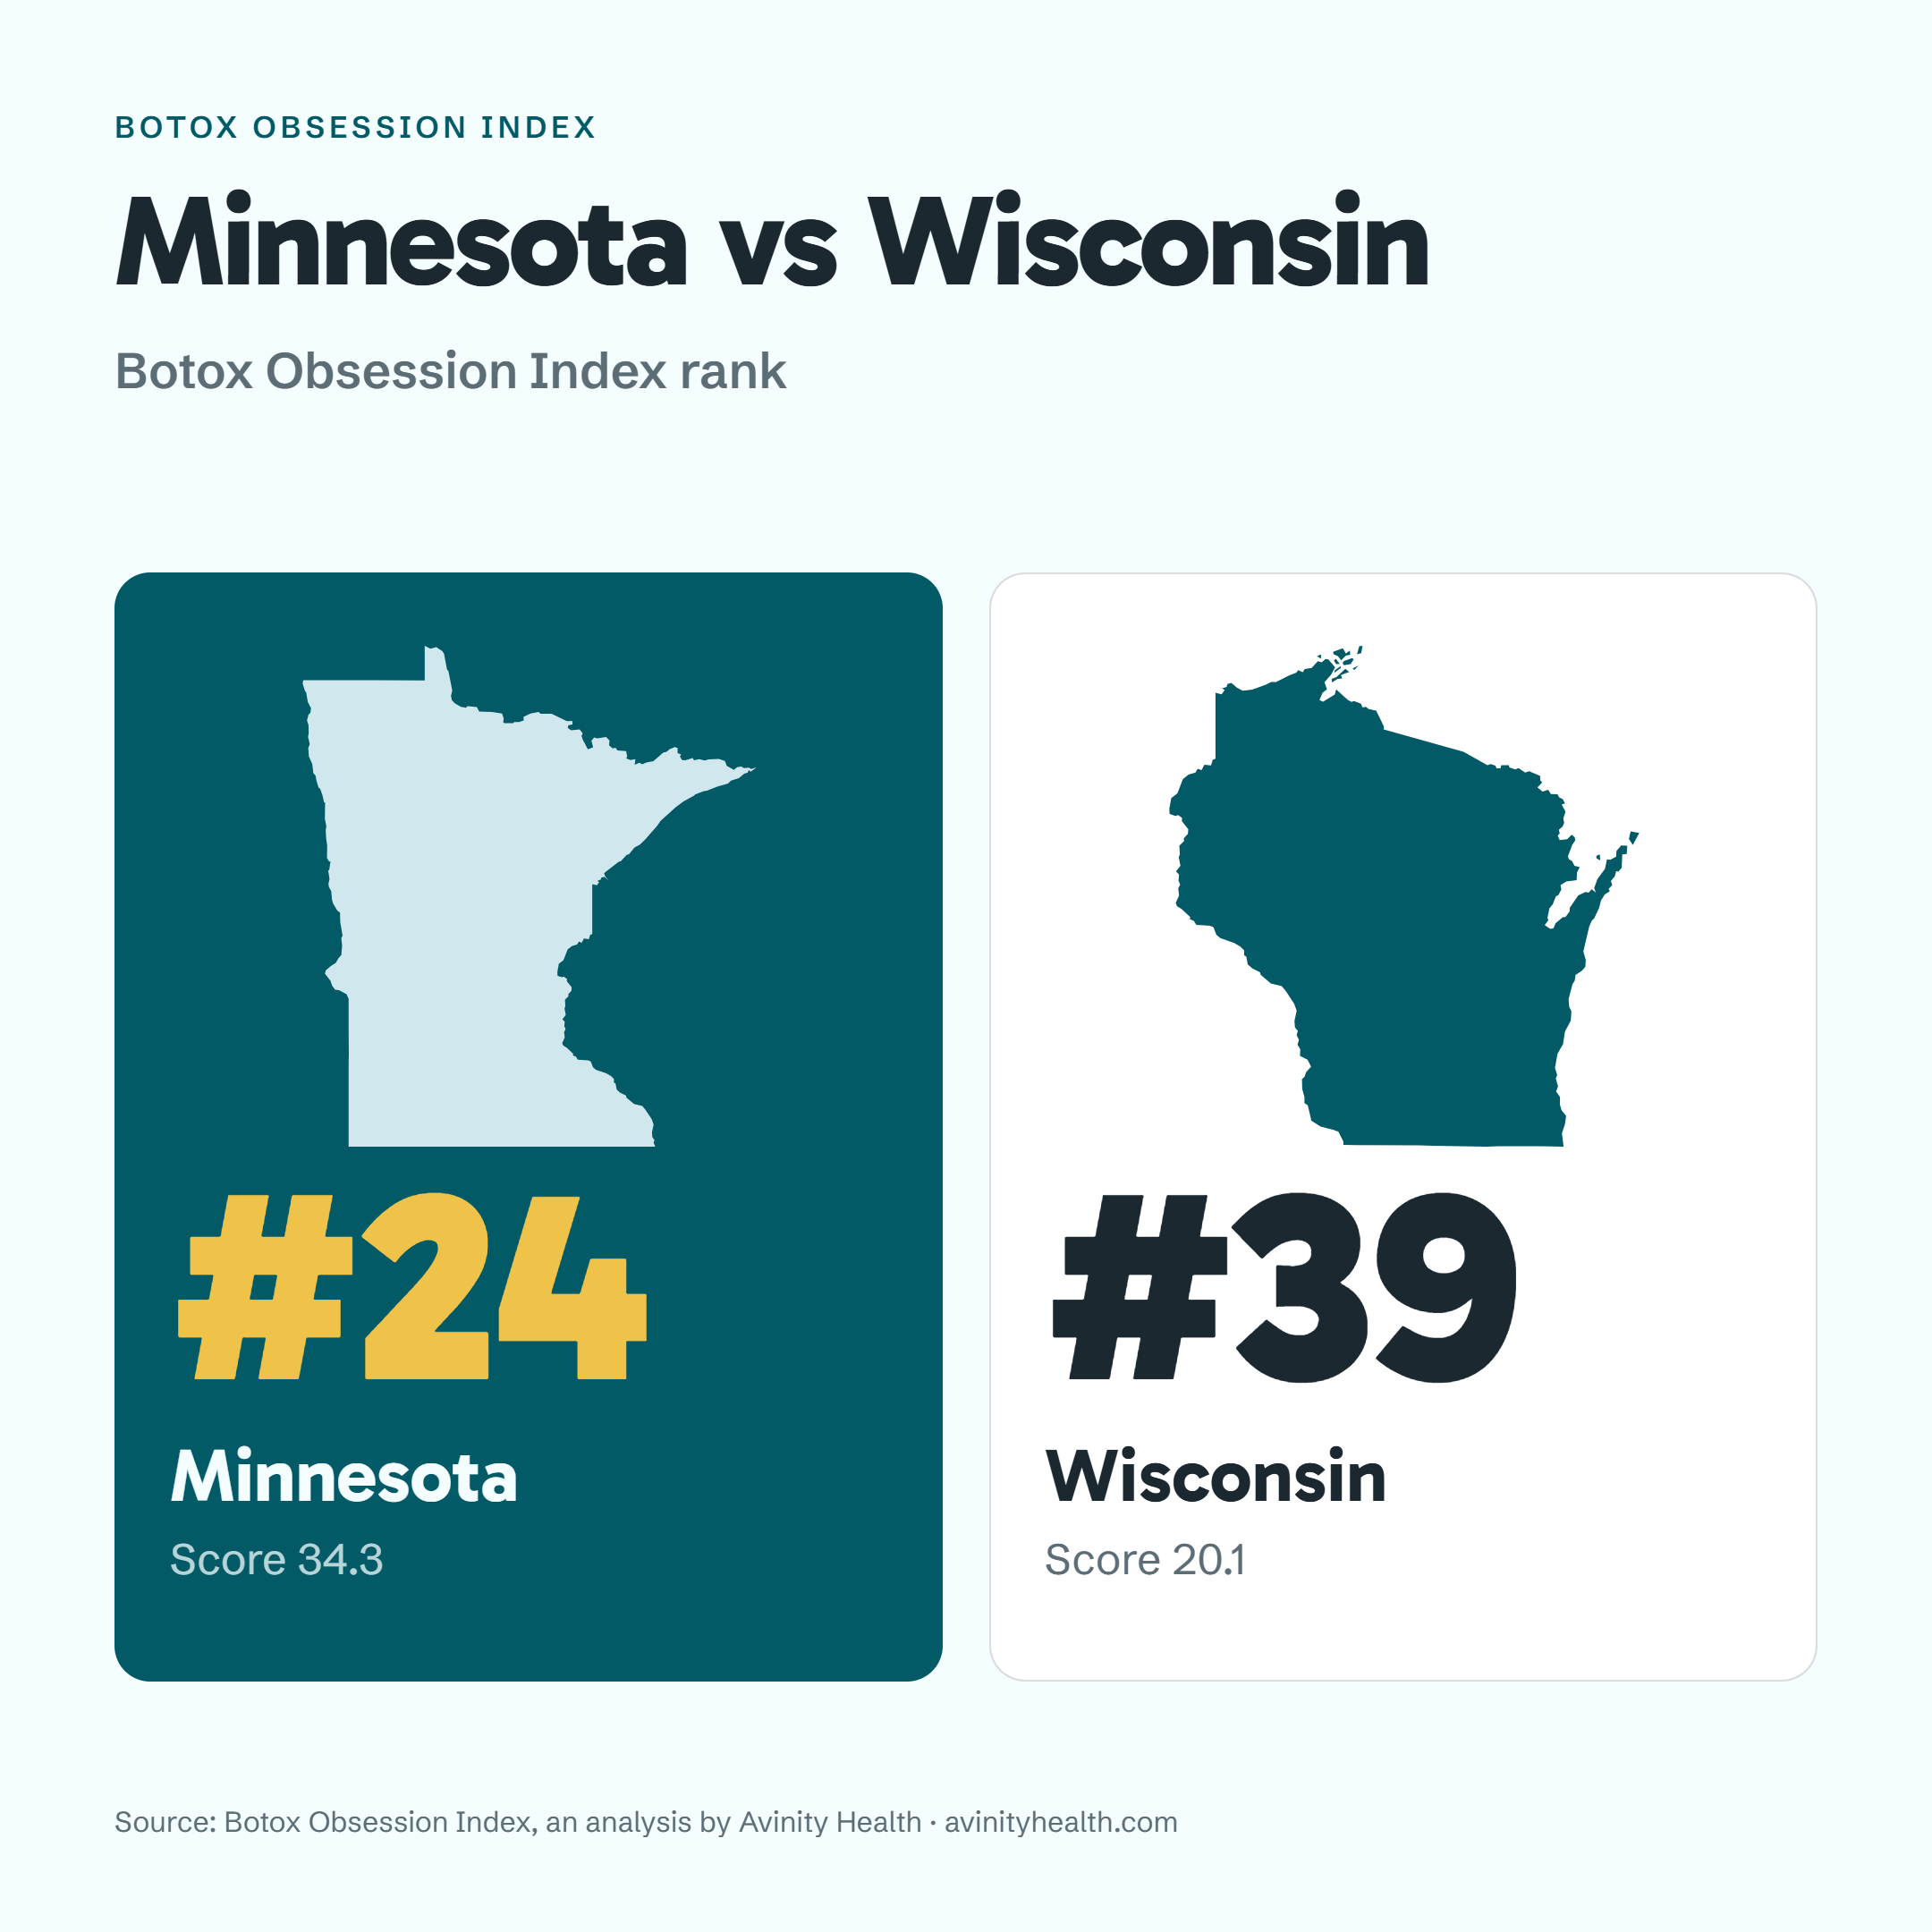
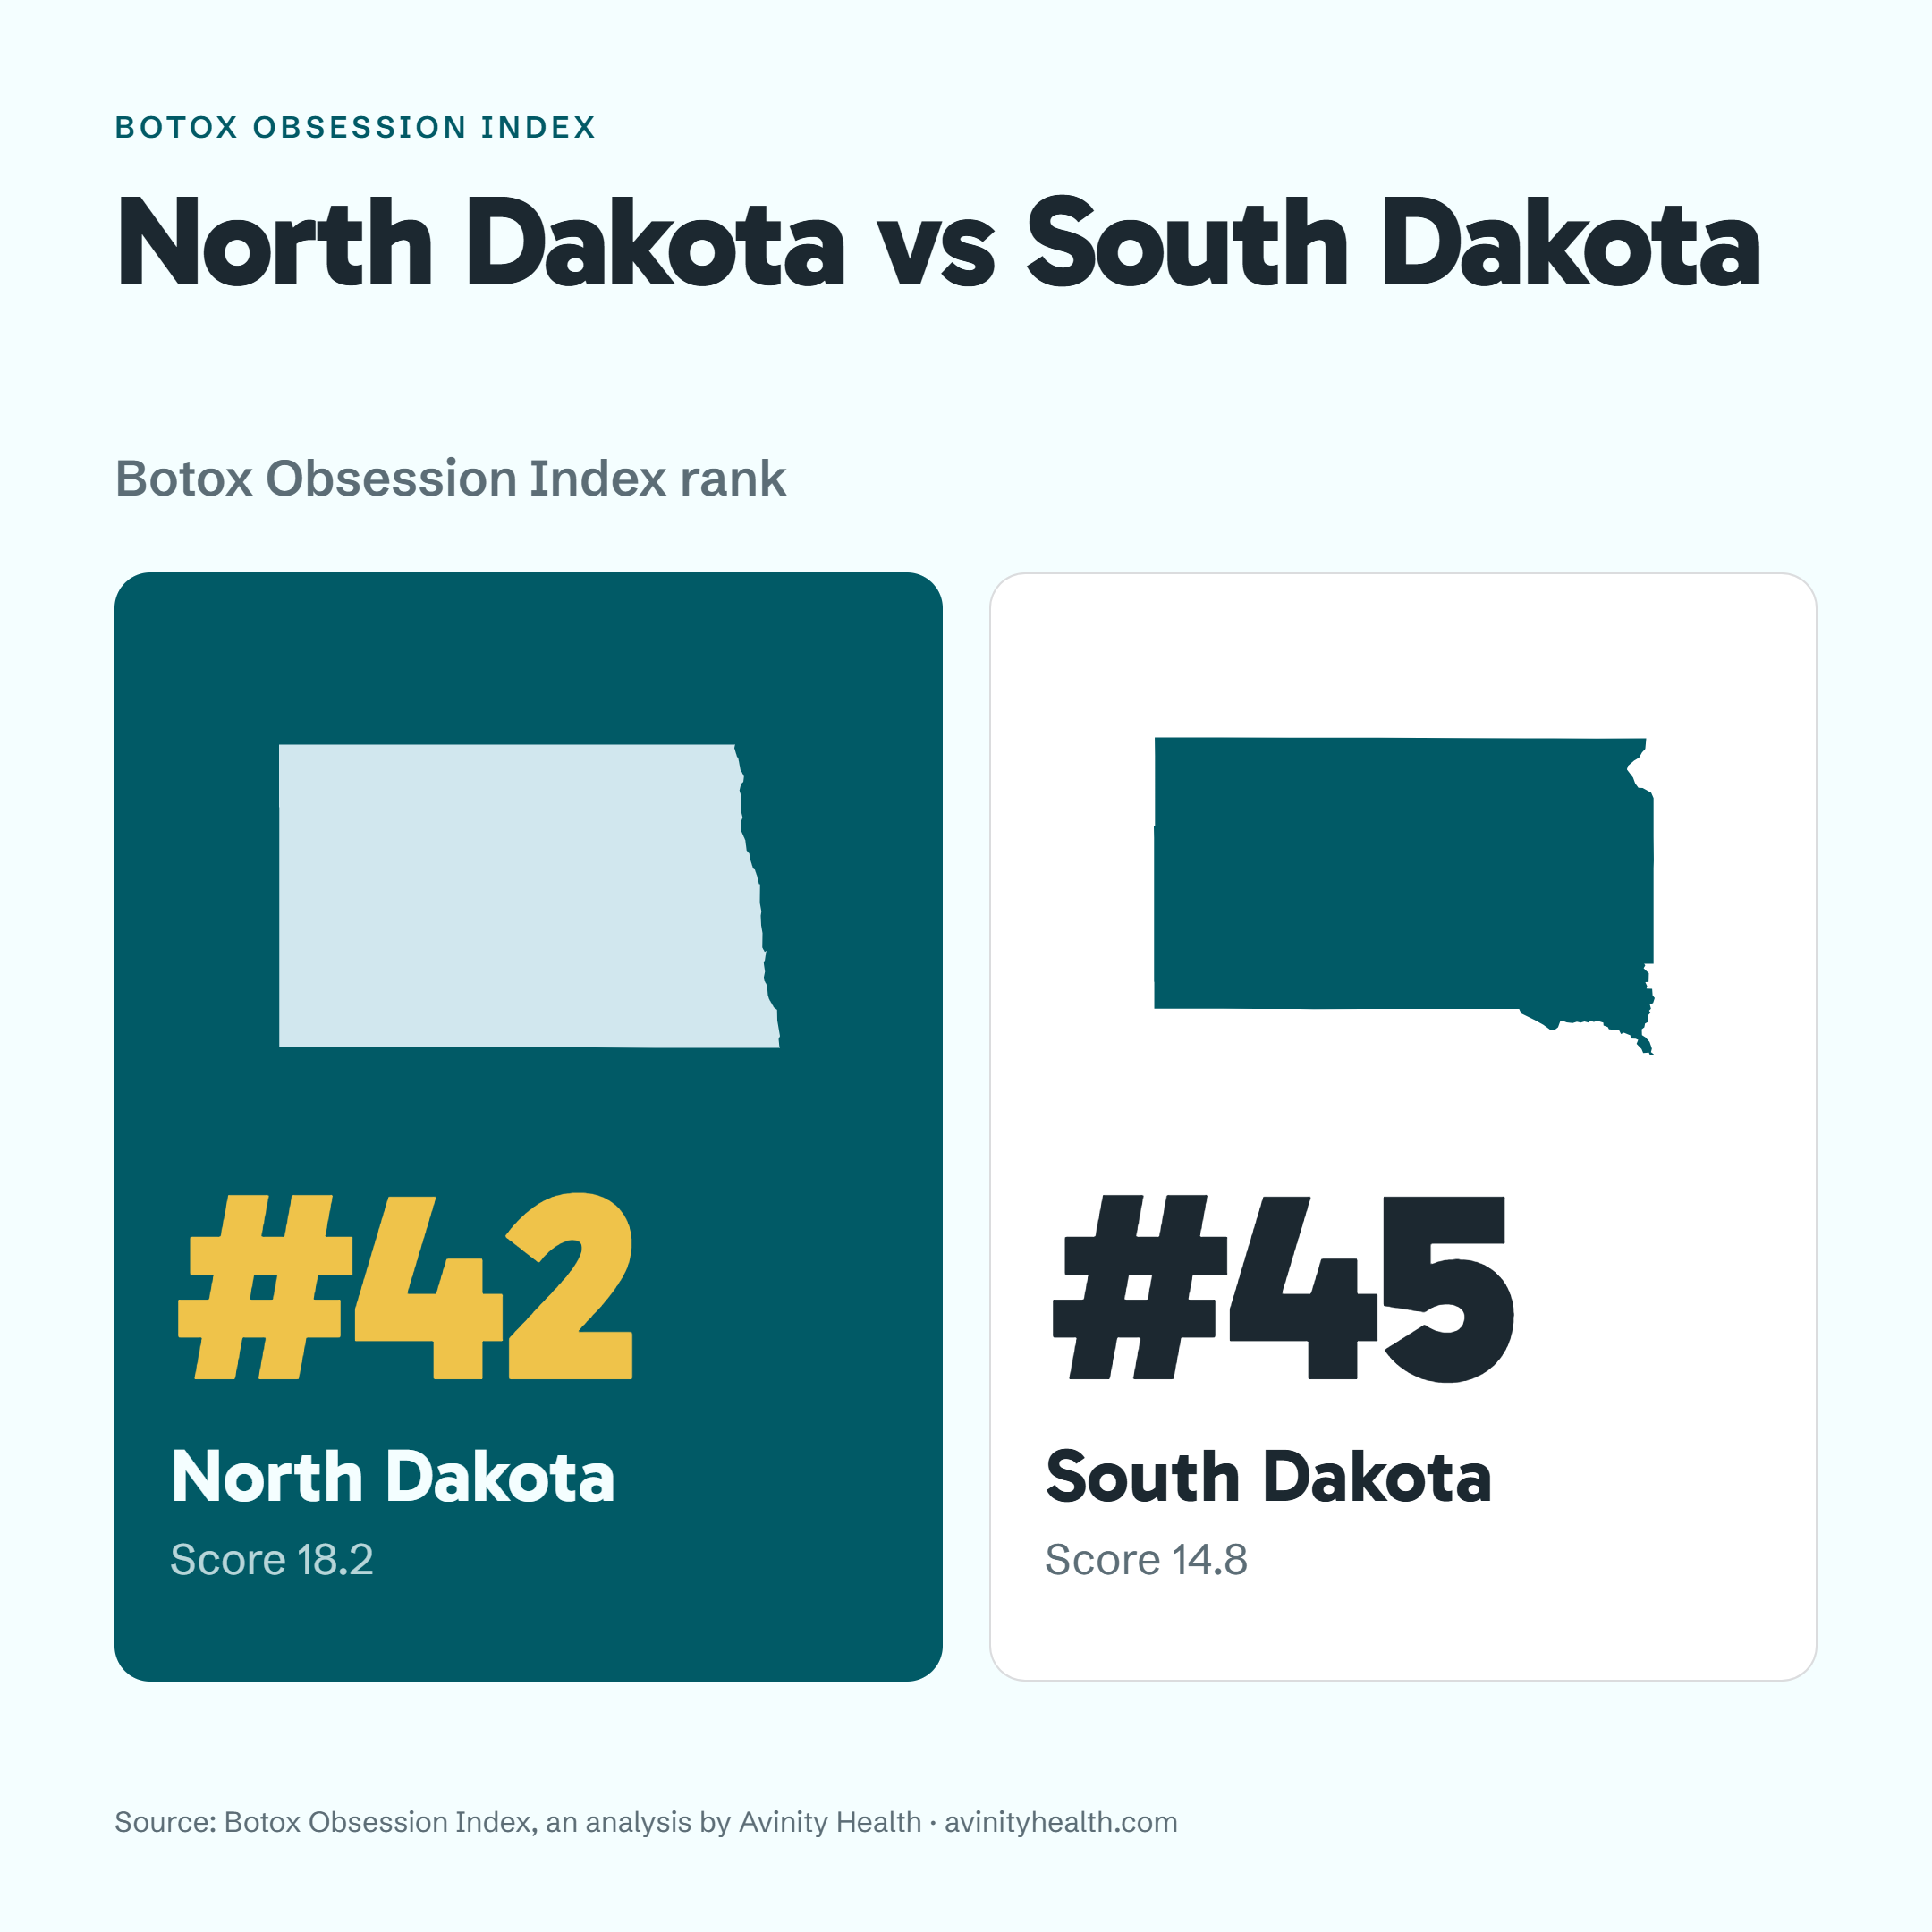
Eleven neighbor and rival matchups, same format.
Need a matchup that is not here, or a different size? Email info@avinityhealth.com and we will build it.
The map is live, not a picture: readers hover or tap any state to see its rank and score. It is free to embed, carries its own source line, and comes in two color schemes. Pick whichever sits better in your layout.
The ramp most newsrooms use for choropleths. No Avinity brand color, so the map reads as data inside your article rather than as a logo.
The version that runs on the study page.
Preview either one directly:news palette ororiginal palette. If you need a still image of the map rather than the live version, both palettes are in the graphics section above.
Three components. Search demand and provider and clinic supply are converted to rates per 100,000 residents. Relative interest is a Google Trends share-of-search measure and is used as published. Each is normalized 0 to 100, then weighted:
Where the 31 terms came from. A candidate list of the 50 highest-volume Botox-related searches in Semrush, pulled in August 2026. Google reports state-level data for 31 of them and no separate figure for the rest, typically because it consolidates near-identical phrasings into one canonical term. Nothing was hand-picked in or out at either step.
What Google Trends actually measures. Not a count of searches. It measures what share of a state's total Google searching was about Botox, rescaled so the highest state reads 100.

Emily Dawson, DHA, MBA, MSN, RN
Co-founder and Clinical Director, Avinity Health
Emily Dawson leads Avinity Health's clinical and aesthetics practice and personally treats patients receiving Botox and other aesthetic procedures. She brings more than 15 years of healthcare leadership experience and previously served as Corporate Director of Quality Assurance at Sun Health.
She holds a Doctor of Health Administration from MCPHS University, where she received the Distinguished Student Award, as well as an MBA and a Master of Science in Nursing.
Available to comment on:
Emily is available for interviews, written comment, phone interviews and broadcast appearances.
Download high-resolution headshot · JPEG, 1000 × 1435
Approved for publication and cleared for the embargo. Please attribute exactly as shown.
On what a per-capita ranking shows
“The states at the top of this list are not the biggest states. They are the states where Botox attention runs highest relative to how many people live there. Colorado beating California is only visible because we divided everything by population before ranking anything.”
On the gap between demand and supply
“Attention and access do not sit in the same places. New York generates more estimated Botox searches per resident than any other state while ranking seventh for providers and clinics per resident, the widest gap in the index where searching runs ahead of supply. That gap is the most useful thing in the data.”
On jaw Botox
“The single most surprising number in the study is masseter Botox. It draws an estimated 74,020 searches a month, second only to the word botox itself, ahead of every classic wrinkle term. That tells you what people are curious about, and it is not foreheads.”
Press inquiries: info@avinityhealth.com · 480-264-6175. Same-day response during the embargo window.
botox-obsession-index-2026.csv: all 50 states with every component score (search per 100,000 residents, providers and clinics per 100,000, relative interest, composite). The ranking can be reproduced from this file. The District of Columbia is included in the file but reported separately from the state ranking; the methodology on the study page explains why.
Please credit "the Botox Obsession Index, an analysis by Scottsdale-based Avinity Health" and link to the study page. The embed and all graphics carry the credit automatically.
Avinity Health is a physician-guided longevity, wellness and medical aesthetics practice in Scottsdale, Arizona. The practice provides evidence-informed treatments spanning health optimization, regenerative medicine and aesthetics, with care delivered by licensed clinicians under physician oversight. Avinity Health focuses on combining medical guidance, individualized treatment plans and transparent patient education across its services.